概要
このエントリでは、Pythonでデータを扱うWEBアプリを作るためのフレームワーク、「Streamlit」を使って、表を書くアプリを作ってみます。
対象読者
- Streamlitを使ったことがない方
- Pythonは使ったことがある方
準備
使用した環境
- Windows10 Pro / Python3.7 for Windows
- Streamlit 0.61.0
Streamlitのインストール
Stremlitのサイトにある、「Getting Started」に従い、Streamlitを導入します。
すでにPython3が入っている状態で、下記を実行しました。
pip3 install streamlit
関連パッケージが順次1-2分程度でダウンロードされ、インストールが終わりました。筆者の環境では、下記のようなものが追加されました。
Installing collected packages: decorator, validators, click, pathtools, watchdog, astor, blinker, docutils, jmespath, botocore, s3transfer, boto3, base58, pillow, MarkupSafe, jinja2, ipython-genutils, traitlets, pickleshare, parso, jedi, wcwidth, prompt-toolkit, backcall, pygments, ipython, tornado, pywin32, jupyter-core, pyzmq, jupyter-client, ipykernel, attrs, pyrsistent, zipp, importlib-metadata, jsonschema, nbformat, pywinpty, terminado, Send2Trash, prometheus-client, pyparsing, packaging, bleach, testpath, pandocfilters, mistune, entrypoints, defusedxml, nbconvert, notebook, widgetsnbextension, ipywidgets, pydeck, toolz, altair, tzlocal, enum-compat, toml, protobuf, cachetools, streamlit
サンプル
サンプルを起動してみます。4種類のデモが入っています。
streamlit hello
コンソールのログは下記の通り。アプリが起動しているURLが示されています。ローカルだけでなく、ネットワークにも公開してくれる感じですね。
Welcome to Streamlit!
If you're one of our development partners or you're interested in getting
personal technical support or Streamlit updates, please enter your email
address below. Otherwise, you may leave the field blank.
Email:
Privacy Policy:
As an open source project, we collect usage statistics. We cannot see and do
not store information contained in Streamlit apps. You can find out more by
reading our privacy policy at: https://streamlit.io/privacy-policy
If you'd like to opt out of usage statistics, add the following to
%userprofile%/.streamlit/config.toml, creating that file if necessary:
[browser]
gatherUsageStats = false
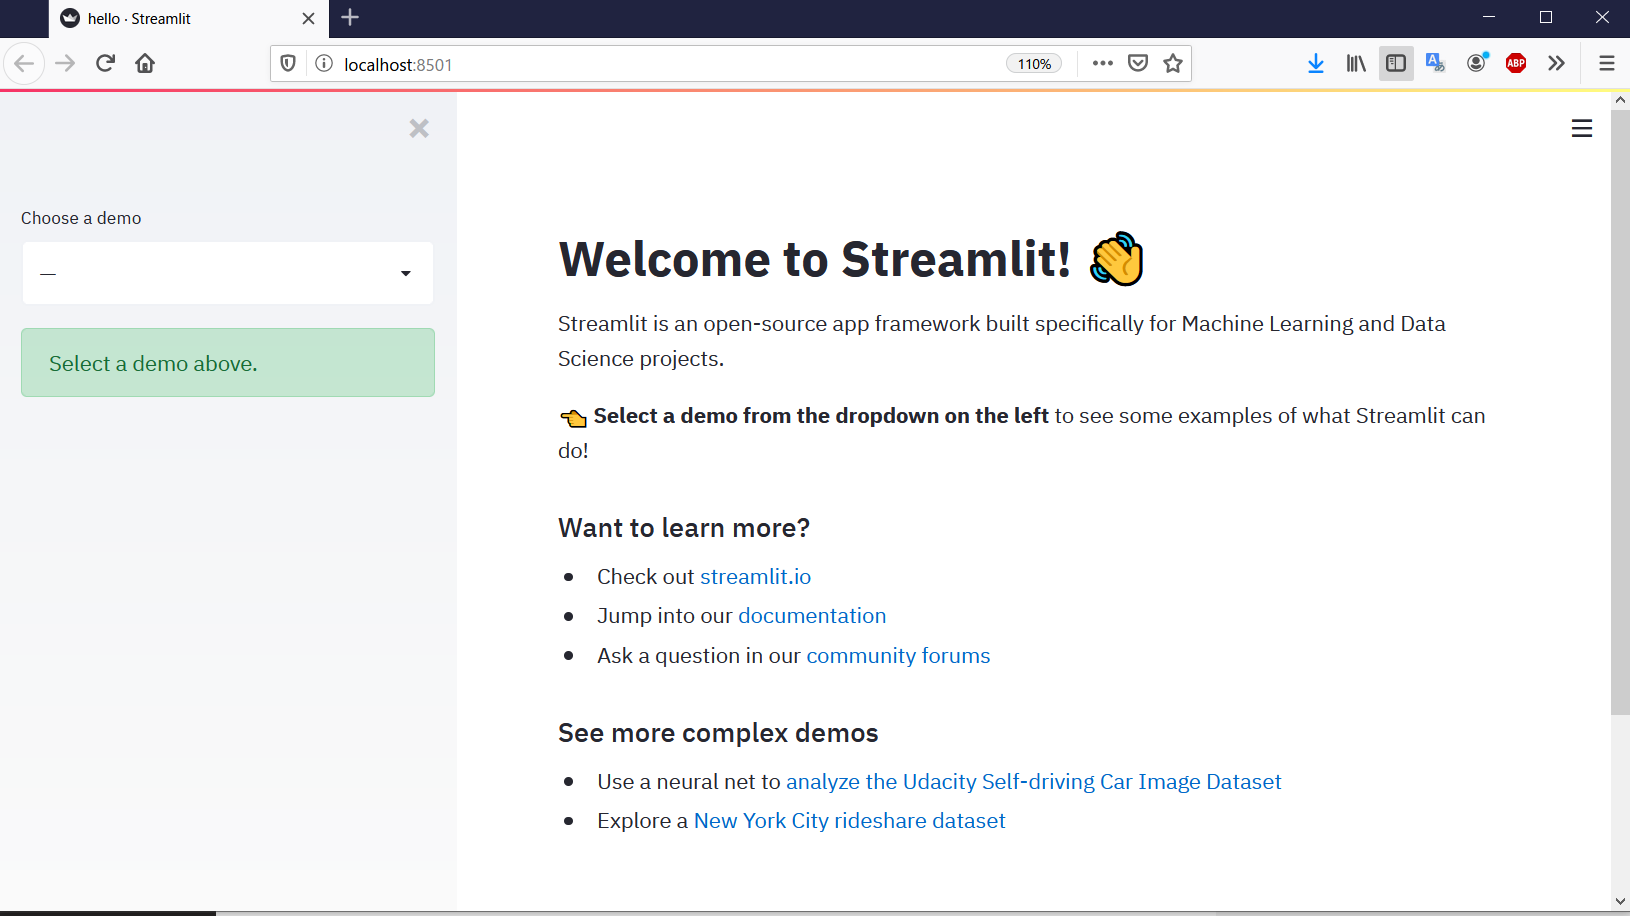
You can now view your Streamlit app in your browser.
Local URL: http://localhost:8501
Network URL: http://192.168.11.12:8501
画面が起動します。見た目、スタンダードな感じでまとまっており、筆者は「いいもん使ってる感」を持ちました。
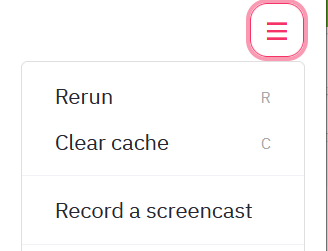
メニューは下記のようなものがあります。

ここまで動けば準備はOKです。
書いてみる
順次、コードを足しつつ動かしてみます。
まずは空のファイルで動かす
下記のコードを書き、
import streamlit as st
import numpy as np
import pandas as pd
実行します。
streamlit run my-first-stream-app.py
ブラウザに、何もないページが表示されます。

タイトルを足してみる
下記のように、一行かけ追加して....
import streamlit as st
import numpy as np
import pandas as pd

st.title('My first Streamlit app')
メニューからRerun
タイトルが出ました!

こんな感じでコードを書いて動かしながら確認できます。
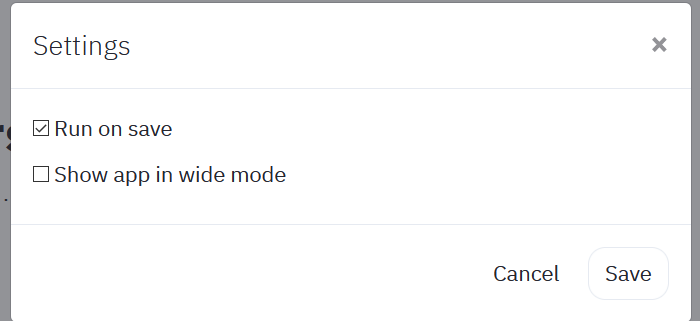
「Settings」で、「Run on save」をチェックしておくと、コードを変えたら自動でRerunしてくれるので、手間が省けます。
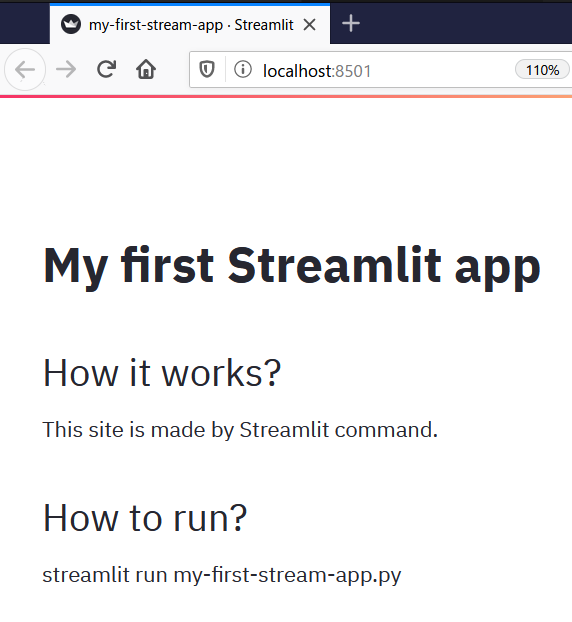
magic
APIを呼ばずとも、Markdown書いてあげると、サイトに反映される機能があります。ザクっと説明を書くのに便利そうです。
import streamlit as st
import numpy as np
import pandas as pd


"""
# My first Streamlit app

## How it works?

This site is made by Streamlit command.

## How to run?

streamlit run my-first-stream-app.py

"""
データを読んで表を書いてみる
EUのOpen Data Portalから、covid19関連のデータを使わせていただきました。
pandasでデータを読んで、st.write() してあげると....
import streamlit as st
import numpy as np
import pandas as pd


"""
# My first Streamlit app
"""

# from EU Open Data Portal
# https://data.europa.eu/euodp/en/data/dataset/covid-19-coronavirus-data/resource/260bbbde-2316-40eb-aec3-7cd7bfc2f590
DATA_URL = ('rlFv89qP')
DATE_COLUMN = 'dateRep'


def load_data(nrows):
    data = pd.read_csv(DATA_URL, nrows=nrows)
    lowercase = lambda x: str(x).lower()
    data.rename(lowercase, axis='columns', inplace=True)
    #data[DATE_COLUMN] = pd.to_datetime(data[DATE_COLUMN])
    return data

# Create a text element and let the reader know the data is loading.
data_load_state = st.text('Loading data...')
# Load 10,000 rows of data into the dataframe.
data = load_data(10000)
# Notify the reader that the data was successfully loaded.
data_load_state.text('Loading data...done!')

st.write(data)
画面に表が出力されました。

この時点で、ソートしたりスクロールしたりできます。

上の動画は、Streamlitの「Record a screencast」機能で取得したWEBM形式のムービーをGIFに変換したものです。サクッとアプリ書いて、ムービーをキャプチャまでできてしまうのは便利ですね。
おわりに
このエントリでは、Streamlitを導入し、CSVを表示するWEBアプリを作って動かすところまで紹介しました。Streamlitというものを知ってから、このQiitaのエントリを書くの含めて1.5時間くらいで終わりました。
このエントリでは扱いませんでしたが、ボタンやチェックボックスのユーザ入力用の部品を載せて、インタラクティブなアプリにすることも可能なAPIがついています。
データをWEBアプリの形で人に見せるときに、便利なツールである可能性を筆者は感じました。