1. はじめに
Facebook の予測ツール Prophet ですが、v0.2 から追加された新機能に Extra Regressors というものがあります。
これは Prophet のモデルに外部変数を追加できるという大変便利な機能です。
この記事ではこの Extra Regressors の使い方を紹介したいと思います。
2. データ
まずはデータを作ります。
今回利用するデータは、年周期としてサインカーブ(sin)を持つ時系列データで、誤差項が標準正規分布に従います。
このデータに標準正規分布から生成した外部変数(x)を5倍したものを加えます。
ds <- seq(as.Date("2015-01-01"), as.Date("2017-12-31"), by="days")
x <- rnorm(length(ds))
sin <- sin(2 * pi * (as.integer(ds) %% 365) / 365)
y <- 5 * x + sin + rnorm(length(ds))
df <- data.frame(ds, y, x)
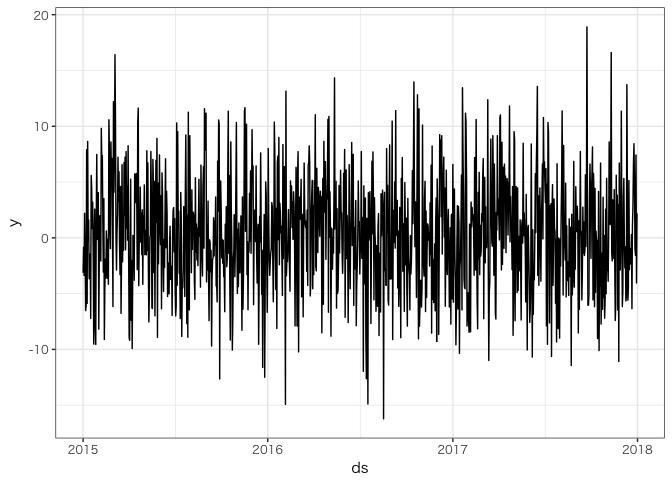
データのグラフは次のようになります。
library(ggplot2)
ggplot(df, aes(ds, y)) + geom_line()
外部変数 x の影響が強すぎて、このグラフからはサインカーブがはっきりとは見えません。
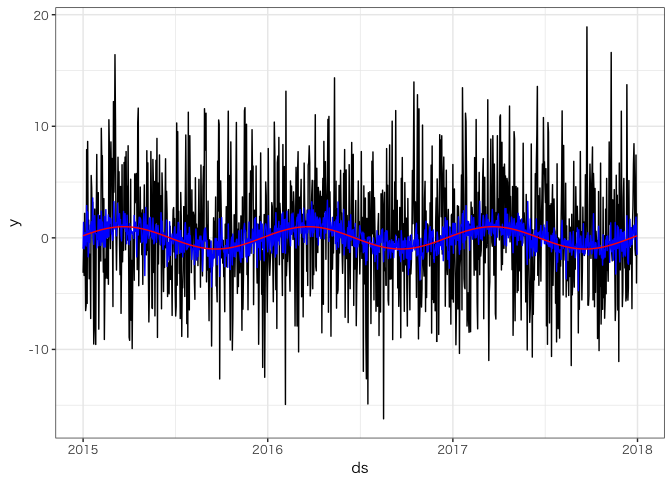
各成分をわかりやすく描くと次のようになります。
ggplot(df, aes(ds, y)) + geom_line() +
  geom_line(aes(y = y - 5 * x), color = "blue") +
  geom_line(aes(y = sin), color = "red")
サインカーブ(赤線)に誤差(青線)が加わったデータに、さらに外部変数 xが加わっています。
このデータから外部変数の影響をうまく取り除いて、サインカーブを推定したいというのが今回の目的です。
3. 外部変数を使わない場合
まずは外部変数を考慮せずに Prophet で学習してみます。
library(prophet)

m <- prophet(df, weekly.seasonality = F, daily.seasonality = F)
fore <- predict(m, df)
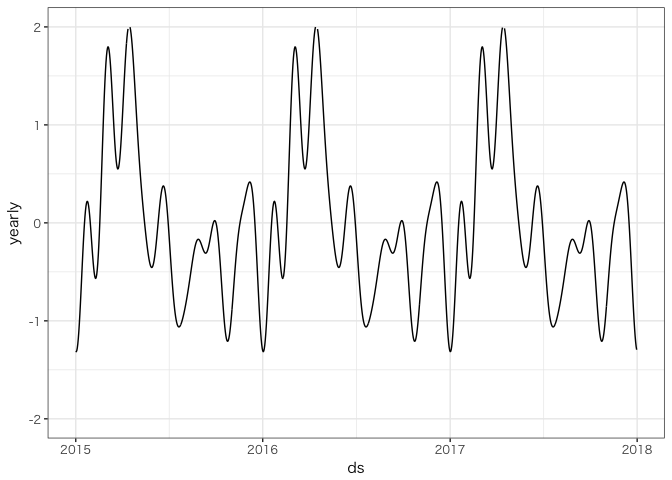
ggplot(fore, aes(ds, yearly)) + geom_line() + ylim(-2, 2)
外部変数を考慮しない場合、年周期としてサインカーブをうまく推定できません。
4. Extra Regressions のモデル
Prophet v0.2 で使えるようになった Extra Regressions のモデルを数式で書くと次のように表せます。
$$
y = f(t) + \beta x + \varepsilon
$$
つまり、通常の時系列データに外部変数 $x$ の項を付け加えたモデルとなります。
今回の場合、$f(t) = \sin(t)$ なので、次のようになります。
$$
y = \sin(t) + \beta x + \varepsilon
$$
$\beta = 5$ ですが、これは未知のパラメータとして推定します。
$x$ の値は既知です。
5. 外部変数を使う
いま、このデータにおいて外部変数 x が既知とします。
このとき、x を Extra Regressor としてモデルに追加できます。
次のように、使用するデータに x の列を追加してください。
head(df)
##           ds         y          x
## 1 2015-01-01 -3.134407 -0.4318422
## 2 2015-01-02 -0.846396 -0.4471872
## 3 2015-01-03 -3.371881 -0.4785726
## 4 2015-01-04  2.196443  0.4171454
## 5 2015-01-05 -1.629627 -0.4179006
## 6 2015-01-06 -6.519245 -1.1871639
まず、prophet() 関数にデータを渡さず、fit = FALSE を渡します。
こうすることで、モデルの設定と推定を分離できます。
add_regressor() 関数でこのモデルに外部変数を追加します。
fit.prophet() 関数でモデルの推定を行うことができます。
library(prophet)

# モデルの推定をせず、設定のみを行う
m2 <- prophet(fit = FALSE, weekly.seasonality = F, daily.seasonality = F)
# 外部変数としてデータ中の x を使うように設定する
m2 <- add_regressor(m2, "x", standardize = FALSE)
# モデルの推定
m2 <- fit.prophet(m2, df)
fore <- predict(m2, df)
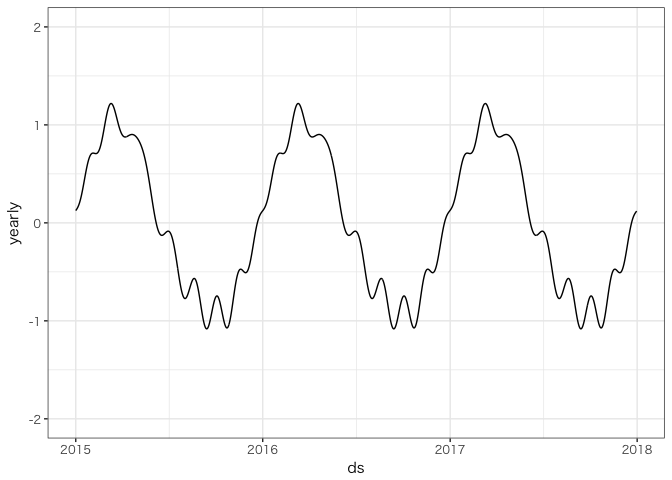
ggplot(fore, aes(ds, yearly)) + geom_line() + ylim(-2, 2)
グラフ中の年周期(yearly)にサインカーブが推定されました。1
次のようにすることで、外部変数 $x$ の係数 $\beta$ がおよそ 5 と推定されていることがわかります。
library(dplyr)
fore2 <- fore %>% mutate(ds = as.Date(ds)) %>% select(ds, x_effect = x)
res <- df %>% left_join(fore2, by="ds") %>% mutate(beta = x_effect / x)
head(res)
##           ds         y          x  x_effect     beta
## 1 2015-01-01 -3.134407 -0.4318422 -2.194653 5.082071
## 2 2015-01-02 -0.846396 -0.4471872 -2.272637 5.082071
## 3 2015-01-03 -3.371881 -0.4785726 -2.432140 5.082071
## 4 2015-01-04  2.196443  0.4171454  2.119962 5.082071
## 5 2015-01-05 -1.629627 -0.4179006 -2.123801 5.082071
## 6 2015-01-06 -6.519245 -1.1871639 -6.033251 5.082071
6. 複数の Extra Regressor を使う
外部変数は複数追加することができます。
データに外部変数として sin の列を追加し、その影響を取り除いてみましょう。
df2 <- df %>% mutate(sin = sin)
head(df2)
##           ds         y          x       sin
## 1 2015-01-01 -3.134407 -0.4318422 0.1882267
## 2 2015-01-02 -0.846396 -0.4471872 0.2051045
## 3 2015-01-03 -3.371881 -0.4785726 0.2219215
## 4 2015-01-04  2.196443  0.4171454 0.2386728
## 5 2015-01-05 -1.629627 -0.4179006 0.2553533
## 6 2015-01-06 -6.519245 -1.1871639 0.2719582
m3 <- prophet(fit = FALSE, weekly.seasonality = F, daily.seasonality = F, seasonality.prior.scale = 0.05)
m3 <- add_regressor(m3, "x", standardize = FALSE)
m3 <- add_regressor(m3, "sin", standardize = FALSE)
m3 <- fit.prophet(m3, df2)
fore <- predict(m3, df2)
このモデルは次のように書けます。
$$
y = f(t) + \beta_x x + \beta_{\sin}\sin(t) + \varepsilon
$$
データ原系列 $y = \sin(t) + 5x + \varepsilon$ だったことを思い出すと、サインカーブ $\sin(t)$ と $x$ の影響を除去して残るのは $f(t) = 0$ となるはずです。
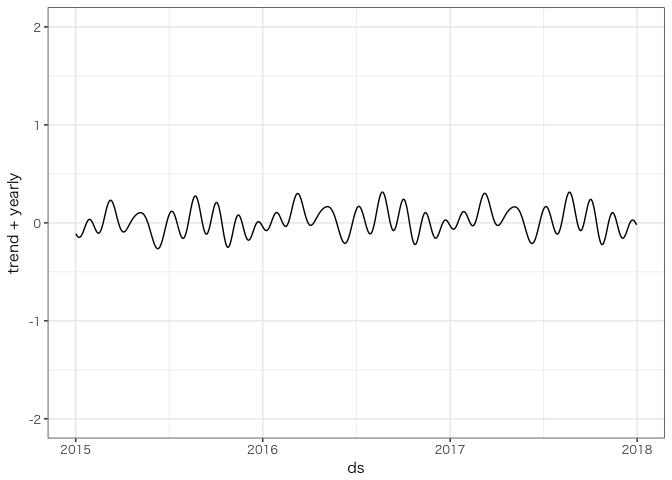
これをグラフで描いてみます。
ggplot(fore, aes(ds, trend + yearly)) + geom_line() + ylim(-2, 2)
$f(t) = 0$ に近いものが得られました。
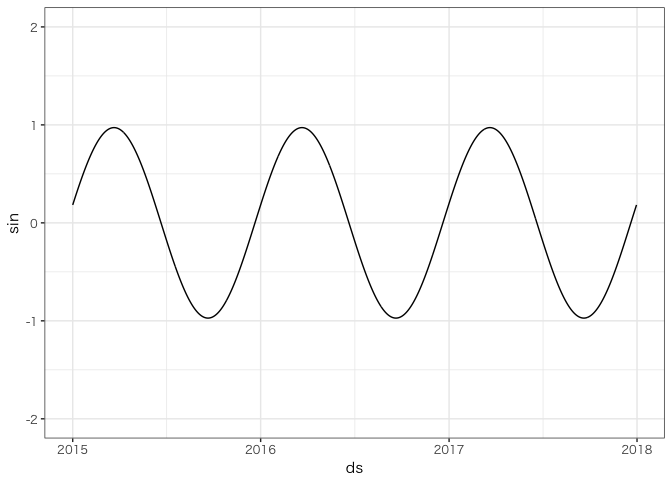
外部変数の影響として抽出されたサインカーブを描くと次のようになります。
ggplot(fore, aes(ds, sin)) + geom_line() + ylim(-2, 2)
真の値 $\beta_x = 5$, $\beta_{\sin} = 1$ に対して、推定された各パラメータは次のようにして算出できます。
library(dplyr)
fore2 <- fore %>% mutate(ds = as.Date(ds)) %>% select(ds, x_effect = x, sin_effect = sin)
res <- df %>% left_join(fore2, by="ds") %>% mutate(beta_x = x_effect / x, beta_sin = sin_effect / sin)
head(res)
##           ds         y          x  x_effect sin_effect  beta_x  beta_sin
## 1 2015-01-01 -3.134407 -0.4318422 -2.194695  0.1829761 5.08217 0.9721046
## 2 2015-01-02 -0.846396 -0.4471872 -2.272681  0.1993830 5.08217 0.9721046
## 3 2015-01-03 -3.371881 -0.4785726 -2.432187  0.2157309 5.08217 0.9721046
## 4 2015-01-04  2.196443  0.4171454  2.120004  0.2320149 5.08217 0.9721046
## 5 2015-01-05 -1.629627 -0.4179006 -2.123842  0.2482301 5.08217 0.9721046
## 6 2015-01-06 -6.519245 -1.1871639 -6.033369  0.2643718 5.08217 0.9721046
それぞれのパラメータの推定値として真値に近いものが得られました。
7. まとめ
Prophet の新機能である Extra Regressors について紹介しました。
参考
-
なぜこんなうねうねしたグラフになるかというと、周期成分はフーリエ級数で近似されるからです。Facebook入門【理論編】のスライド参照 ↩
