Q.
正規分布とか二次曲線とか好きな関数の曲線を描きたいのですが。
A.
基本
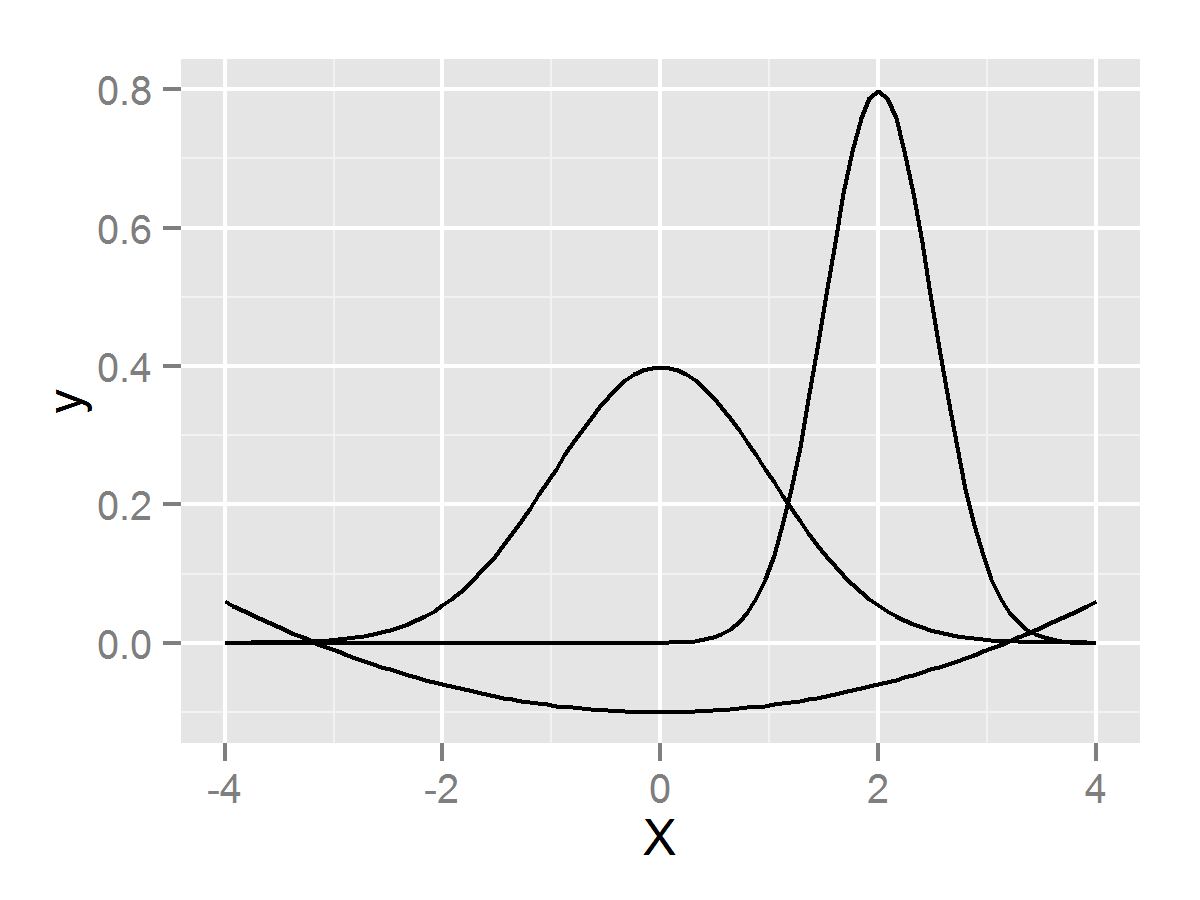
stat_functionを使うのがお手軽です。
library(ggplot2)

p <- ggplot(data=data.frame(X=c(-4,4)), aes(x=X))
p <- p + stat_function(fun=dnorm)
p <- p + stat_function(fun=dnorm, args=list(mean=2, sd=.5))
p <- p + stat_function(fun=function(x) 0.01*x^2-0.1)
ggplotで描画範囲を指定して、stat_functionのfun=で関数を指定します。関数に引数がある場合はargs=でlistを渡します。

例外: 関数ごとに描画範囲が異なる場合
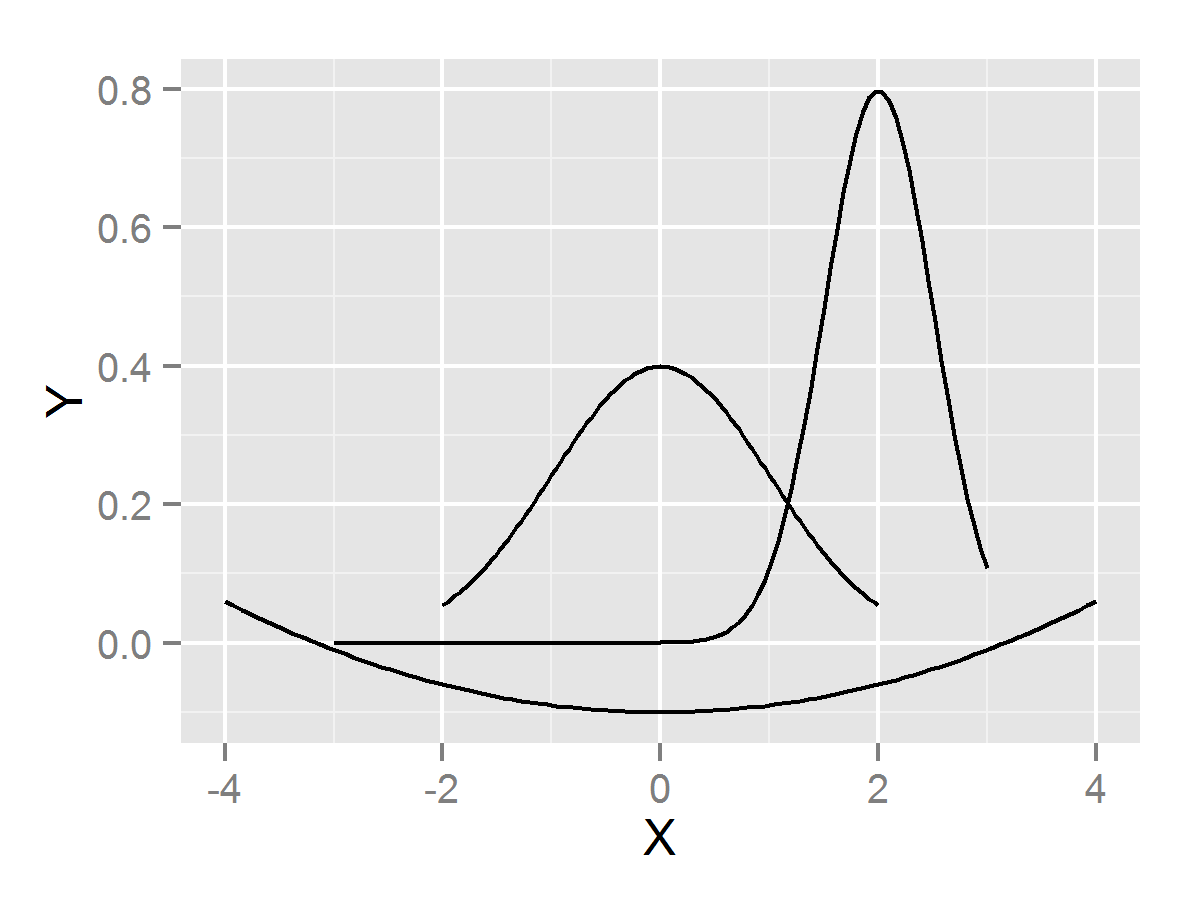
geom_pathを使います。
library(ggplot2)

p <- ggplot()
p <- p + geom_path(data=data.frame(X=x<-seq(-2,2,len=101), Y=dnorm(x)), aes(x=X,y=Y))
p <- p + geom_path(data=data.frame(X=x<-seq(-3,3,len=101), Y=dnorm(x, mean=2, sd=.5)), aes(x=X,y=Y))
p <- p + geom_path(data=data.frame(X=x<-seq(-4,4,len=101), Y=0.01*x^2-0.1), aes(x=X,y=Y))
X軸の値とY軸の値を持つdata.frameを作ってgeom_pathに渡して線分がつながったものとして描画します。上のコード例ではgeom_path内でxに値を代入しつつdata.frameにしているおかげで、後ろのdnormでそのxを使える点に注意です。
応用編: パラメータの値を振った関数を重ねて描く
複数のggplot2要素を関数で渡したいを参考にします。
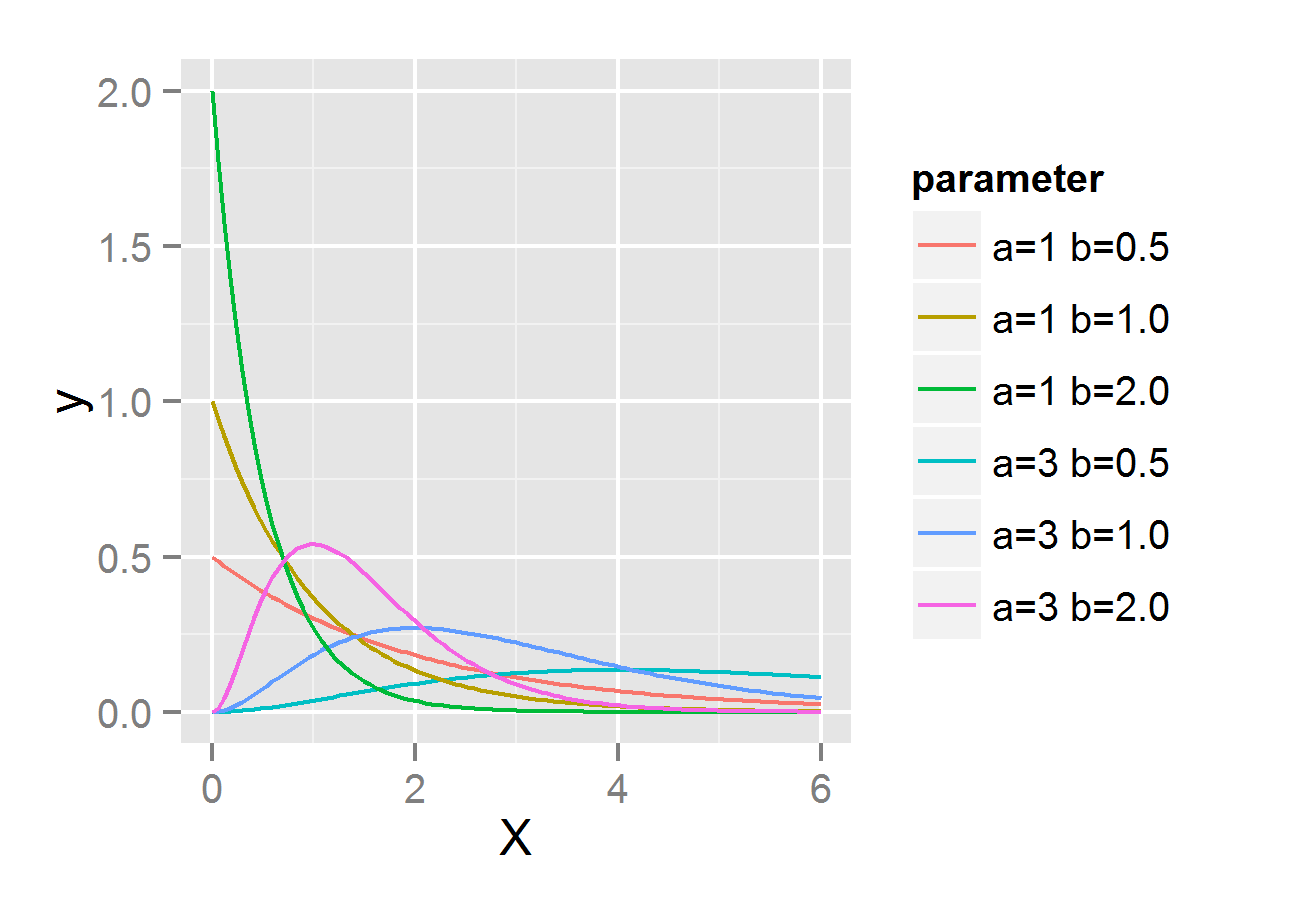
まずはガンマ分布のshapeパラメータを1,3、rateパラメータを0.5, 1, 2で振って描いた例です。
library(ggplot2)

ab <- expand.grid(a=c(1, 3), b=c(.5, 1, 2))
p <- ggplot(data.frame(X=c(0, 6)), aes(x=X)) +
  mapply(
    function(a, b, co) stat_function(fun=dgamma, args=list(shape=a, rate=b), aes_q(color=co)),
    ab$a, ab$b, sprintf("a=%.0f b=%.1f", ab$a, ab$b)
  )
p <- p + labs(color="parameter")
こういう時はmapplyを使うと便利なのでした。aesは凡例(legend)をつけるために設定しています。ただし、普通のaesではcoが列名と解釈されてしまうので、aes_qを使ってquoteされた文字列を渡せるようにしています。aes_qはggplot2の1.x系で新しく実装されたようです。
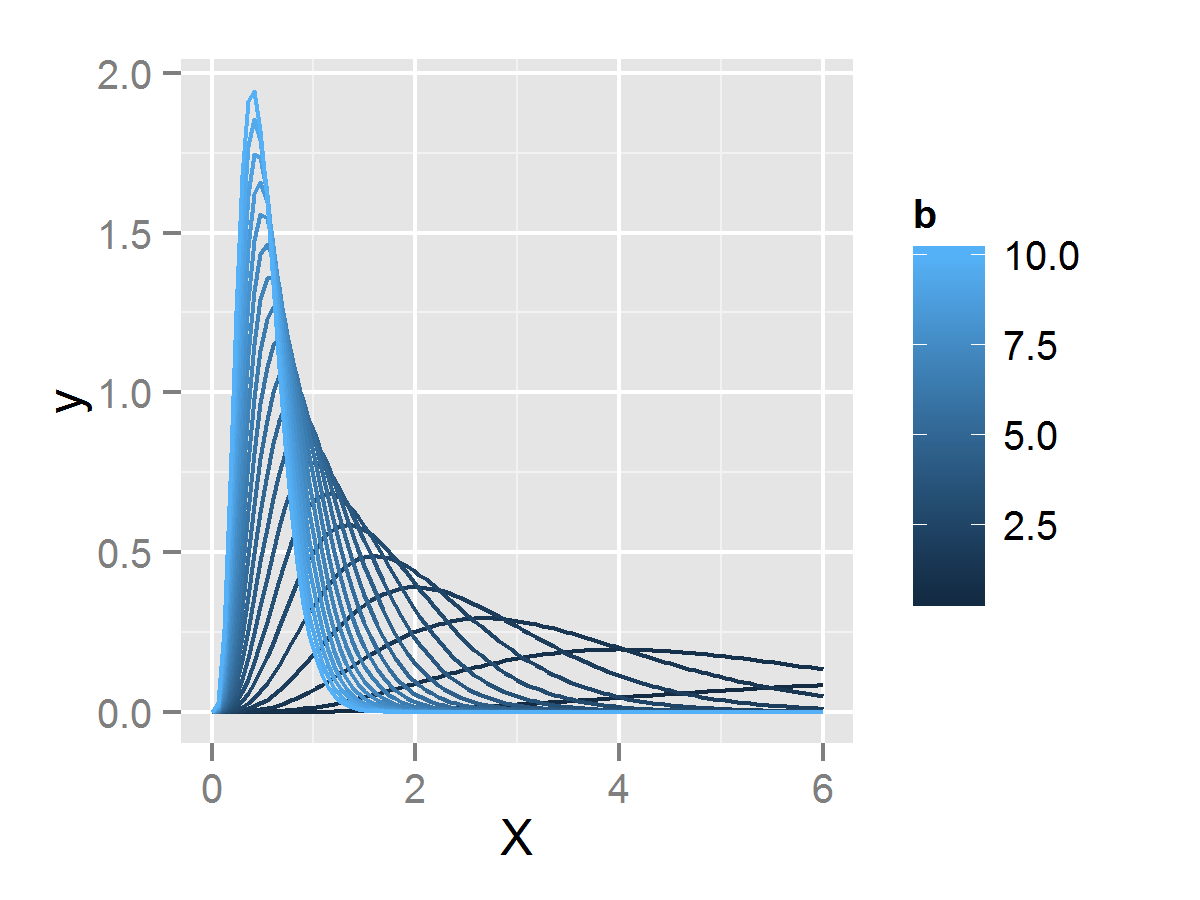
次にガンマ分布でshapeパラメータは5で固定して、rateパラメータを0.5~10で0.5刻みで変化させたものを描きます。
library(ggplot2)

b <- seq(.5, 10, by=.5)
p <- ggplot(data.frame(X=c(0, 6)), aes(x=X)) +
  mapply(
    function(a, b, co) stat_function(fun=dgamma, args=list(shape=a, rate=b), aes_q(color=co)),
    5, b, b
  )
p <- p + labs(color="b")
参考資料
http://docs.ggplot2.org/current/stat_function.html
http://d.hatena.ne.jp/dichika/20111117/1321491147
http://stackoverflow.com/questions/17649759/fitting-gaussian-to-data-geom-point-in-ggplot2/
http://docs.ggplot2.org/dev/aes_string.html


