Q.
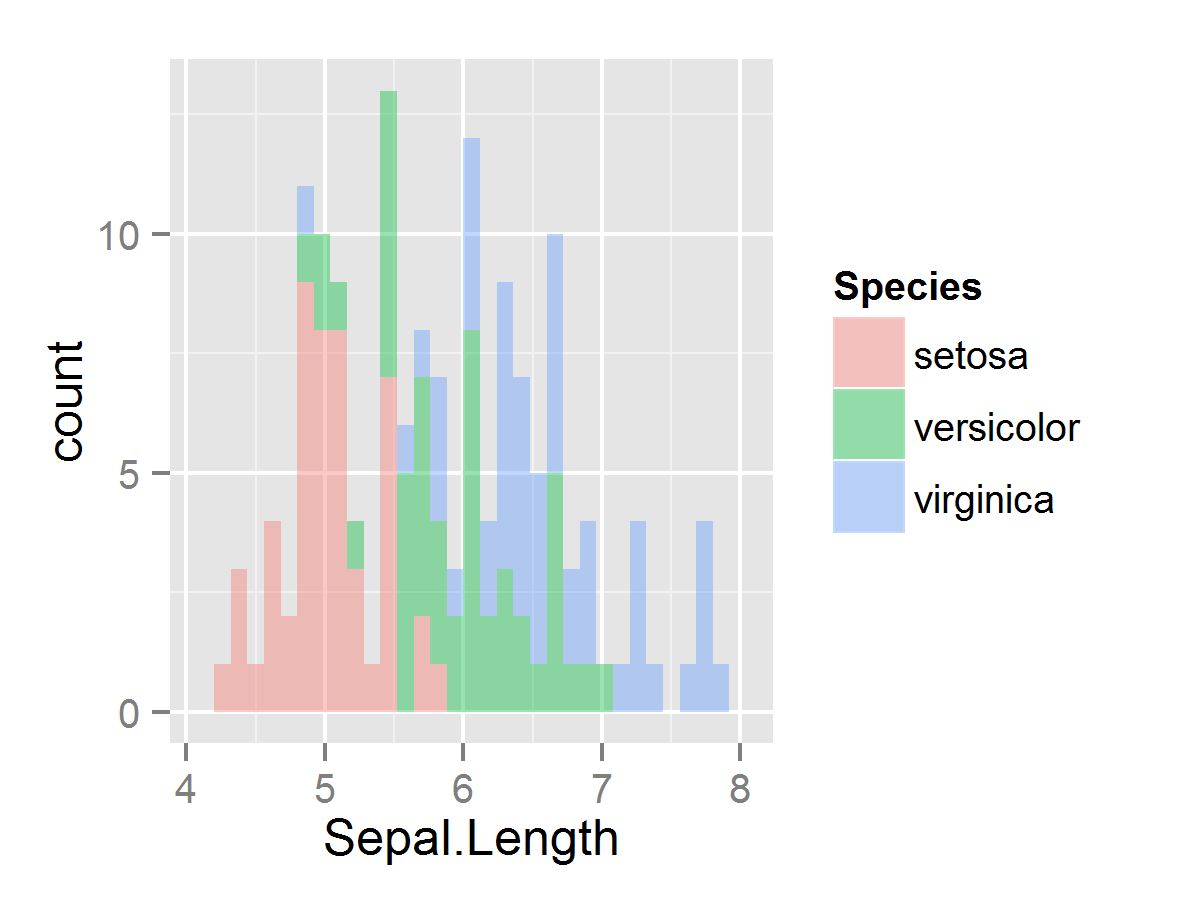
複数のhistogramを重ねて1枚の図の中に描きたいです。density plotだとうまくいくんですけど、histogramだと以下みたいに積み上げ棒グラフになっちゃってうまくいかないんです。
NG_example.R
library(ggplot2)

ggplot(data=iris, aes(x=Sepal.Length, fill=Species)) + geom_histogram(alpha=0.4)
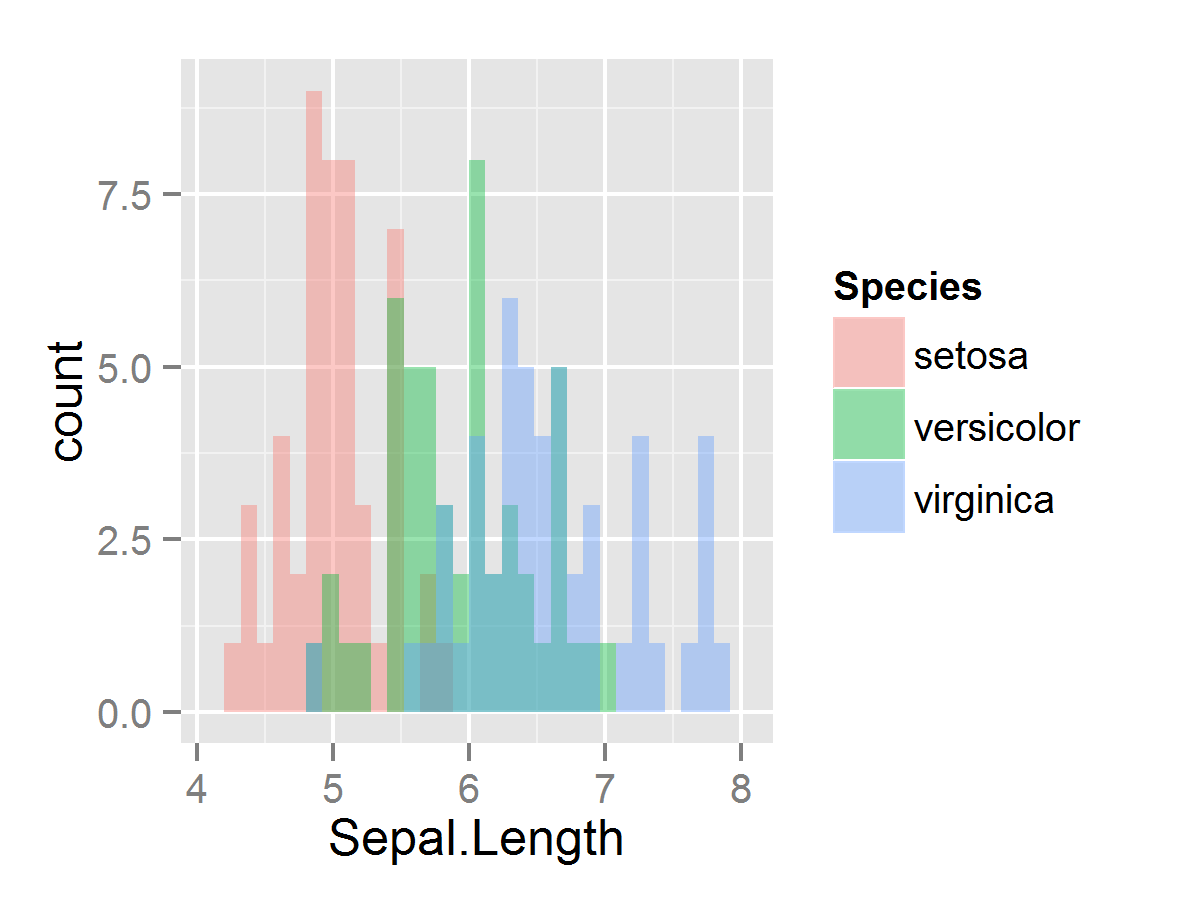
A.
geom_histogramのデフォルトのpositionがstackなのが原因です。
http://docs.ggplot2.org/current/geom_histogram.html
identityを指定することで望みの図を得ることができます。
OK_example.R
library(ggplot2)

ggplot(data=iris, aes(x=Sepal.Length, fill=Species)) + geom_histogram(alpha=0.4, position="identity")
positionの詳細については以下のページの「Position adjustments」のところを見てください。
http://docs.ggplot2.org/current/
参考資料