Fringe81 Advent Calendar 18日目でございます。
ワタクシ個人の感覚に沿って、折れ線部分を装飾していきたいと思います。
※今回成果物をGIFアニメで書き出して、ガタガタ動いているように見えますが、実際はもっと滑らかです
基本形
<svg viewBox="0 0 1000 1000">
  <line x1="10" y1="10" x2="10" y2="110" stroke="gray"/>
  <line x1="10" y1="110" x2="210" y2="110" stroke="gray"/>
  <path stroke="red" fill="none" d="M 10 50 L 60 33 110 45 160 84 210 52"/>
</svg>
- プレーンな初期タイプ

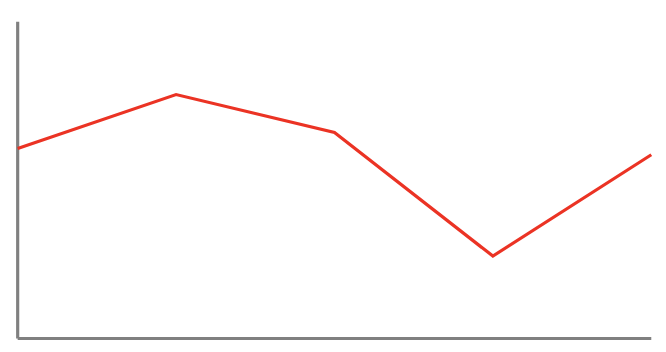
X,Y軸を描いて、折れ線グラフを描きました。寂しい。。
というわけでちょっと装飾していきたいと思います。
にょきにょきっと生やしたい
やってみる
なんかぺたっとしていて、出てきた感動が無い。徐々に生やす感じに出来ないものか。。
アニメーションすれば良いんじゃないか、何かいい感じになるんじゃないかもしかしたら!
<svg viewBox="0 0 1000 1000">
  <line x1="10" y1="10" x2="10" y2="110" stroke="gray"/>
  <line x1="10" y1="110" x2="210" y2="110" stroke="gray"/>
  <path stroke="red" fill="none" d="">
    <animate attributeName="d" dur="2s" fill="freeze"
             from="M 10 50 L 10 50 10 50 10 50 10 50"
             to="M 10 50 L 60 33 110 45 160 84 210 52"/>
  </path>
</svg>
- すごく失敗しているにょきにょき感
うーん、やっぱり事前の無理だろ感の通り、何かぜんぜんコレじゃない。。
徐々にあるべき場所にマッピングではなく、何もないところから徐々に最終形態を描き出して欲しい。。
色々やり方を探ってみたら、破線のコントロールでいい感じに。
トリッキーに感じますが、これ以外のやり方は段階的に複数のlineをanimateさせていくようなやり方しか無いと思うので、とりあえず簡単にはやるには良いのかなと。
改善
<svg viewBox="0 0 1000 1000">
  <line x1="10" y1="10" x2="10" y2="110" stroke="gray"/>
  <line x1="10" y1="110" x2="210" y2="110" stroke="gray"/>
  <path stroke-dasharray="500" stroke="red" fill="none" d="M 10 50 L 60 33 110 45 160 84 210 52">
    <animate attributeName="stroke-dashoffset" begin="0s" dur="2s" from="500" to="0"/>
  </path>
</svg>
- イメージ通りのにょきにょき
マーカーを付けたい
やってみる
線が生えているだけだとのっぺりして感じたので、次は折れ部分にマーカーを設置してみたいと思います。
<svg viewBox="0 0 1000 1000">
  <line x1="10" y1="10" x2="10" y2="110" stroke="gray"/>
  <line x1="10" y1="110" x2="210" y2="110" stroke="gray"/>
  <path stroke-dasharray="500" stroke="red" fill="none" d="M 10 50 L 60 33 110 45 160 84 210 52" style="marker: url(#line-marker)">
    <animate attributeName="stroke-dashoffset" begin="0s" dur="2s" from="500" to="0"/>
  </path>
  <marker id="line-marker" markerWidth="3" markerHeight="3" refX="1.5" refY="1.5" stroke="none" fill="red">
    <circle cx="1.5" cy="1.5" r="1.5"/>
  </marker>
</svg>
- ダメじゃないんだけど。。
にょきにょき生やす仕組みと組合せたら先にマーカーだけが表示されています。
うーん、なんか汚く感じるなぁ。。
にょきにょきとマーカーは同期させたい!
改善しようとして失敗
それならば、JavaScriptの力に頼ってみます。
現在、始点を除くと2秒間で4つのマーカーを表示しています。
なので、0.5秒おきに1箇所ずつ書き出していけば良いという事になります。
<svg id="graph" viewBox="0 0 1000 1000">
  <line x1="10" y1="10" x2="10" y2="110" stroke="gray"/>
  <line x1="10" y1="110" x2="210" y2="110" stroke="gray"/>
  <path stroke-dasharray="420" stroke="red" fill="none" d="M 10 50 L 60 33 110 45 160 84 210 52" style="marker: url(#line-marker)">
    <animate attributeName="stroke-dashoffset" begin="0s" dur="2s" from="420" to="0"/>
  </path>
</svg>

<script>
  const graph = document.getElementById('graph');

  const renderMarker = ([x, y], index) => {
    const marker = document.createElementNS('http://www.w3.org/2000/svg', 'circle');
    marker.setAttribute('cx', x);
    marker.setAttribute('cy', y);
    marker.setAttribute('r', '1.5');
    marker.setAttribute('fill', 'red');
    setTimeout(() => graph.appendChild(marker), index * 500);
  };

  [['10', '50'], ['60', '33'], ['110', '45'], ['160', '84'], ['210', '52']].forEach(renderMarker);
</script>
- 線とマーカーの書き出しタイミングが合わない。。
あれ、マーカーの書き出しタイミングと折れ線の書き出しタイミングがずれている。。
再度改善
animateでは2秒を指定しているものの、破線のコントロールを2秒間継続しているだけだったので、
左端から右端まで進む時間が2秒というわけではなかったという事に気づきました。。
さらに徐々にoffsetを短くしていっているので線が描かれるスピードは徐々に速くなっているんではないかと思います。
css-animationのlinearを使ってみます。ここからはちょっと論理的ではなく微調整してみた的な、雑な感じになりますが。。
<style>
  #line {
    stroke-dasharray: 420;
    stroke-dashoffset: 420;
    animation: dash 3.6s linear forwards;
  }

  @keyframes dash {
    to {
      stroke-dashoffset: 0;
    }
  }
</style>
<svg id="graph" viewBox="0 0 1000 1000">
  <line x1="10" y1="10" x2="10" y2="110" stroke="gray"/>
  <line x1="10" y1="110" x2="210" y2="110" stroke="gray"/>
  <path id="line" stroke="red" fill="none" d="M 10 50 L 60 33 110 45 160 84 210 52" style="marker: url(#line-marker)">
  </path>
</svg>

<script>
  const graph = document.getElementById('graph');

  const renderMarker = ([x, y], index) => {
    const marker = document.createElementNS('http://www.w3.org/2000/svg', 'circle');
    marker.setAttribute('cx', x);
    marker.setAttribute('cy', y);
    marker.setAttribute('r', '1.5');
    marker.setAttribute('fill', 'red');
    setTimeout(() => graph.appendChild(marker), index * 500);
  };

  [['10', '50'], ['60', '33'], ['110', '45'], ['160', '84'], ['210', '52']].forEach(renderMarker);
</script>
- なんとか完成!
破線の幅設定を倍にして、アニメーションスピードを3.6秒に設定したところいい感じになりました。
- スピードアップバージョン(マーカー250msおきに表示、アニメーション制御1.7秒設定)
いい感じに破線幅と秒数を算出できそうに思うんですが、知識不足でしたので、やり方が解ったら内容を書き直そうと思います。
以上です。


