はじめに
作成の背景
アルバイト先で非常にめんどくさい資料作成を頼まれた際に、なんとか自動化できないかなと今年の8月ごろに作ってみたものです。
依頼された資料は、ある施設を中心に約100人分の所在地がプロットされた地図をそれぞれ異なる4枚作るというものでした。
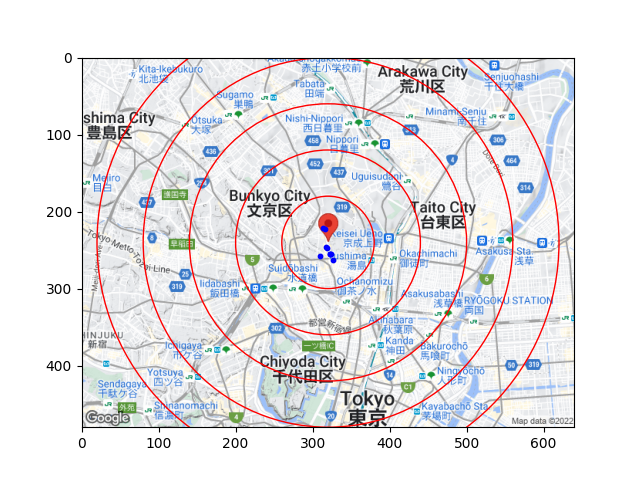
完成イメージ
業務で使っているデータは公開できないので、大学の周りを中心として好きな飲食店をプロットした地図を代わりに作成してみました!業務に使っているものと縮尺を変えていないので、中心に集まってしまっていますが、このような地図ができるイメージです!
環境
MacOS Moterey
Python 3.10.3
googlemaps 4.7.3
実装
まずは、中心座標を得るためにキーワードをもとに緯度経度を取得します。
def get_ll_by_name(keyword: str, googleapikey: str) -> dict[str, float | str]:
    """
        検索のキーワードを用いて特定の場所の緯度と経度を得る

    Args:
        keyword (str): 検索キーワード
        googleapikey (str): apikey

    Returns:
        dict[str, float]:
    """

    gmaps = googlemaps.Client(key=googleapikey)
    result = gmaps.geocode(keyword)
    lat = result[0]["geometry"]["location"]["lat"]
    lng = result[0]["geometry"]["location"]["lng"]
    dic = {"loc": keyword, "lat": lat, "lng": lng}
    return dic
今思えば、同じものを使いまわせたような気がしますが、エクセルファイルを読み込んで緯度経度の辞書のリストを返す関数も作成しています。
def get_ll_by_address(file: str, googleapikey: str) -> list[dict[str, float|str]]:
    """
    業務で与えられるエクセルからプロットする住所を読み取り、緯度経度を得る

    Args:
        file (str): エクセルファイル
        googleapikey (str): apikey

    Returns:
        list[dict[str, float|str]]: プロットする住所の住所・緯度・経度が書かれた辞書のリスト
    """

    df = pd.read_excel(file)
    address_list = []

    # もらったエクセルファイルから完全なデータフレームが得られなかったため
    # 条件を用いて全探索し住所を抽出した
    for column in df.columns:
        for i in range(len(df[column])):
            if ("東京都" in str(df[column][i])) or ("県" in str(df[column][i])):
                address_list.append(df[column][i])

    loc_dicts = []
    gmaps = googlemaps.Client(key=googleapikey)

    for address in address_list:
        geocode_result = gmaps.geocode(address)

        loc = address

        lat = geocode_result[0]["geometry"]["location"]["lat"]
        lng = geocode_result[0]["geometry"]["location"]["lng"]

        loc_dicts.append({"loc": loc, "lat": lat, "lng": lng})

    return loc_dicts
みやすさのために最終的なプロットにはmatplotlibを使うことにしたので、ある地点を中心とする地図画像を取得する関数を作りました。
import urllib
import urllib.error
import urllib.request


def get_image(dic: dict[str, str|float], googleapikey: str):
    """
    原点にしたい場所が中心に来ている地図画像を取得

    Args:
        dic (dict[str, str | float]): 原点にしたい場所
        googleapikey (str): googleapikey
    """

    lat = dic["lat"]
    lng = dic["lng"]
    loc = dic["loc"]

    # htmlの設定
    html1 = "https://maps.googleapis.com/maps/api/staticmap?center="

    # maptypeで取得する地図の種類を設定
    html2 = "&maptype=terrain"

    # sizeでピクセル数を設定
    html3 = "&size=640x480"

    # sensorはGPSの情報を使用する場合にtrueとするので今回はfalseで設定
    html4 = "&sensor=false"

    # zoomで地図の縮尺を設定
    html5 = "&zoom=13"

    # マーカーの位置の設定(マーカーを表示させてくなければ無でも大丈夫)
    html6 = "&markers="

    # key="googleから取得したキーコード"となるように設定
    html7 = "&key="

    html8 = "&style=feature:poi|visibility:off"

    axis = str(lat) + "," + str(lng)

    url = (
        html1
        + axis
        + html2
        + html3
        + html4
        + html5
        + html6
        + axis
        + html7
        + googleapikey
        + html8
    )

    dst_path = str(loc) + ".png"

    try:
        data = urllib.request.urlopen(url).read()
        with open(dst_path, mode="wb") as f:
            f.write(data)

    except urllib.error.URLError as e:
        print(e)
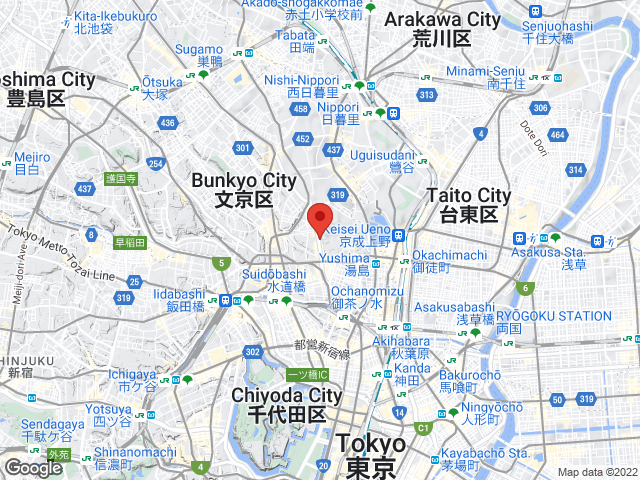
このような画像が取得できます。
geopyというライブラリに2地点のの緯度経度から距離を計算する関数があったので、それを使ったのちに縮尺を用いてピクセル換算の距離を算出しました。こちらを参考にさせていただきました!
def ll_to_pixel(O_dic: dict[str, str|float], dic: dict[str, str|float]) -> tuple[float, float]:
    """
    緯度経度から2点間の距離をピクセルで換算する

    Args:
        O_dic (dict[str, float]): 原点の緯度経度が含まれた辞書
        dic (dict[str, float]): 比較したい点の緯度経度が含まれた辞書

    Returns:
        tuple[float, float]: 2点間のピクセル換算のベクトル
    """


    O_tup = (O_dic["lat"], O_dic["lng"])
    dis_km_x = geodesic((O_dic["lat"], dic["lng"]), O_tup).km
    dis_km_y = geodesic((dic["lat"], O_dic["lng"]), O_tup).km
    if O_dic["lng"] >= dic["lng"]:
        dis_km_x *= -1
    if O_dic["lat"] <= dic["lat"]:
        dis_km_y *= -1

    dis_pixel = (dis_km_x * (2 ** 21) / 40000, dis_km_y * (2 ** 21) / 40000)
    return dis_pixel
最後に、先ほど出力した画像を背景に、matplotlibで各点を描画すると完成です!
def plot(O_dic: dict[str, str|float], loc_dicts: list[dict[str, str|float]], keyword: str, file: str):
    """
    地図画像に住所をプロットする

    Args:
        O_dic (: dict[str, str|float]): 原点の緯度経度が含まれた辞書
        loc_dicts (list[dict[str, str|float]]): プロットしたいてんの緯度経度が含まれた辞書のリスト
        keyword (str): 原点になる場所の検索ワード(画像を取得する際のパスで使用)
        file (str): 業務で与えられるエクセルファイル
    """


    x = []
    y = []

    for dic in loc_dicts:
        x.append(ll_to_pixel(O_dic, dic)[0] + 320)
        y.append(ll_to_pixel(O_dic, dic)[1] + 240)

    fig = plt.figure(figsize=(6.4, 4.8), dpi=100)
    ax = fig.add_subplot(111)

    im = Image.open(f"./{keyword}.png")
    ax.imshow(im)

    ax.scatter(x, y, s=10, color="b")
    ax.set_xlim([0, 640])
    ax.set_ylim([480, 0])

    c1 = patches.Circle(xy=(320, 240), radius=60, fc="None", ec="r")
    ax.add_patch(c1)
    c2 = patches.Circle(xy=(320, 240), radius=120, fc="None", ec="r")
    ax.add_patch(c2)
    c3 = patches.Circle(xy=(320, 240), radius=180, fc="None", ec="r")
    ax.add_patch(c3)
    c4 = patches.Circle(xy=(320, 240), radius=240, fc="None", ec="r")
    ax.add_patch(c4)
    c5 = patches.Circle(xy=(320, 240), radius=300, fc="None", ec="r")
    ax.add_patch(c5)

    # ax.tick_params(labelbottom=False, labelleft=False, labelright=False, labeltop=False)

    fig.savefig(file[:-5] + ".png")
mainファイルはこんな感じです。
from map_automation.api import get_ll_by_name, get_ll_by_address
from map_automation.fig import get_image
from map_automation.plot import plot

import sys

def main(keyword, file, googleapikey):

    O_dic = get_ll_by_name(keyword, googleapikey)
    loc_dicts = get_ll_by_address(file, googleapikey)

    get_image(O_dic, googleapikey)

    plot(O_dic, loc_dicts, keyword, file)


if __name__ == "__main__":
    args = sys.argv
    main(args[1], args[2], args[3])
中心座標の検索キーワード、エクセルファイル名、apikeyをコマンドラインから受け取ります。
おわりに
今となっては結構微妙なモジュール分割をしていますね笑
コードはGithubにも載せているので、全体が見たい方は確認してみてください!
コードを書くのに当たってこちらを参考にさせていただきました!