はじめに
DashというPythonでダッシュボードを作成することができるWebフレームワークでのウェブアプリの作成を行う。なにかできないかなと調査していたところ、地図上に緯度経度情報を使ってデータを重ねられるものを発見したので、それらを元にDashを使って世界遺産を表示するウェブアプリを作ってみる。Plotolyの公式ドキュメントMapbox Map Layers in Pythonを参考にした。
世界地図の表示
Mapbox Map Layers in Python通りやると、以下7行のコードでアメリカの都市をプロットし、プロットの上にカーソルをおくとその都市の情報が表示される。
import pandas as pd
us_cities = pd.read_csv("https://raw.githubusercontent.com/plotly/datasets/master/us-cities-top-1k.csv")

import plotly.express as px

fig = px.scatter_mapbox(us_cities, lat="lat", lon="lon", hover_name="City", hover_data=["State", "Population"],
                        color_discrete_sequence=["fuchsia"], zoom=3, height=300)
fig.update_layout(mapbox_style="open-street-map")
fig.update_layout(margin={"r":0,"t":0,"l":0,"b":0})
fig.show()
上記コードでは、あくまでデータに則って表示をしているだけで、ユーザー側の操作によって動的に更新することはできない。そこでDashを用いて、項目を選択した際に動的に地図を更新していくアプリを作成してみる。例と同じアメリカの都市ではおもしろくないので、代わりに世界遺産のプロットを試みる。UNESCO Wordl Heritage Centrev - SyndicationにExcelデータがあったため、ダウンロードしてCSVファイルに変換したものを扱う。
Dashの使用
上記コードではDashを使用していないので、まずDashを適用する。コードを以下に示す。(Dashを使用する、という日本語が適切かはわからない。。。)
# Run this app with `python app.py` and
# visit http://127.0.0.1:8050/ in your web browser.

import dash
import dash_html_components as html
import dash_core_components as dcc
from dash.dependencies import Input, Output
import plotly.express as px
import pandas as pd

whc = pd.read_csv(
    "c:/***/Dash/data/whc-sites-2019.csv")

external_stylesheets = ['https://codepen.io/chriddyp/pen/bWLwgP.css']

fig = px.scatter_mapbox(whc, lat="latitude", lon="longitude", hover_name="name_en", hover_data=["date_inscribed", "states_name_en", "category", ],
                        color_discrete_sequence=["fuchsia"], zoom=3, height=300)
fig.update_layout(mapbox_style="open-street-map")
fig.update_layout(margin={"r": 0, "t": 0, "l": 0, "b": 0})

app = dash.Dash(__name__, external_stylesheets=external_stylesheets)

app.layout = html.Div([
    html.H2(children='World Hesitate Cite (2019)'),
    dcc.Graph(id='whc-map', figure=fig)
])

if __name__ == '__main__':
    app.run_server(debug=True)
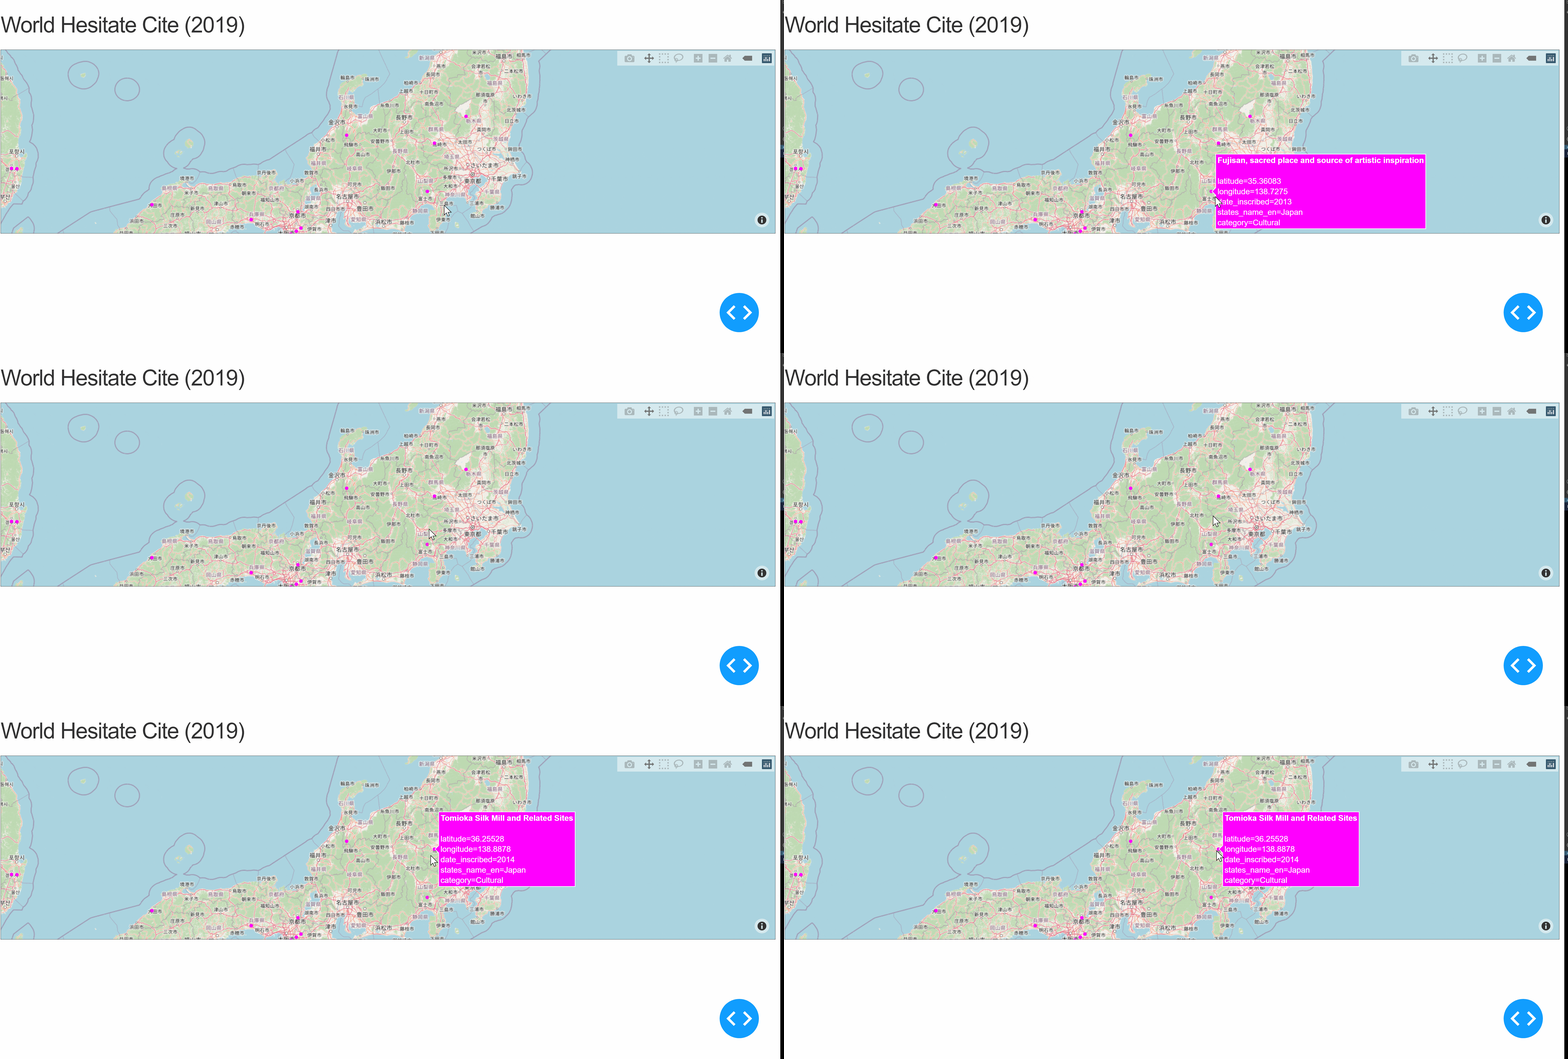
上記ファイルを実行して、http://127.0.0.1:8050/にアクセスすると以下のような結果が得られる。

Dropdown, CheckList
項目を選択することで、フィルタリングをかけられるようにする。項目は、地域を表す「Region」と文化遺産・自然遺産・複合遺産を表す「Category」の2つを用いる。「Region」はDropdownで、「Category」はCheckListにて選択することにする。コードを以下に示す。
(2021/3/2追記)
選択地域・カテゴリの世界遺産の数を表示させる機能を追加した。以下コードは追加後のもの。(実行結果のGIFは以前のまま。)
# Run this app with `python app.py` and
# visit http://127.0.0.1:8050/ in your web browser.

import dash
import dash_html_components as html
import dash_core_components as dcc
from dash.dependencies import Input, Output
import numpy as np
import plotly.express as px
import pandas as pd

whc = pd.read_csv(
    "c:/Users/t_honda/Desktop/Dash/data/whc-sites-2019.csv")
r = whc['region_en'].unique()
regions = np.append('All over the world', r)
categories = whc['category'].unique()


external_stylesheets = ['https://codepen.io/chriddyp/pen/bWLwgP.css']

app = dash.Dash(__name__, external_stylesheets=external_stylesheets)

app.layout = html.Div([
    html.H2(children='World Hesitate Cite (2019)'),

    html.Label('Region Select'),
    dcc.Dropdown(id='region',
                 options=[{'label': i, 'value': i} for i in regions],
                 value='All over the world'),

    html.Label('Category'),
    dcc.Checklist(id='category',
                  options=[{'label': i, 'value': i} for i in categories],
                  value=['Cultural', 'Natural', 'Mixed']),

    html.Label('Number of World Heritage Cites'),
    html.Div(id='whc-number'),

    dcc.Graph(id='whc-map')
])


@app.callback(
    Output('whc-map', 'figure'),
    Output('whc-number', 'children'),
    Input('region', 'value'),
    Input('category', 'value'))
def update_map(region, category):
    if region == 'All over the world':
        whc_r = whc
    else:
        whc_r = whc[whc['region_en'] == region]

    whc_rc = whc_r[whc_r['category'].isin(category)]

    fig = px.scatter_mapbox(whc_rc, lat="latitude", lon="longitude", hover_name="name_en", hover_data=["date_inscribed", "states_name_en", "region_en", "category"],
                            color_discrete_sequence=["fuchsia"], zoom=3, height=300)
    fig.update_layout(mapbox_style="open-street-map")
    fig.update_layout(margin={"r": 0, "t": 0, "l": 0, "b": 0})
    return fig, len(whc_rc)


if __name__ == '__main__':
    app.run_server(debug=True)
コールバック関数にて、選択した項目をもとに地図を更新するようにしている。実行結果は以下のようになる。

想定したとおりに実行できている。カテゴリをなにも選択しない場合に地図自体が表示されなくなるなどの修正点はあるが、今回は一旦ここまでとしておく。地域を複数選択できるようにしたり、選択地域の世界遺産の数をカテゴリごとで表示させる機能を追加してもおもしろいかもしれない。