はじめに
React-Leafletでマップを表示で地図を表示させ、マーカーを置いた。この記事では、OpenWeatherMap の API である Weather maps 1.0 を用いて、気象データを地図に重ね合わせる。React Leaflet、Weather maps 1.0 を参考にした。また leaflet や react-leaflet はインストール済みという前提で進める。インストールをしていない場合はReact-Leafletでマップを表示を参照。
API キーの取得
OpenWeatherMap の API から気象海象データを取得するには、API キーを取得する必要がある。Create New Account にてアカウントを作成すればキーを取得できる。いくつか制限はあるが、無料版で十分すぎる機能が使える。
コンポーネントの作成
地図を表示させ、さらに気象データを重ねるコンポーネントのコードを以下に示す。このコンポーネントでは現在の雲、降水量、海面気圧、風速、気温の5つの気象データを重ねることができる。
import React from "react";
import "leaflet/dist/leaflet.css";
import { LayersControl, MapContainer, TileLayer, WMSTileLayer } from "react-leaflet";
const APIKey = "取得した API キーを書く";
const SimpleLeaflet = () => {
const position = [35.685175, 139.7528];
return (
<div>
<MapContainer center={position} zoom={13} style={{ height: "100vh" }} >
<TileLayer
attribution='&copy <a href="http://osm.org/copyright";>OpenStreetMap</a> contributors'
url="https://{s}.tile.openstreetmap.org/{z}/{x}/{y}.png"
/>
<LayersControl position="topright" >
<LayersControl.Overlay name="Cloud" checked>
<WMSTileLayer url={`https://tile.openweathermap.org/map/clouds_new/{z}/{x}/{y}.png?appid=${APIKey}`} />
</LayersControl.Overlay>
<LayersControl.Overlay name="Precipitation">
<WMSTileLayer url={`https://tile.openweathermap.org/map/precipitation_new/{z}/{x}/{y}.png?appid=${APIKey}`} />
</LayersControl.Overlay>
<LayersControl.Overlay name="Sea Level Pressure">
<WMSTileLayer url={`https://tile.openweathermap.org/map/pressure_new/{z}/{x}/{y}.png?appid=${APIKey}`} />
</LayersControl.Overlay>
<LayersControl.Overlay name="Wind Speed">
<WMSTileLayer url={`https://tile.openweathermap.org/map/wind_new/{z}/{x}/{y}.png?appid=${APIKey}`} />
</LayersControl.Overlay>
<LayersControl.Overlay name="Temperature">
<WMSTileLayer url={`https://tile.openweathermap.org/map/temp_new/{z}/{x}/{y}.png?appid=${APIKey}`} />
</LayersControl.Overlay>
</LayersControl>
</MapContainer>
</div>
)
}
export default SimpleLeaflet;
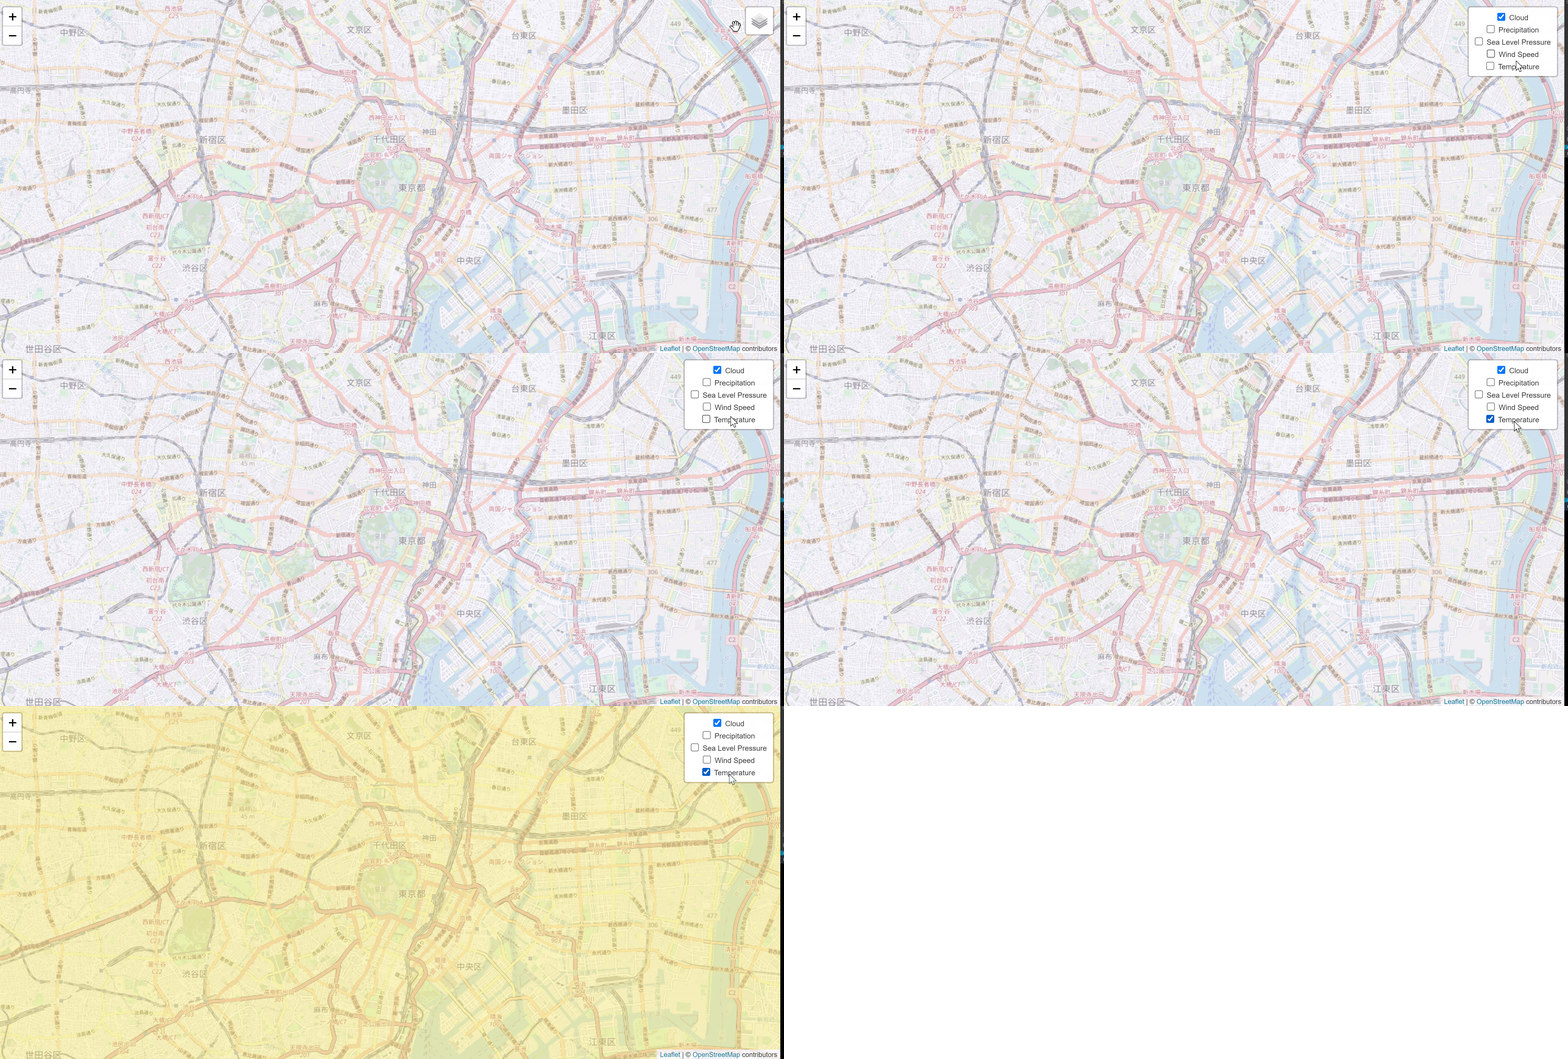
上記コンポーネントを読み込んで、開発用サーバーで実行した結果を以下に示す。
LayersControl を使用することで、上記 GIF のようにどの Layer を重ねるか選択できるようにしている。また LayersControl.Overlay タグ内に 'checked' と追記することで、デフォルトで選択状態にできる。 Layers control | React Leaflet に Layer のグループ分けなど細かい編集の例なども載っている。
おわりに
今回は Weather maps 1.0 を試してみた。現在は Weather maps 2.0 がローンチしており、そこでは予報データや過去のデータも取得できるとのことだったが、試したところ結果がうまく反映されなかったので、うまく扱える人がいたら教えて下さい。
(2021/5/7 追記)
直接 OpenWeatherMap に問い合わせたところ、無料版では対応していないとのこと。Detailed price - OpenWeatherMap にたしかにそう書いてある。試せなくて残念。
