はじめに
実務でVBAのグラフ出力を使う必要が出てきたため、サンプルコードを残します。
出力されるグラフ
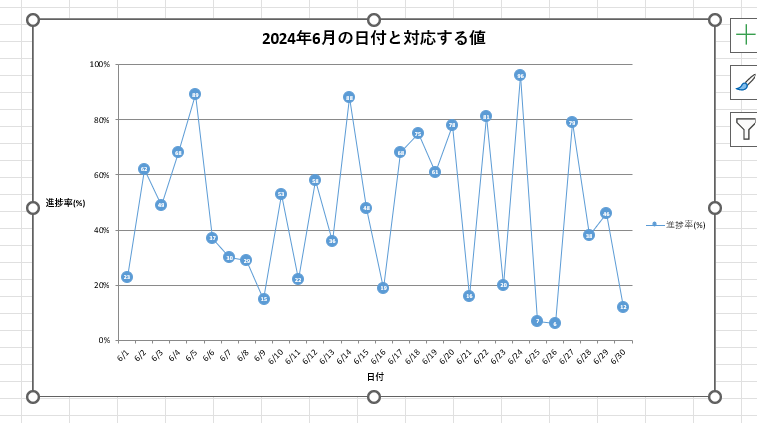
サンプルコードを出力されるグラフは下記です。
サンプルコード
コードを貼り付けて実行すれば、Sheet1にグラフが出力されます。良かったら試してみてください。
Sub CreateChartWithDateAxis()
    Dim ws As Worksheet
    Dim currentDate As Date
    Dim endDay As Integer
    Dim DateValues() As String
    Dim CompValues() As Double
    Dim chartObj As chartObject
    Dim chart As chart
    Dim rng As Range
    Dim i As Integer
    Dim settingsMonth As Integer
    Dim settingsYear As Integer

    ' 年月の設定
    settingsYear = 2024
    settingsMonth = 6

    ' 作業シートを設定
    Set ws = ThisWorkbook.Sheets("Sheet1")

    ' シートデータクリア
    ws.Cells.ClearContents

    ' データ作成
    For i = 1 To 32
        currentDate = DateSerial(settingsYear, settingsMonth, i)

        If month(currentDate) = settingsMonth Then
            ' A-1 コード上で値を設定したい場合のデータ取得
'            ReDim Preserve DateValues(1 To i)
'            ReDim Preserve CompValues(1 To i)
'            DateValues(i) = Format(currentDate, "m/d")
'            CompValues(i) = WorksheetFunction.Round(Rnd, 2)

            ' B-1 シートの表をデータソースに設定する場合のデータ取得
            ws.Range("A" & i).value = currentDate
            ws.Range("B" & i).value = WorksheetFunction.Round(Rnd, 2)
        Else
            ' B-1 シートの表をデータソースに設定する場合のデータ取得
            endDay = i - 1
            Exit For
        End If
    Next i

    ' 空のグラフを作成
    Set chartObj = ws.ChartObjects.Add(Left:=100, Width:=700, Top:=50, Height:=400)
    Set chart = chartObj.chart

    ' データの設定
    With chart
        ' 折れ線グラフを指定
        .ChartType = xlLineMarkers ' グラフの種類を折れ線(マーカー付き)に設定

        ' A-2 コード上で値を設定したい場合の設定
'        .SeriesCollection.NewSeries
'        .SeriesCollection(1).xValues = DateValues
'        .SeriesCollection(1).Values = CompValues

        ' B-2 シートの表をデータソースに設定する場合の設定
        Set rng = ws.Range("A1:B" & endDay)
        .SetSourceData Source:=rng

        ' グラフにタイトルを設定
        .HasTitle = True
        .chartTitle.Text = settingsYear & "年" & settingsMonth & "月の日付と対応する値"
    End With

    ' X軸を日付形式に設定
    With chart.Axes(xlCategory)
        .CategoryType = xlTimeScale
        .MajorUnit = 1
        .TickLabels.NumberFormat = "m/d"
        .TickLabels.Orientation = 45 ' ラベルの向きを横向きに設定
        .HasTitle = True
        .AxisTitle.Text = "日付" ' Y軸のタイトルを設定
    End With

    ' Y軸の設定
    With chart.Axes(xlValue)
        .MinimumScale = 0 ' Y軸の最小値を設定
        .MaximumScale = 1 ' Y軸の最大値を設定
        .MajorUnit = 0.2 ' 主要な目盛り単位を設定
        .TickLabels.NumberFormat = "0%" ' Y軸のメモリラベルにパーセント記号を付ける
        .HasTitle = True
        .AxisTitle.Text = "進捗率(%)" ' Y軸のタイトルを設定
        .AxisTitle.Orientation = xlHorizontal ' Y軸のタイトルを横書きに設定
    End With

    ' 系列にマーカーを追加
    With chart.SeriesCollection(1)
        .MarkerStyle = xlMarkerStyleCircle ' マーカーのスタイルを円に設定
        .MarkerSize = 13 ' マーカーのサイズを設定
        .Name = "進捗率(%)" ' 系列のタイトルを設定

        ' データラベルを表示
        .HasDataLabels = True
        With .DataLabels
            .ShowValue = True ' データラベルに値を表示
            .Position = xlLabelPositionCenter ' データラベルの位置をマーカーの中心に設定
            .Font.Size = 7
            .Font.Color = RGB(255, 255, 255) ' 文字色を白に設定
            .Font.Bold = True ' 文字を太字に設定
        End With

        ' データラベルの値を *100 して百分率を表示
        Dim p As Point
        For Each p In .Points
            p.DataLabel.Text = Format(p.DataLabel.Text * 100, "0")
        Next p
    End With

    ' レジェンドを下に表示する
'    chart.Legend.Position = xlLegendPositionBottom
End Sub
セル参照せずにグラフ出力
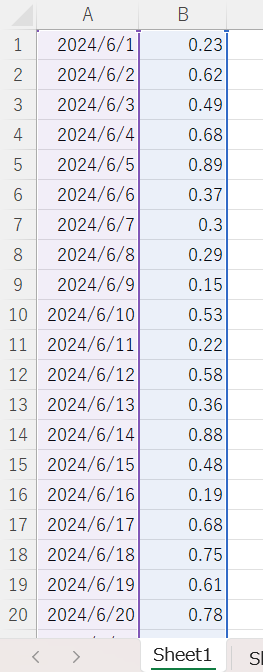
上記のコードをそのまま実行すると、下記のように日付と進捗率を表すデータが表形式で出力され、その出力データを参照し、グラフが作成されます。
もし、直接コード上で値を設定したいという場合は、A-1、A-2の下のコードのコメントアウト解除して、B-1、B-2のデータ取得と設定の所をコメントアウトしてみてください。上記のような出力がなくなり、A-1の所で作成した配列の値をA-2でグラフに渡すことにより、データ出力を行わずにデータを作成することができるはずなので試してみてください。

