gnuplot コマンド
ticsの向きと位置を整える
set xtics rotate by 90 right
set xtics center offset 0,0.5
フォントの設定
set term pngcairo transparent truecolor font "Times New Roman,25" size 1200,1000
データプロットの方法を一括で指定
set style data dot
プロットの種類(キーワード)
- 直線
line - ドット
dot - ポイント
points
コメント行の指定
set datafile commentschars "@|#"
セパレータの指定
set datafile separator ","
または
set datafile separator comma
軸目盛間隔の設定
- x軸→xtics
- y軸→ytics
- z軸→ztics
set xtics 1
paletteの色指定
set palette defined (0"midnight-blue",1"blue",5"cyan",9"orange",13"red",14 "white")
色は名前ではなくて,color codeでも指定できる。
カラーコード
https://www.computerhope.com/htmcolor.htm
https://www.w3schools.com/colors/colors_picker.asp
https://www.rapidtables.com/web/color/html-color-codes.html
スクリプト内に,任意のデータを作成してプロット
$map1 << EOD
5 4 3 1 0
2 2 0 0 1
0 0 0 1 0
0 0 0 2 3
0 1 2 4 3
EOD

plot '$map3' matrix rowheaders columnheaders using 1:2:3 with image
プロットするデータをプロット時に演算する
using 1:($2*100)
plot "out_do4_matrix.dat" matrix using 1:2:3 with image, \
     "out_do4_matrix.dat" matrix using 1:2:($3 == 0 ? "" : sprintf("%g",$3) ) with labels
Linuxのコマンドを実行する
!ls
数式をプロットする
set xrange [-10:10]
plot x*x
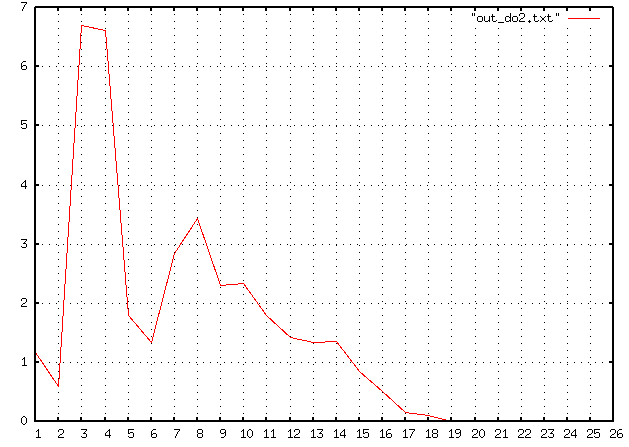
グリッド線を描く
set grid
(ex)
set grid
set xtics 1
p "out_do2.txt" w l
out_do2.txt
1 1.16795
2 0.60632
3 6.7047
4 6.62016
5 1.79147
6 1.34219
7 2.84085
8 3.44192
9 2.30184
10 2.34568
11 1.79934
12 1.4279
13 1.34699
14 1.36219
15 0.847737
16 0.512655
17 0.156619
18 0.112709
19 0.00968867
20 0.00533321
21 0.010222
22 0.0148886
23 0.0161108
24 0.000555543
25 0.0012222
26 0.000111109