Stable Diffusion などの画像生成モデルやそれらに基づくサービスが流行し始めて久しくなりました🤖
が...お恥ずかしいことに私はフワッとしか拡散モデル(スコアモデルやデノイジング拡散確率モデル)について理解できてなかったので、改めて PFN岡野原さんの著書「拡散モデル データ生成技術の数理」を読みながら理解した(気になっている)内容を忘備録もかねて Python のサンプルコードとともに本記事にまとめます。
ただ、単にサンプルコードを載せるだけでは面白くありませんので、よくある拡散モデルの解説記事やチュートリアルで使われている Pytorch などのニューラルネットワークをあえて使わずに拡散モデルに基づく生成モデルを構築してみたいと思います。
本書ではニューラルネットワーク以外のモデルとして LightGBM および CatBoost のツリーベースモデルを採用しますが、各種目的関数の最適化問題の変換や確率微分方程式等の数値計算のために必要な条件を満たしているかどうかは特段確認しておりません(かなり怪しい気がします)。本書では楽観的にこれらのモデルを採用していることをご了承ください。
なお、本書で実装したコードについては簡単なライブラリとして
に公開しておりますのでご参考にしていただけますと幸いです。
はじめに
本書の目的
- サンプルコードともにスコアベースモデルの理解を深める
- 拡散モデルで一般的に使用されるニューラルネットワークをあえて使わず
本書の対象読者
- 拡散モデルについて勉強中の人
- PFN岡野原さんの著書「拡散モデル データ生成技術の数理」の第2章くらいまで読んでいる前提
本書の内容
本書で扱う内容・本書で触れる内容
- スコアマッチング・デノイジングスコアマッチング
- ランジュバン・モンテカルロ法を用いたサンプリング
- 逆拡散過程を用いたデータ生成
- 確率フローODEを用いたデータ生成
本書で扱わない内容
- 画像生成モデル
- デノイジング拡散確率モデル
本書の実行環境
-
Window 11
-
python 3.10.11
-
主要なライブラリ
- numpy==1.26.4
- pandas==2.2.3
- sympy==1.13.3
- scikit-learn==1.5.2
- catboost==1.2.5
- lightgbm==4.5.0
- matplotlib==3.9.2
requirements.txt
catboost==1.2.5
contourpy==1.3.0
cycler==0.12.1
fonttools==4.54.1
graphviz==0.20.3
joblib==1.4.2
kiwisolver==1.4.7
lightgbm==4.5.0
matplotlib==3.9.2
mpmath==1.3.0
numpy==1.26.4
packaging==24.1
pandas==2.2.3
pillow==11.0.0
plotly==5.24.1
pyparsing==3.2.0
python-dateutil==2.9.0.post0
pytz==2024.2
scikit-learn==1.5.2
scipy==1.14.1
six==1.16.0
sympy==1.13.3
tenacity==9.0.0
threadpoolctl==3.5.0
tqdm==4.66.6
tzdata==2024.2
本記事で提供されているコードは、特定の環境や条件下での動作を示すものであり、全ての環境やケースで同様に機能するとは限りません。また、時間の経過とともにソフトウェアの更新や互換性の問題が生じる可能性があるため、掲載されているコードが最新の状態であるとは限りません。本コードの使用は、読者の責任において行ってください。実行する前に、コードをよく理解し、必要に応じて環境に適合させることを推奨します。また、可能な限りバックアップを取ることを忘れないでください。本記事の内容やコードに関する質問や改善提案があれば、コメント欄やソーシャルメディアを通じてお知らせください。
from typing import Callable

from catboost import CatBoostRegressor
from lightgbm import LGBMRegressor
from matplotlib.gridspec import GridSpec
import matplotlib.pyplot as plt
import numpy as np
from sklearn.preprocessing import minmax_scale
import sympy
from tqdm import trange
np.random.seed(42)
拡散モデルとは
拡散モデルは生成モデルの1つです。
生成モデルは対象とするデータを生成することができるモデルで、
未知の確率分布(確率密度関数) $p(x)$ から独立に生成された $N$ 個の訓練データ $\{x_n\}_{n=1}^N$ が与えられた状況下でデータの生成過程を推定するという問題設定のもとで使用されます。
生成モデルの拡散モデル以外の例としては
- Variational Autoencoder (VAE)
- Generative Adversarial Network (GAN)
などがあります。
※ 本書では $x \in \mathbb{R}^d$ かつ 確率密度関数が存在するケースのみ考えることとします
確率分布のモデリング
確率分布のモデリング方法にはさまざまな方法がありますが、
ここではパラメータ$\theta \in \mathbb{R}^k$を持つ生成モデル $q_\theta(x)$ を考えてみましょう
ここで $q_\theta(x)$ は確率密度関数であり、
- $q_\theta(x) \geq 0$
- $\int q_\theta(x)dx = 1$
を満たすものとします。たとえば、
- $x \in \mathbb{R}$ として正規分布でモデル化する場合:$q_\theta(x) = \frac{1}{\sqrt{2\pi}\theta_1} \exp\left(-\frac{(x-\theta_0)^2}{2\theta_1^2}\right)$
- $x \in \mathbb{R}$ としてラプラス分布でモデル化する場合:$q_\theta(x) = 0.5\theta_1 \exp(-\theta_1|x-\theta_0|)$
などでモデリングするなどです。
特に $q_\theta$ を
$$
q_\theta(x) = \exp(-U_\theta(x)) / Z(\theta)
$$
- $U_\theta(x)$: 任意の実数値を取るエネルギー関数
- $Z(\theta) := \int \exp(-U_\theta(x))dx$: $x$ によらない規格化定数(分配関数)
の形でモデリングする場合はエネルギーベースモデルと呼ばれます。
このようにしてモデリングされた $q_\theta$ は以下の最尤推定などにより推定することができます。
$$
\theta^* := \arg\max_\theta \sum_{n=1}^N \log q_\theta(x_i)
$$
ランジュバン・モンテカルロ法によるサンプリング
上記の確率モデル $q_\theta$ や $\exp(-U_\theta(x))$ からデータを生成する(分配関数に関わる計算を避けた比較的効率的な)方法としてはマルコフ連鎖モンテカルロ法(MCMC)などがありますが、実は多様体仮説(現実のデータは高次元に分布していても実質的に低次元の多様体上に分布しているとする仮説)のもとでは尤度の高い領域に効率的に到達することが難しいという問題があります。
ところで先のエネルギーベースモデルの $U_\theta(x)$ を用いてランジュバン拡散
$$
dx = -\nabla_x U_\theta(x)dt + \sqrt{2}dW_t
$$
- $W_t$: 標準ウィーナー過程
を考えることができ、これを離散化したランジュバン・モンテカルロ法
$$
x_{k+1} = x_k - \nabla_x U_\theta(x_k)\Delta t + \sqrt{2\Delta t}\Delta W_k
$$
- $\Delta W_k$: $\Delta W_k \sim N(0,I_d)$ ($I_d$ は $d$ 次の単位行列)
を使うと尤度の高い領域に効率的に探すことができるようになります。
特にこの $- \nabla_x U_\theta(x)$ のことをスコア関数と呼びます。
ここでは $n$ 番煎じではありますが、このランジュバン・モンテカルロ法を実装してみましょう。
def langevin_montecarlo(
    x0: np.ndarray,
    nabla_U: Callable[[np.ndarray], np.ndarray],
    delta_t: float = 0.1,
    n_steps: int = 1000,
) -> np.ndarray:
    """Generate samples from the Langevin Monte Carlo algorithm.

    Args:
        x0 (np.ndarray): initial position of the chain.
        nabla_U (Callable[[np.ndarray], np.ndarray]): gradient of the potential energy function.
        delta_t (float, optional): time step. Defaults to 0.1.
        n_steps (int, optional): number of steps. Defaults to 1000.

    Returns:
        np.ndarray: samples from the Langevin Monte Carlo algorithm.
            (n_steps, *x0.shape) shape array.

    NOTE:
        the shape of an output of nabla_U must be the same as x0.
    """  # noqa
    xs = np.zeros((n_steps,)+x0.shape)
    xs[0] = x0
    for k in trange(1, n_steps):
        xs[k] = xs[k-1]
        xs[k] += - nabla_U(xs[k-1]) * delta_t
        xs[k] += np.random.randn(*x0.shape) * np.sqrt(2*delta_t)
    return xs
混合ガウス分布の例
では、上記で実装したランジュバン・モンテカルロ法を使用して、混合ガウス分布
$$
p(x) = 0.5 \mathcal{N}(x|1.6,1) + 0.5 \mathcal{N}(x|-1.6,1)
$$
からサンプリングしてみましょう
まずはエネルギー関数の勾配。面倒なので sympy を使って求めます😅
# Mixed normal distribution
_x = sympy.symbols('x')
_p = 0.5 * sympy.exp(-0.5*(_x-1.6)**2) + 0.5 * sympy.exp(-0.5*(_x+1.6)**2)
_u = - sympy.log(_p)
_du = _u.diff(_x)

du_mixed_normal = sympy.lambdify((_x), _du)
pdf_mixed_normal = sympy.lambdify(_x, _p)

print('p.d.f.:', _p)
print('energy func.:', _u.simplify())
print('score func.:', - _du.simplify())
p.d.f.: 0.5*exp(-1.28*(0.625*x + 1)**2) + 0.5*exp(-1.28*(0.625*x - 1)**2)
energy func.: 1.97314718055995 - log((exp(3.2*x) + 1)*exp(-x*(0.5*x + 1.6)))
score func.: -1.0*(1.0*x*exp(3.2*x) + 1.0*x - 1.6*exp(3.2*x) + 1.6)/(exp(3.2*x) + 1)
続いて上記のエネルギー関数の勾配を用いてランジュバン・モンテカルロ法を実行します
とりあえず、50000 点ほど生成してみましょう
sampled_mixed_norm = langevin_montecarlo(x0=np.array([0.0]), nabla_U=du_mixed_normal, n_steps=50000, delta_t=0.05)
sampled_mixed_norm.shape
100%|██████████| 49999/49999 [00:01<00:00, 26497.74it/s]

(50000, 1)
では、生成されたデータを見てみましょう!
まずは生成されたデータのヒストグラムから👀
def plot_hist_with_true_pdf(samples, ax=None, true_pdf=None, label=None, bins=None, histtype='bar'):
    if ax is None:
        _, ax = plt.subplots()
    ax.hist(samples, bins=bins or 100, density=True, alpha=0.5, label=label or 'samples', histtype=histtype)
    ax.legend(loc='upper left')
    x = np.linspace(samples.min(), samples.max(), 1000)
    if true_pdf is not None:
        axd = ax.twinx()
        axd.plot(x, true_pdf(x), label='true pdf', color='r')
        axd.set_ylim(0)
        axd.legend(loc='upper right')
    ax.set_xlabel('x')

plt.figure(figsize=(10, 5))
plot_hist_with_true_pdf(sampled_mixed_norm, ax=None, true_pdf=pdf_mixed_normal)
plt.show()
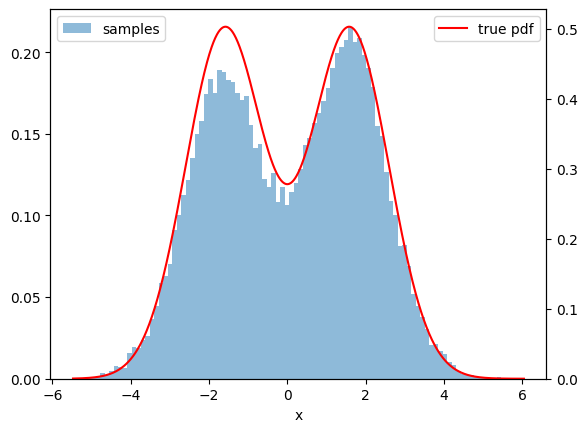
ヒストグラムの概形からおそらくサンプリングできていそうですね〇
続いてランジュバン・モンテカルロ法によりサンプルされたパスも確認。
def plot_samples_with_online_mean_and_variance(samples, true_mean=None, true_var=None, ax=None):
    if ax is None:
        _, ax = plt.subplots()
    means = np.cumsum(samples) / np.arange(1, len(samples)+1)
    vars = np.cumsum(samples**2) / np.arange(1, len(samples)+1) - means**2
    ax.plot(samples, label='samples', color='k', lw=0.5)
    ax.plot(means, label='mean', color='r')
    ax.plot(vars, label='variance', color='b')
    if true_mean is not None:
        ax.axhline(true_mean, color='r', linestyle='--', label='true mean')
    if true_var is not None:
        ax.axhline(true_var, color='b', linestyle='--', label='true variance')
    ax.set_xlabel('steps')
    ax.legend()

plt.figure(figsize=(10, 5))
plot_samples_with_online_mean_and_variance(sampled_mixed_norm, true_mean=0.0, true_var=1.0 + 0.25*3.2*3.2)
plt.show()
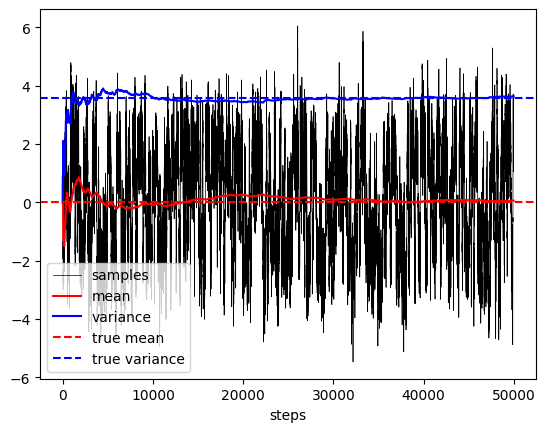
1.6 と -1.6 の間を行ったり来たりしている様子が確認でき、サンプル平均・サンプル分散が理論値に近くなっていく様子を確認できました。
さて、上記の武器でスコア関数(エネルギー関数の勾配)があれば、ランジュバン・モンテカルロ法によりデータを生成することができるようになりました。
次節ではどのようにスコア関数を推定するかについて考えていきます。
スコアベースモデルによるデータ分布の学習
スコアマッチング
さて、前節までの内容で確率分布のモデルに対するスコア関数
$$
s_\theta(x) := \nabla_x \log q_\theta(x) = -\nabla_x U_\theta(x)
$$
がわかれば、ランジュバン・モンテカルロ法を用いてデータを生成できることがわかりました。この節では、スコア関数 $s_\theta(x)$ をどのように推定すればよいのかを見ていきましょう。
まず、スコア関数の推定のナイーブな問題設定として下記の 明示的スコアマッチング の最小化問題があります。
$$
J_{ESM_p}(\theta) = \frac{1}{2}\mathbb{E}_{p(x)}\left[|\nabla_x \log p(x) - s_\theta(x) |^2 \right]
$$
ここで $p(x)$ は未知の分布、$s_\theta(x)$ は確率モデルにおけるスコア関数です。
これを最小化することができれば $s_\theta(x)$ をスコア関数とする確率分布は $p(x)$ に近くなることが期待できます。
しかしながら、$p(x)$ は未知の分布であるため、上記の期待値を計算(近似)することができません。そこで下記の 暗黙的スコアマッチング の最小化問題を考えます。
$$
J_{ISM_p}(\theta) = \mathbb{E}_{p(x)}\left[\frac{1}{2}|s_\theta(x)|^2 + tr(\nabla_x s_\theta(x))\right]
$$
ただし、実際には有限個の学習データ $\{x_n\}_{n=1}^N$ が与えられた状況下での最小化問題となるので経験分布を用いて
$$
J_{ISM_{p_{emp}}}(\theta) = \frac{1}{N} \sum_{n=1}^N \left[\frac{1}{2}|s_\theta(x_n)|^2 + tr(\nabla_x s_\theta(x_n))\right]
$$
の最小化問題を解きます。
そしてこの目的関数における右辺は未知の分布 $p(x)$ を含まず $s_\theta(x)$ のみに依存するので計算(最適化)が可能であるにもかかわらず、実は適当な仮定の下で $J_{ESM_p}(\theta)$ と $J_{ISM_p}(\theta)$ の差は $\theta$ に依存しない定数となることを示すことができる(See 1)ため、$J_{ISM_{p_{emp}}}(\theta)$ を最小化することで $J_{ESM_p}(\theta)$ を近似的に最小化することができるということがわかります。
デノイジングスコアマッチング
スコアマッチングで未知の真の分布のスコア関数を推定できることが分かりましたが、実は 暗黙的スコアマッチング の最小化による $\theta$ の推定にはまだ2つの問題があります:
- $tr(\nabla_x s_\theta(x_n))$ の計算量が大きいこと
- 過学習が起こりやすいこと
この問題を解決するための方法の 1 つとして デノイジングスコアマッチング があります。
デノイジングスコアマッチングでは学習データにノイズ(摂動)を付与します。
$$
\tilde{x} = x + \epsilon, \quad \epsilon \sim \mathcal{N}(0, \sigma^2I_d)
$$
i.e.
$$
p_\sigma(\tilde{x}|x) = \mathcal{N}(\tilde{x}|x, \sigma^2I_d)
$$
このとき、デノイジングスコアマッチング
$$
\begin{matrix}
J_{DSM_{p_\sigma}}(\theta) &=& \frac{1}{2}\mathbb{E}_{(\tilde{x}, x) \sim p_\sigma(\tilde{x}|x)p(x)}\left[|\nabla_x \log p_\sigma(\tilde{x}|x) - s_\theta(\tilde{x}, \sigma)|^2\right] \\
&=& \frac{1}{2}\mathbb{E}_{(\tilde{x}, x) \sim p_\sigma(\tilde{x}|x)p(x)}\left[|- \frac{\tilde{x}-x}{\sigma^2} - s_\theta(\tilde{x}, \sigma)|^2\right] \\
&=& \frac{1}{2}\mathbb{E}_{\epsilon\sim\mathcal{N}(0, \sigma^2I_d),x \sim p(x)}\left[|- \frac{\epsilon}{\sigma^2} - s_\theta(x+\epsilon, \sigma)|^2\right] \\
\end{matrix}
$$
を最小化する問題解くことと、驚くべきことに摂動後分布 $p_\sigma(\tilde{x})$ のスコア関数を推定する問題が一致することを示すことができます(See 1)。
特に $J_{DSM_{p_\sigma}}(\theta)$ の最小化が人工的に生成されたノイズの負の値を教師データとする最小二乗法であるとみなせることから、本節の残りでは
- LightGBM
- CatBoost
を用いてスコア関数を推定し、データ生成を行うことにトライしてみます!
拡散モデルのよくあるサンプルコードやチュートリアルではここから Pytorch などを使うような気がします😅(個人的な感覚)
※ 上記の中の随所で明示的スコアマッチングが暗黙的スコアマッチングやデノイジングスコアマッチングと定数差を除いて一致することを記述してきましたが、その証明にいくつかの過程が必要となります。また、推定したスコア関数を用いたランジュバン・モンテカルロ法によるデータ生成がうまくいくための条件もあります。今回用いる LightGBM や CatBoost がこれらの前提条件をすべて満たしているかどうかについては甚だ疑問ではありますが楽観的に LightGBM ・ CatBoost を採用していることにご留意ください。
混合ガウス分布の例
$p(x) = 0.5 \mathcal{N}(x|1.6,1) + 0.5 \mathcal{N}(x|-1.6,1)$ に対してデノイジングスコアマッチングを試してみましょう。
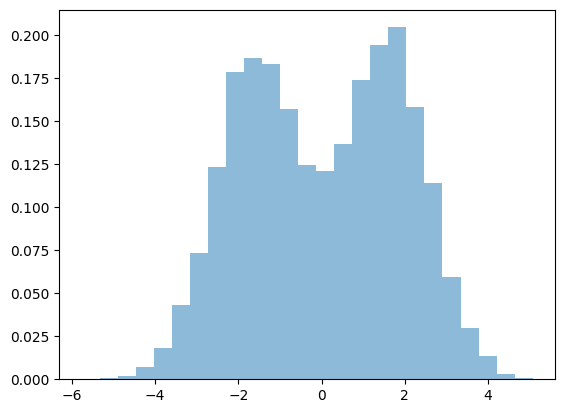
まずは学習データを10000点ほど生成しておきます。こんな感じ。
X_mixed_gaussian = np.random.randn(10000)
X_mixed_gaussian += (2*(np.random.rand(len(X_mixed_gaussian)) > 0.5) -1) * 1.6
X_mixed_gaussian_min, X_mixed_gaussian_max = X_mixed_gaussian.min(), X_mixed_gaussian.max()
plt.hist(X_mixed_gaussian, bins=25, density=True, alpha=0.5, label='training')
plt.show()
続いて、学習データを整形してスコア関数のモデルへの入力と教師データを作成します。
つまり、$s_\theta(x+\epsilon, \sigma)$ の引数と教師データ $-\frac{\epsilon}{\sigma^2}$ の作成ですね。
ただ、上では書いていませんでしたが、様々なノイズ強度 $\sigma$ に対してスコア関数を学習する必要があり、各ノイズ強度での目的関数のスケールを合わせるために各ノイズ強度 $\sigma$ のデータに対しては $\sigma^2$ の重みを付けることとします
(詳細は 1 および 2 をご参照ください)
from contextlib import contextmanager
from typing import Iterable, Generator


@contextmanager
def np_seed(
    seed: int | None = None
) -> Generator[None, None, None]:
    """context manager for setting numpy random seed temporarily.

    Args:
        seed (int | None, optional): random seed. Defaults to None.

    Yields:
        None
    """

    if seed is None:
        # do nothing
        yield
    else:
        rng_state = np.random.get_state()
        np.random.seed(seed)
        try:
            yield
        finally:
            np.random.set_state(rng_state)


def create_noised_data(
    X: np.ndarray,
    sigmas: Iterable[float],
    conditions: np.ndarray | None = None,
    seed: int | None = None,
) -> tuple[np.ndarray, np.ndarray, np.ndarray]:
    """Create noised data.

    Args:
        X (np.ndarray): features. Shape: (N,) or (N, D).
        sigmas (Iterable[float]): noise strengths.
        conditions (np.ndarray | None, optional): conditions. Defaults to None.
            If conditions is not None, shape of conditions must be (N, M).
        seed (int | None, optional): random seed. Defaults to None.

    Returns:
        tuple[np.ndarray, np.ndarray, np.ndarray]: noised features, noised targets, and weights.
            noised features:
                (N, D+2) shape array if X shape is (N, D)
                (N, 3) shape array if X shape is (N,)
            noised targets:
                (N,) shape array if X shape is (N,)
                (N, D) shape array if X shape is (N, D)
            weights: (N,) shape array.

    NOTE:
        weights are the square of noise strengths.
    """  # noqa

    with np_seed(seed):
        X = X if X.ndim > 1 else X.reshape(-1, 1)
        sigmas = sorted(sigmas)
        X_, y_, w_ = [], [], []

        for sigma in sigmas:
            # generate noise
            noise = np.random.randn(*X.shape) * sigma
            # define the alternative target
            y_.append(-noise/sigma**2)
            # define the features
            if conditions is not None:
                X_.append(np.hstack([
                    conditions.reshape(X.shape[0], -1),
                    X + noise,
                    np.array([[sigma]]*len(X)),
                ]))
            else:
                X_.append(np.hstack([
                    X + noise,
                    np.array([[sigma]]*len(X))
                ]))
            # define the weights
            w_.append(np.array([sigma**2]*len(X)))

        return np.vstack(X_), np.vstack(y_), np.vstack(w_)
さて上記の関数を使って作成されたノイズ付きのデータとその分布を見てみましょう👀
# 真の確率密度関数と真のスコア関数
_x = sympy.symbols('x')
_p = 0.5 * sympy.exp(-0.5*(_x-1.6)**2) + 0.5 * sympy.exp(-0.5*(_x+1.6)**2)
_u = - sympy.log(_p)
_du = _u.diff(_x)

true_score_mixed_normal = sympy.lambdify((_x), - _du)
true_pdf_mixed_normal = sympy.lambdify(_x, _p)
X_mixed_gaussian_noised, y_mixed_gaussian_noised, w_mixed_gausian_noised = create_noised_data(X_mixed_gaussian, np.sqrt(np.linspace(0, 10, 101)[1:]), seed=42)

img = plt.scatter(
    X_mixed_gaussian_noised[::10, 0],
    y_mixed_gaussian_noised[::10, 0],
    c=minmax_scale(X_mixed_gaussian_noised[::10, [1]]).flatten(),
    alpha=0.2, s=5, label='noised data', cmap='inferno',
)
plt.plot(np.linspace(-7, 7, 100), true_score_mixed_normal(np.linspace(-7, 7, 100)), label='true score function', color='b')
plt.colorbar(img, label='noise level').set_ticks([])
plt.xlabel('x+e')
plt.ylabel('-e/sigma^2')
plt.xlim(-10, 10)
plt.legend()
plt.show()
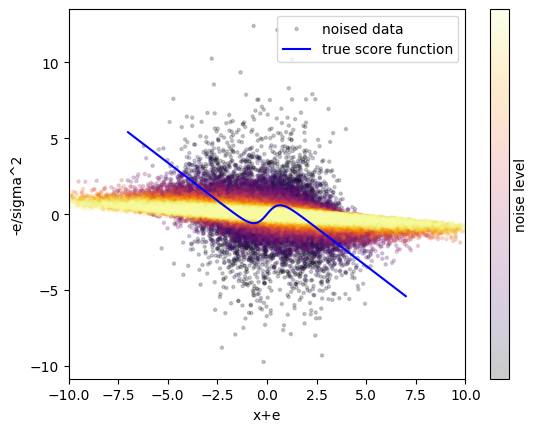
このようにノイズ強度が小さい(紫点)場合は、$x+\epsilon$ が -2.5 ~ 2.5 の範囲に収まりつつも、強いノイズ強度(黄点・赤点)よりも $-\epsilon/\sigma^2$ は広がっていることが分かります。
これは $\epsilon$ が標準偏差 $\sigma$ の正規分布に従うことから $\sigma$ オーダーであり、$-\epsilon/\sigma^2$ が $1/\sigma$ のオーダーであるため $\sigma$ が小さいときには $-\epsilon/\sigma^2$ も大きな値となりうることから理解できます。
他方で強いノイズ強度(黄点・赤点)は $x+\epsilon$ が幅広く広がっていく一方で直線的な関係になっていっていることがわかります。
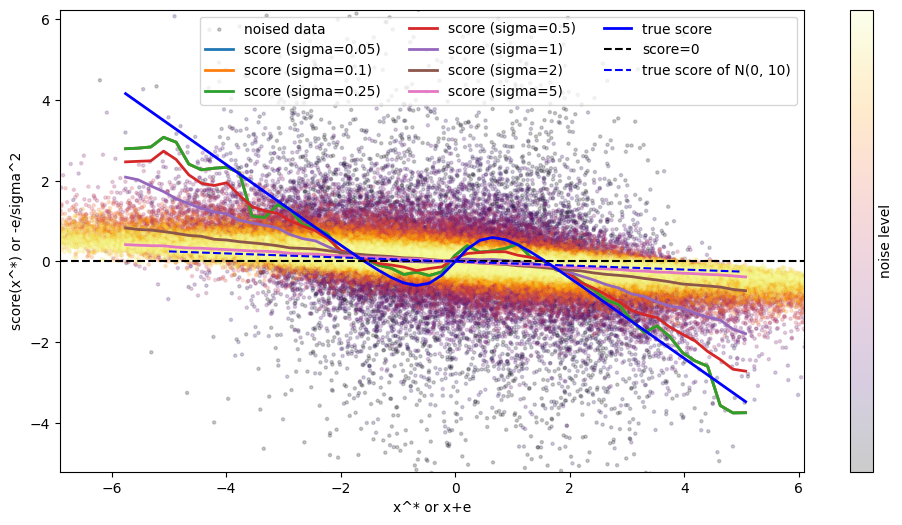
ところでパッと見てはこれらのデータを使ってスコア関数のモデル $s_\theta(x+\epsilon, \sigma)$ が 真のスコア関数に近いものを学習できるのでしょうか?上記の図に真のスコア関数(青線)を描いてみましたがぱっとはわかりせん。ということで、実際に LightGBM を使って学習してみましょう。
# LightGBM のインスタンスを作成
mixed_gausssian_score_model = LGBMRegressor(random_state=42)
# ノイズ付与されたデータ、ノイズの強度を特徴量、ノイズ強度でスケーリングした目的変数、ノイズ強度の二乗の重みを使って学習
mixed_gausssian_score_model.fit(X_mixed_gaussian_noised, y_mixed_gaussian_noised.flatten(), sample_weight=w_mixed_gausian_noised.flatten())
[LightGBM] [Info] Auto-choosing row-wise multi-threading, the overhead of testing was 0.002629 seconds.
You can set `force_row_wise=true` to remove the overhead.
And if memory is not enough, you can set `force_col_wise=true`.
[LightGBM] [Info] Total Bins 356
[LightGBM] [Info] Number of data points in the train set: 1000000, number of used features: 2
[LightGBM] [Info] Start training from score 0.000884
さてとりあえず学習はできました🆗
このモデルで真のスコア関数が推定できているかどうか見てみましょう。
plt.figure(figsize=(12, 6))
img = plt.scatter(
    X_mixed_gaussian_noised[::10, 0],
    y_mixed_gaussian_noised[::10, 0],
    c=minmax_scale(X_mixed_gaussian_noised[::10, [1]]).flatten(),
    alpha=0.2, s=5, label='noised data', cmap='inferno',
)
plt.colorbar(img, label='noise level').set_ticks([])
for sigma in [5e-2, 0.1, 0.25, 0.5, 1, 2, 5]:
    plt.plot(
        np.linspace(X_mixed_gaussian_min, X_mixed_gaussian_max),
        mixed_gausssian_score_model.predict(np.hstack([
            np.linspace(X_mixed_gaussian_min, X_mixed_gaussian_max).reshape(-1, 1),
            np.array([[sigma]]*50),
        ])),
        lw=2,
        label=f'score (sigma={sigma})',
    )
plt.plot(
    np.linspace(X_mixed_gaussian_min, X_mixed_gaussian_max),
    true_score_mixed_normal(np.linspace(X_mixed_gaussian_min, X_mixed_gaussian_max)),
    label='true score', color='b', linestyle='-', lw=2,
)
plt.ylim(
    min(true_score_mixed_normal(np.linspace(X_mixed_gaussian_min, X_mixed_gaussian_max)))*1.5,
    max(true_score_mixed_normal(np.linspace(X_mixed_gaussian_min, X_mixed_gaussian_max)))*1.5,
)
plt.axhline(0, color='k', linestyle='--', label='score=0')
plt.plot(np.linspace(-5, 5), -0.5*np.linspace(-5, 5)/10, color='b', linestyle='--', label='true score of N(0, 10)')
plt.xlabel('x^* or x+e')
plt.ylabel('score(x^*) or -e/sigma^2')
plt.legend(ncol=3)
plt.xlim(X_mixed_gaussian_min*1.2, X_mixed_gaussian_max*1.2)
plt.show()
さて、驚くことに $s_\theta(x^\epsilon, \sigma)$ が $\sigma$ が 0 に近づくにつれて真のスコア関数に近づいていく様子が確認できます!実際、$\sigma$ が大きい(桃線・茶線)場合と $\sigma$ が小さい(赤線・緑線)場合を比較すると、$\sigma$ が小さい場合の方が真のスコア関数(青線)に近いことがわかります。
特に真のスコア関数(青線)と $\sigma$ が小さい(赤線・緑線)の零点(エネルギー関数の極大点・極小点に相当)を比較するとグラフ上ではかなり近い位置にあることがわかり、いい感じのデータが生成されることが期待できそうです。
というわけで学習されたスコア関数を先に実装したランジュバン・モンテカルロ法に与えてデータを生成してみましょう!ここではノイズ強度を段階的に下げながらデータを生成してみます。
x0 = np.array([0.0])
for sigma in [10, 5, 2, 1, 0.5, 0.25, 0.1, 0.05, 0.01]:
    x0 = langevin_montecarlo(
        x0=x0,
        nabla_U=lambda x: - mixed_gausssian_score_model.predict(np.hstack([x.reshape(-1), np.array([sigma])]).reshape(1, -1)),
        n_steps=10000,
        delta_t=0.1,
    )[-1]

sampled_mixed_norm = langevin_montecarlo(
    x0=x0,
    nabla_U=lambda x: - mixed_gausssian_score_model.predict(np.hstack([x.reshape(-1), np.array([0.0])]).reshape(1, -1)),
    n_steps=10000,
    delta_t=0.1,
)
100%|██████████| 9999/9999 [00:05<00:00, 1682.40it/s]
100%|██████████| 9999/9999 [00:06<00:00, 1617.68it/s]
100%|██████████| 9999/9999 [00:05<00:00, 1690.22it/s]
100%|██████████| 9999/9999 [00:06<00:00, 1463.34it/s]
100%|██████████| 9999/9999 [00:06<00:00, 1459.98it/s]
100%|██████████| 9999/9999 [00:05<00:00, 1695.27it/s]
100%|██████████| 9999/9999 [00:07<00:00, 1409.23it/s]
100%|██████████| 9999/9999 [00:06<00:00, 1436.72it/s]
100%|██████████| 9999/9999 [00:06<00:00, 1665.21it/s]
100%|██████████| 9999/9999 [00:06<00:00, 1451.31it/s]
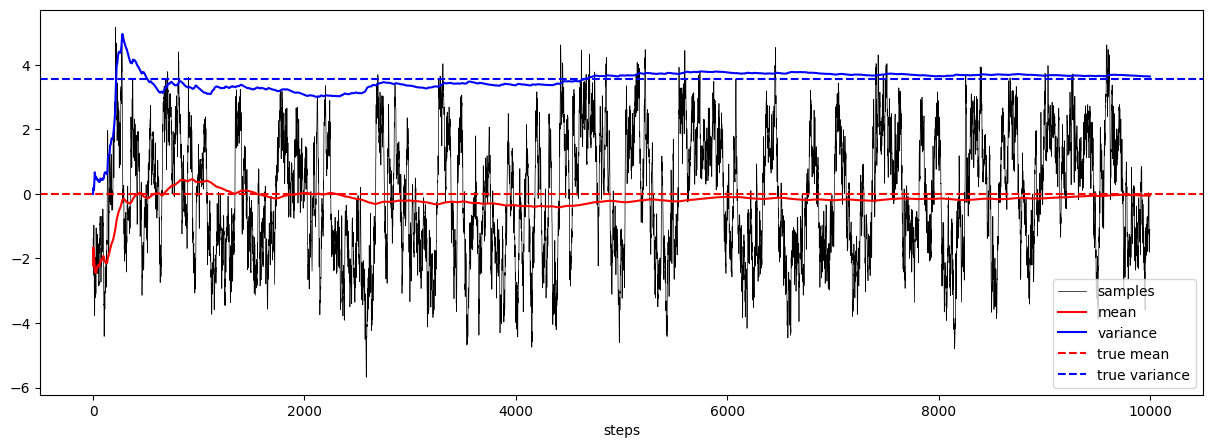
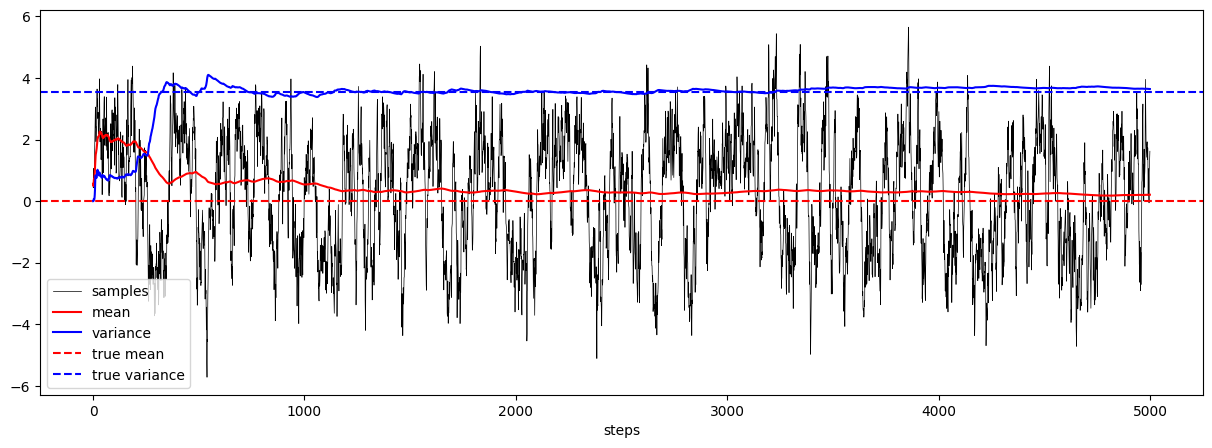
さて、下記図の生成されたデータを見てみると、サンプルのパスが正の領域と負の領域を行ったり来たりしている様子が確認でき、サンプル平均とサンプル分散が理論値に近くなっていく様子を確認できます。
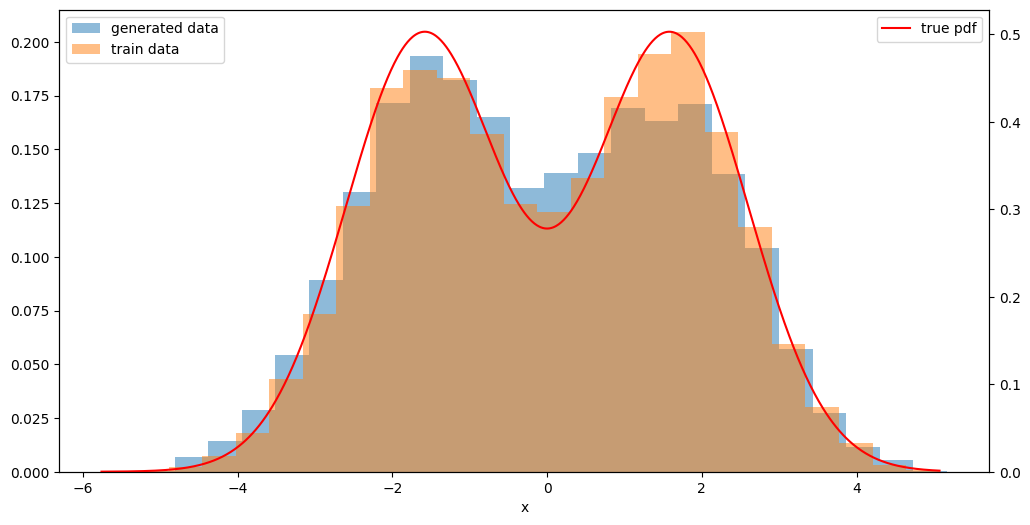
また、生成されたサンプルのヒストグラムを見るとやや控えめながら2つの峰を確認することができ、元々の学習データの分布の形状および真の確率密度関数に近いデータが生成されていることがわかります!
fig, ax = plt.subplots(figsize=(15, 5))
plot_samples_with_online_mean_and_variance(sampled_mixed_norm, true_mean=0.0, true_var=1.0 + 0.25*3.2*3.2, ax=ax)
plt.show()

fig, ax = plt.subplots(figsize=(12, 6))
plot_hist_with_true_pdf(sampled_mixed_norm, ax=ax, true_pdf=None, label='generated data', bins=25)
plot_hist_with_true_pdf(X_mixed_gaussian, ax=ax, true_pdf=true_pdf_mixed_normal, label='train data', bins=25)
plt.show()
ところで PFN岡野原さんの著書「拡散モデル データ生成技術の数理」 の第3章ではランジュバン・モンテカルロ法以外にもスコア関数を用いた 2 つのデータ生成方法が説明されています。
それは拡散過程 $dx=f(t)xdt +g(t)dW$ に対する
-
逆拡散過程:
$$
dx = [f(t)x - g(t)^2 \nabla_x \log p_t(x)] dt + g(t) d\bar{W}_t
$$ -
確率フローODE:
$$
\frac{dx}{dt} = f(t)x - \frac{1}{2} \nabla_x \log p_t(x)
$$
の 2 つです。
詳細な説明はPFN岡野原さんの著書「拡散モデル データ生成技術の数理」を参照していただきたいですが、ここでは $f(t)=0, g(t)=1, \nabla_x \log p_t(x)=s_\theta(x, \sqrt{t})$ として逆拡散過程・確率フローODEを用いたデータ生成も試してみましょう。
ざっくりとオイラー法とオイラー・丸山法を使って実装してみます。
def euler(
    x0: np.ndarray,
    f: Callable[[np.ndarray, float], np.ndarray],
    t0: float,
    t1: float,
    n_steps: int
) -> tuple[np.ndarray, np.ndarray]:
    """Generate samples from the Euler method.

    Args:
        x0 (np.ndarray): initial position of the chain.
        f (Callable[[np.ndarray], np.ndarray]): vector field.
        t0 (float): initial time.
        t1 (float): final time.
        n_steps (int): number of steps.

    Returns:
        np.ndarray: time points.
        np.ndarray: samples from the Euler method.
            (n_steps, *x0.shape) shape array.

    NOTE:
        the shape of an output of f must be the same as x0.
    """  # noqa
    ts = np.linspace(t0, t1, n_steps)
    dt = ts[1] - ts[0]
    xs = np.zeros((n_steps,)+x0.shape)
    xs[0] = x0
    for k in trange(1, n_steps):
        xs[k] = xs[k-1] + f(xs[k-1], ts[k-1]) * dt
    return ts, xs


def euler_maruyama(
    x0: np.ndarray,
    f: Callable[[np.ndarray, float], np.ndarray],
    g: Callable[[np.ndarray, float], np.ndarray],
    t0: float,
    t1: float,
    n_steps: int,
) -> tuple[np.ndarray, np.ndarray]:
    """Generate samples from the Euler-Maruyama method.

    Args:
        x0 (np.ndarray): initial position of the chain.
        f (Callable[[np.ndarray], np.ndarray]): vector field.
        g (Callable[[np.ndarray], np.ndarray]): noise vector field.
        t0 (float): initial time.
        t1 (float): final time.
        n_steps (int): number of steps.

    Returns:
        np.ndarray: time points.
        np.ndarray: samples from the Euler-Maruyama method.
            (n_steps, *x0.shape) shape array.

    NOTE:
        the shape of an output of f and g must be the same as x0.
    """  # noqa
    ts = np.linspace(t0, t1, n_steps)
    dt = ts[1] - ts[0]
    xs = np.zeros((n_steps,)+x0.shape)
    xs[0] = x0
    for k in trange(1, n_steps):
        xs[k] = xs[k-1]
        xs[k] += f(xs[k-1], ts[k-1]) * dt
        xs[k] += g(xs[k-1], ts[k-1]) * np.sqrt(abs(dt)) * np.random.randn(*x0.shape)  # noqa
    return ts, xs


sampled_paths_mixed_norm = euler(
    x0=np.random.randn(1000)*np.sqrt(10),
    f=lambda x, t: - 0.5 * mixed_gausssian_score_model.predict(np.hstack([x.reshape(-1, 1), np.array([[np.sqrt(t)]]*len(x))])).flatten(),
    t0=10,
    t1=0,
    n_steps=2000,
)
sampled_paths_mixed_norm[1].shape

sampled_paths_mixed_norm_em = euler_maruyama(
    x0=np.random.randn(1000)*np.sqrt(10),
    f=lambda x, t: - mixed_gausssian_score_model.predict(np.hstack([x.reshape(-1, 1), np.array([[np.sqrt(t)]]*len(x))])).flatten(),
    g=lambda x, t: 1,
    t0=10,
    t1=0,
    n_steps=2000,
)
sampled_paths_mixed_norm_em[1].shape
100%|██████████| 1999/1999 [00:03<00:00, 587.19it/s]
100%|██████████| 1999/1999 [00:03<00:00, 513.26it/s]

(2000, 1000)
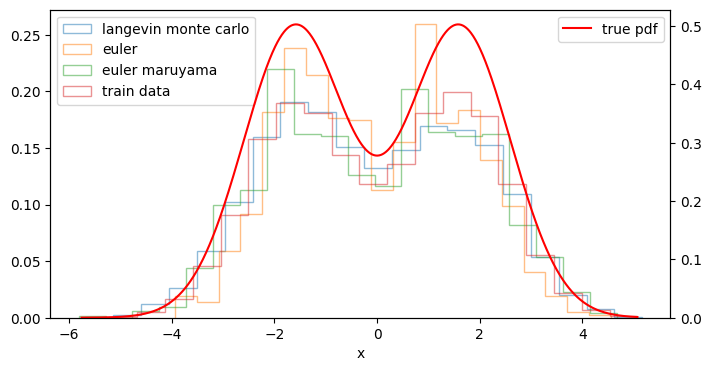
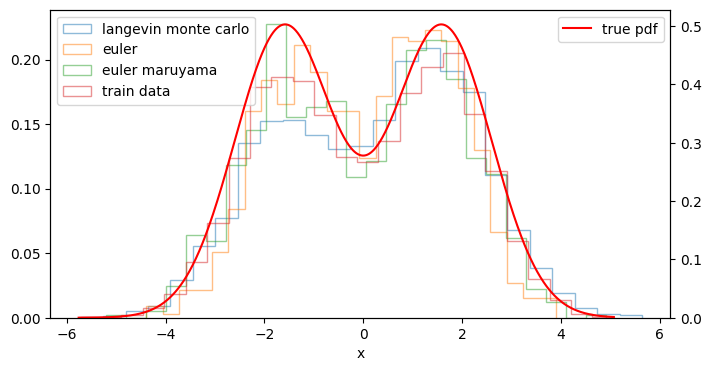
そして、ランジュバン・モンテカルロ法で生成したデータも併せて下記図のヒストグラムを見てみると... いずれのデータ生成方法でも元々の学習データの分布の形状および真の確率密度関数に近いデータが生成できていることがわかります!
fig, ax = plt.subplots(figsize=(8, 4))
plot_hist_with_true_pdf(sampled_mixed_norm, ax=ax, true_pdf=None, label='langevin monte carlo', bins=20, histtype='step')
plot_hist_with_true_pdf(sampled_paths_mixed_norm[1][-1], ax=ax, true_pdf=None, label='euler', bins=20, histtype='step')
plot_hist_with_true_pdf(sampled_paths_mixed_norm_em[1][-1], ax=ax, true_pdf=None, label='euler maruyama', bins=20, histtype='step')
plot_hist_with_true_pdf(X_mixed_gaussian, ax=ax, true_pdf=true_pdf_mixed_normal, label='train data', bins=20, histtype='step')
plt.show()
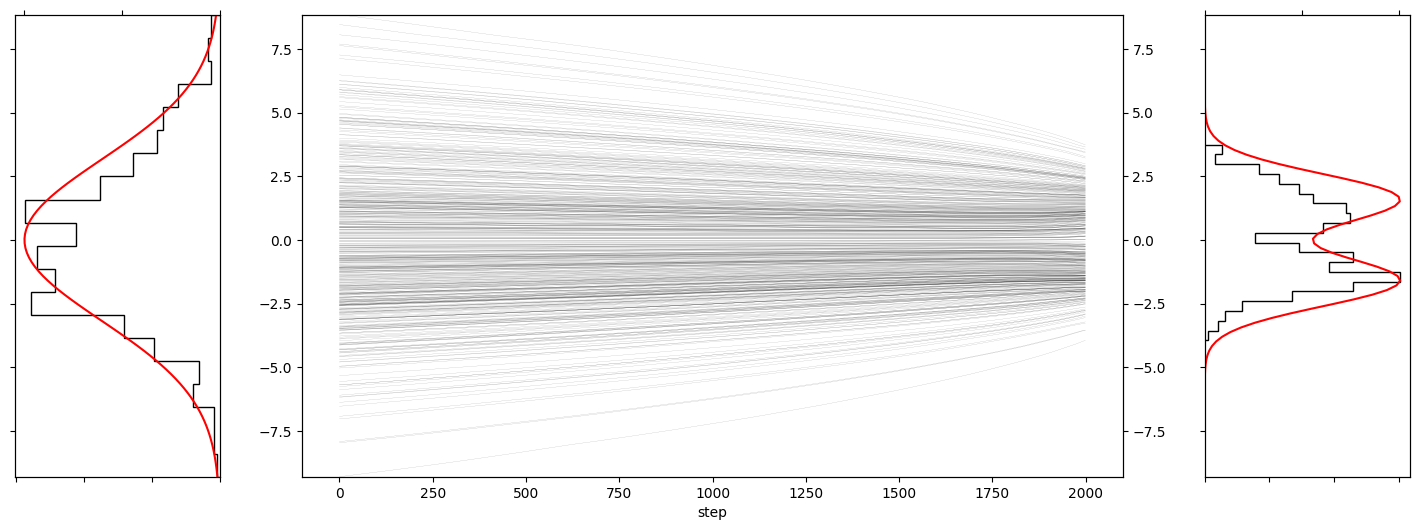
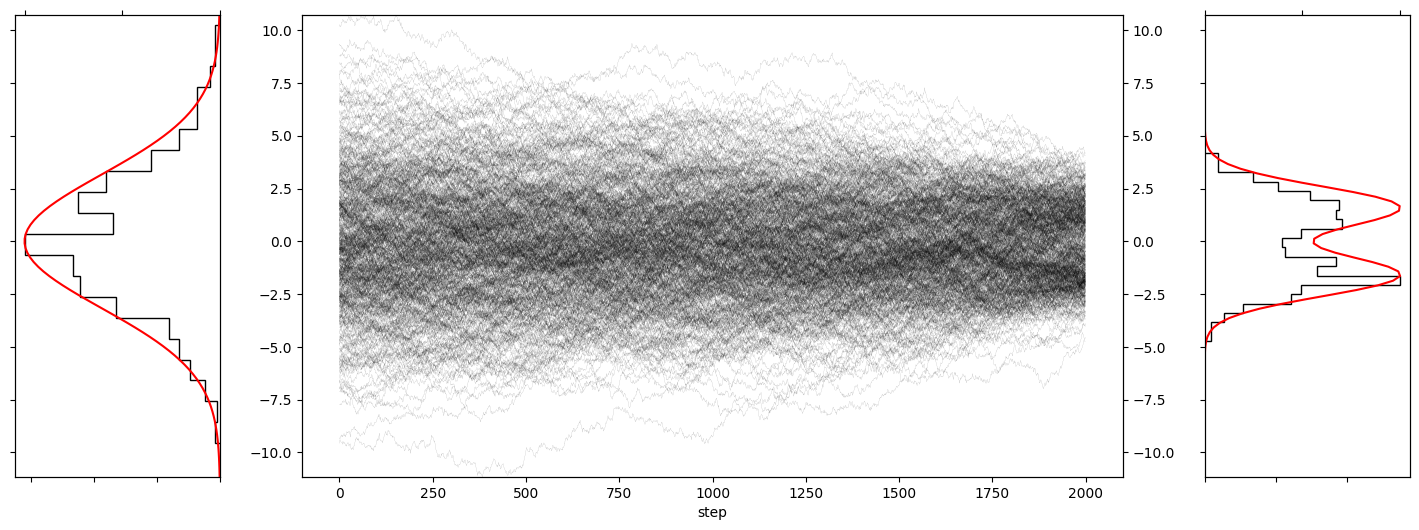
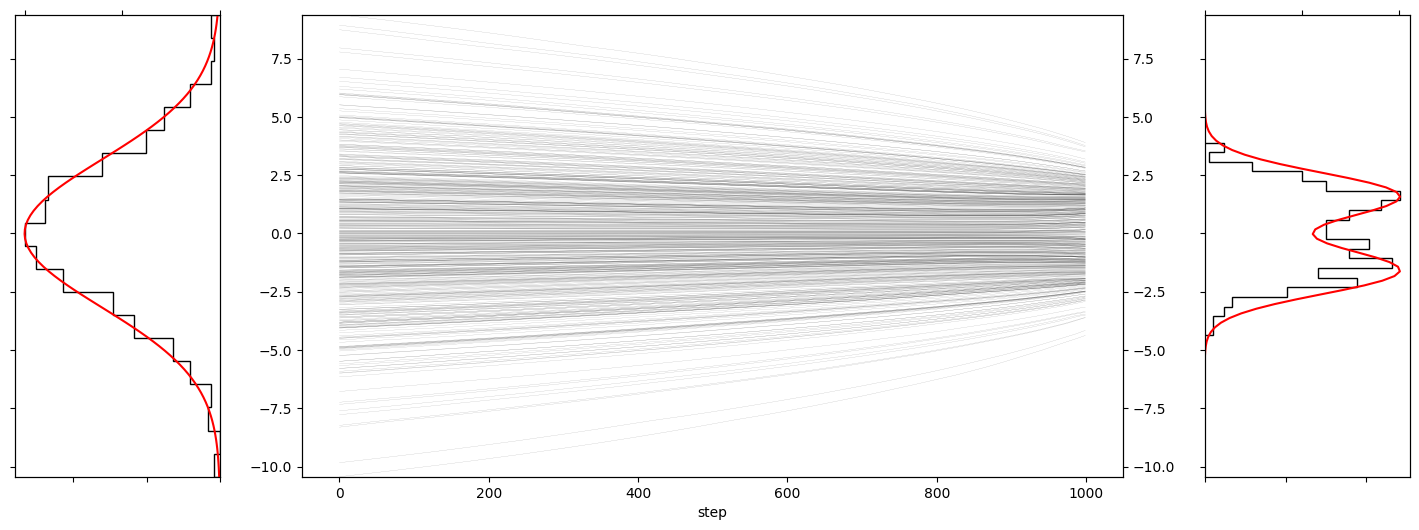
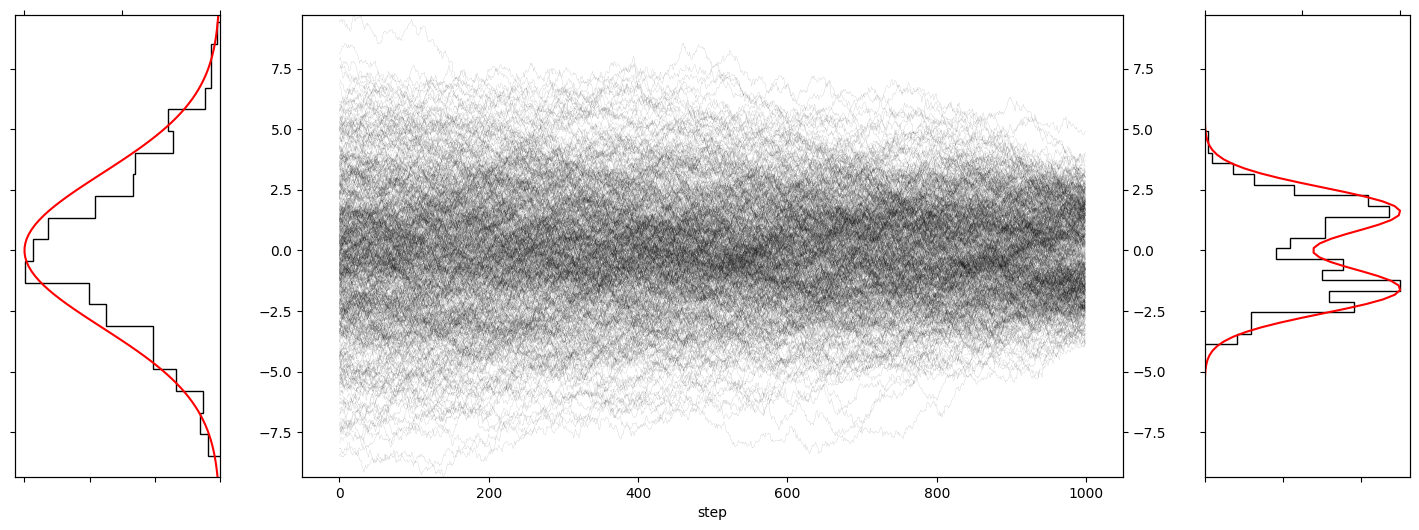
ところで、逆拡散過程と確率フローODEを用いたデータ生成では、どの開始点からどの点が生成されたのかを見ることができます😲
def plot_path_with_start_end_histogram(
    Xst,
    ymin: float | None=None,
    ymax: float | None=None,
    true_start_density: Callable[[float],float]|None=None,
    true_end_density: Callable[[float],float]|None=None,
    label_prefix='',
    color='k',
    true_color='r',
    true_linestyle='-',
    fig=None, gs=None, axes=None, axesd=None,
    bins=30,
):

    ymin = ymin if ymin is not None else Xst.min()
    ymax = ymax if ymax is not None else Xst.max()

    axes_is_not_given = False
    axesd_is_not_given = False

    if axes is None:
        fig = fig or plt.figure(figsize=(18, 6))
        gs = gs or GridSpec(1, 3, width_ratios=[1, 4, 1])
        axes = [fig.add_subplot(gs[i]) for i in range(3)]
        axes_is_not_given = True
    if axesd is None:
        axesd = [axes[0].twiny(), axes[1].twinx(), axes[2].twiny()]
        axesd_is_not_given = True

    # histogram at t=0
    axes[0].hist(Xst[0, :], bins=bins, edgecolor=color, histtype='step', orientation='horizontal', density=True, label=f'{label_prefix} prior histogram')
    axes[0].set_xlim(0)
    if axes_is_not_given:
        axes[0].invert_xaxis()
    # histogram at t=T
    axes[2].hist(Xst[-1, :], bins=bins, edgecolor=color, histtype='step', orientation='horizontal', density=True, label=f'{label_prefix} posterior histogram')
    axes[2].set_xlim(0)
    # path from t=0 to t=T
    for i in range(Xst.shape[1]):
        axes[1].plot(Xst[:, i], color=color, alpha=0.5, lw=0.1, label=f'{label_prefix} path' if i == 0 else None)
    axes[1].set_xlabel('step')
    axesd[1].set_ylim(ymin, ymax)

    # plot true density
    if true_start_density is not None:
        x = np.linspace(ymin, ymax, 100)
        axesd[0].plot(true_start_density(x), x, color=true_color, linestyle=true_linestyle, label=f'{label_prefix} theo. prior p.d.f.')
        axesd[0].set_xlim(0)
        if axesd_is_not_given:
            axesd[0].invert_xaxis()
        axesd[0].set_xticklabels([])

    if true_end_density is not None:
        x = np.linspace(ymin, ymax, 100)
        axesd[2].plot(true_end_density(x), x, color=true_color, linestyle=true_linestyle, label=f'{label_prefix} theo. posterior p.d.f.')
        axesd[2].set_xlim(0)
        axesd[2].set_xticklabels([])

    # set ylim
    for ax in axes:
        ax.set_ylim(ymin, ymax)

    # delete unnecessary ticks
    for ax in [axes[0], axes[2]]:
        ax.set_xticklabels([])
        ax.set_yticklabels([])

    return axes, axesd

plot_path_with_start_end_histogram(
    sampled_paths_mixed_norm[1][:, :500],
    true_start_density=lambda x: np.exp(-0.5*x**2/10),
    true_end_density=lambda x: 0.5*np.exp(-0.5*(x-1.6)**2)/np.sqrt(2*np.pi) + 0.5*np.exp(-0.5*(x+1.6)**2)/np.sqrt(2*np.pi),
    bins=20,
)

plot_path_with_start_end_histogram(
    sampled_paths_mixed_norm_em[1][:, :500],
    true_start_density=lambda x: np.exp(-0.5*x**2/10),
    true_end_density=lambda x: 0.5*np.exp(-0.5*(x-1.6)**2)/np.sqrt(2*np.pi) + 0.5*np.exp(-0.5*(x+1.6)**2)/np.sqrt(2*np.pi),
    bins=20,
)
今回のケースでは分散の大きいガウス分布から生成されたデータが徐々に中央(0)に集まっていき、最後のステップの直前くらいで2こぶに分かれている様子を確認することができます。
この様子からデノイジングスコアマッチングと逆拡散過程・確率フローODEを用いたデータ生成においては、
- 拡散過程:もともとのデータの分布を徐々に壊していく過程
- 逆拡散過程(確率フローODE):壊されたデータの分布から粗い粒度から順にデータ分布を復元していく過程
と直感的に解釈することができそうです。
scikit-learn の Estimator っぽいクラスの実装
最後に前節で実装した関数等をまとめて、scikit-learn っぽいクラスを作成してみましょう。
-
ScoreBasedGenerator(LGBRegressor()).fit(X)でスコア関数($s_\theta(x,\sigma)$)を学習 -
ScoreBasedGenerator(LGBRegressor()).sample(n_samples)でデータを生成
できるようにします。また、条件付き分布のスコア関数にも対応できるように
-
ScoreBasedGenerator(LGBRegressor()).fit(X,y)でスコア関数($s_\theta(y,\sigma|X)$)を学習 -
ScoreBasedGenerator(LGBRegressor()).sample(X, n_samples)でデータを生成
で条件付き分布からデータを生成できるようにします。
from enum import Enum
from functools import partial
from typing import Literal, TypeVar
import sklearn
from sklearn.base import BaseEstimator, check_array, check_is_fitted, check_X_y

TScoreBasedGenerator = TypeVar('TScoreBasedGenerator', bound='ScoreBasedGenerator')


class ScoreBasedGenerator(BaseEstimator):

    class SamplingMethod(Enum):
        LANGEVIN_MONTECARLO: str = 'langevin_montecarlo'
        EULER: str = 'euler'
        EULER_MARUYAMA: str = 'euler_maruyama'

    def __init__(self, estimator: BaseEstimator, random_state: int = 0):
        self.estimator = estimator
        self.random_state = random_state

    def fit(
        self: TScoreBasedGenerator,
        X: np.ndarray,
        y: np.ndarray | None = None,
        *,
        noise_strengths: Iterable[float] = np.sqrt(np.linspace(0, 10, 11)[1:]),  # noqa
        keep_noised_data: bool = False,
    ) -> TScoreBasedGenerator:
        r"""Train the score-function

        Args:
            X (np.ndarray): Generated data, or conditions if y is given. Shape: (N, D).
            y (np.ndarray | None, optional): Generated data given X. Defaults to None. Shape: (N, D).
            noise_strengths (Iterable[float], optional): noise strengths. Defaults to np.sqrt(np.linspace(0, 10, 101)[1:]).
            keep_noised_data (bool, optional): flag to keep noised data. Defaults to False.

        Returns:
            Self: trained model.
'
        NOTE:
            if y is not given, model learns the score function of X: $\partial log p(X) / \partial X$
            if y is given, model learns the score function of y given X: $\partial log p(y|X) / \partial y$
        """  # noqa

        if y is None:
            # if y is not given, model learns the score function of X
            X, y = None, check_array(X, ensure_2d=False)  # type: ignore
            assert y is not None
        else:
            # if y is given, model learns the score function of y given X
            X, y = check_X_y(X, y, multi_output=True)
            assert y is not None

        self.noise_strengths_ = noise_strengths
        self.n_outputs_ = y.shape[1] if y.ndim > 1 else 1

        X_, y_, w_ = create_noised_data(y, noise_strengths, conditions=X, seed=self.random_state)  # noqa
        self.X_ = X_ if keep_noised_data else None
        self.y_ = y_ if keep_noised_data else None
        self.w_ = w_ if keep_noised_data else None

        self.estimator_ = sklearn.clone(self.estimator)
        self.estimator_.fit(
            X_,
            y_ if self.n_outputs_ > 1 else y_.flatten(),
            sample_weight=w_.flatten(),
        )

        return self

    def predict(
        self,
        X: np.ndarray | None = None,
        *,
        aggregate: Literal['mean', 'median'] = 'mean',
        return_std: bool = False,
        **kwargs,
    ) -> np.ndarray | tuple[np.ndarray, np.ndarray]:
        """Predict the mean and standard deviation of the generated data.

        Args:
            X (np.ndarray | None, optional): conditions. Defaults to None.
            aggregate (Literal['mean', 'median'], optional): aggregation method. Defaults to 'mean'.
            return_std (bool, optional): flag to return standard deviation. Defaults to False.

        Returns:
            np.ndarray | tuple[np.ndarray, np.ndarray]:
                - mean of the generated data if return_std is False.
                    - (N, n_outputs), or (N,) if n_outputs is 1.
                - mean and standard deviation of the generated data if return_std is True.
                    - a pair of 2 arrays with (N, n_outputs), or (N,) if n_outputs is 1.

        NOTE:
            the output is squeezed if the number of outputs is 1.
        """  # noqa
        agg_func = np.mean if aggregate == 'mean' else np.median

        # samples: (n_samples, N, n_outputs)
        samples = self.sample(X, **(kwargs | {'return_paths': False}))

        if return_std:
            # (N, n_outputs) or (n_outputs,)
            return agg_func(samples, axis=0).squeeze()  # type: ignore
        else:
            return (
                agg_func(samples, axis=0).squeeze(),
                np.std(samples, axis=0).squeeze(),
            )  # type: ignore

    def _sample_langenvin_montecarlo(
        self,
        X: np.ndarray | None = None,
        *,
        init_sample: np.ndarray | None = None,
        n_samples: int = 1000,
        n_warmup: int = 100,
        alpha: float = 0.1,
        sigma: float | None = None,
    ) -> np.ndarray:
        """Generate samples from the Langevin Monte Carlo algorithm.

        Args:
            X (np.ndarray | None, optional): conditions. Defaults to None.
            init_sample (np.ndarray | None, optional): initial sample. Defaults to None.
                (n_outputs,) shape array if it is not None.
            n_samples (int, optional): number of samples. Defaults to 1000.
            n_warmup (int, optional): number of warmup steps before generating samples. Defaults to 100.
            alpha (float, optional): time step size of the Langevin Monte Carlo algorithm. Defaults to 0.1.
            sigma (float | None, optional): noise strength. Defaults to None.

        Returns:
            np.ndarray: samples from the Langevin Monte Carlo algorithm.
                (n_samples, N, n_outputs) shape array.
        """  # noqa
        if X is None:
            # x: (1, n_outputs)
            if init_sample is not None:
                x0 = init_sample.reshape(1, self.n_outputs_)
            else:
                x0 = np.random.randn(1, self.n_outputs_) * np.sqrt(max(self.noise_strengths_))  # noqa

            def dU(x, sigma):
                return - self.estimator_.predict(np.hstack([x, np.array([[sigma]]*len(x))])).reshape(*x.shape)  # noqa
        else:
            # x: (N, n_outputs)
            if init_sample is not None:
                x0 = np.vstack([init_sample.reshape(1, self.n_outputs_)]*X.shape[0])  # noqa
            else:
                x0 = np.random.randn(X.shape[0], self.n_outputs_)*np.sqrt(max(self.noise_strengths_))  # noqa

            def dU(x, sigma):
                return - self.estimator_.predict(np.hstack([X, x, np.array([[sigma]]*len(x))])).reshape(*x.shape)  # noqa

        if sigma is None:
            for sigma in sorted(self.noise_strengths_)[::-1]:
                # NOTE: decrease the noise strength step by step
                x0 = langevin_montecarlo(
                    x0=x0,
                    nabla_U=partial(dU, sigma=sigma),
                    n_steps=n_warmup + n_samples,
                    delta_t=alpha,
                )[-1]

        # Output: (n_samples, N, n_outputs)
        return langevin_montecarlo(
            x0=x0,
            nabla_U=partial(dU, sigma=sigma),
            n_steps=n_warmup + n_samples,
            delta_t=alpha,
        ).reshape(n_samples+n_warmup, -1, self.n_outputs_)[n_warmup:]

    def _sample_euler(
        self,
        X: np.ndarray | None = None,
        *,
        n_samples: int = 1000,
        n_steps: int = 1000,
        return_paths: bool = False,
    ) -> np.ndarray:
        """Generate samples from the Euler method.

        Args:
            X (np.ndarray | None, optional): conditions. Defaults to None.
            n_samples (int, optional): number of samples. Defaults to 1000.
            n_steps (int, optional): number of steps. Defaults to 1000.
            return_paths (bool, optional): flag to return paths. Defaults to False.

        Returns:
            np.ndarray: samples from the Euler method.
                (n_steps, n_samples, N, n_outputs) shape array if return_paths is True.
                (n_samples, N, n_outputs) shape array if return_paths is False.
        """  # noqa
        if X is None:
            # x: (n_samples, n_outputs)
            x0 = np.random.randn(n_samples, self.n_outputs_) * max(self.noise_strengths_)  # noqa
            N = 1

            def f(x, t):
                return - 0.5 * self.estimator_.predict(np.hstack([x, np.array([[np.sqrt(t)]]*len(x))])).reshape(*x.shape)  # noqa
        else:
            # x: (n_samples * N, n_outputs)
            x0 = np.random.randn(n_samples * X.shape[0], self.n_outputs_)*np.sqrt(max(self.noise_strengths_))  # noqa
            N = X.shape[0]
            X = np.repeat(X, n_samples, axis=0)

            def f(x, t):
                return - 0.5 * self.estimator_.predict(np.hstack([X, x, np.array([[np.sqrt(t)]]*len(x))])).reshape(*x.shape)  # noqa

        paths = euler(
            x0=x0,
            f=f,
            t0=max(self.noise_strengths_)**2,
            t1=0,
            n_steps=n_steps,
        )[1].reshape(n_steps, n_samples, N, self.n_outputs_)

        # Output: (n_steps, n_samples, N, n_outputs) if return_paths else (n_samples, N, n_outputs)  # noqa
        return paths if return_paths else paths[-1]

    def _sample_euler_maruyama(
        self,
        X: np.ndarray | None = None,
        *,
        n_samples: int = 1000,
        n_steps: int = 1000,
        return_paths: bool = False,
    ) -> np.ndarray:
        """Generate samples from the Euler-Maruyama method.

        Args:
            X (np.ndarray | None, optional): conditions. Defaults to None.
            n_samples (int, optional): number of samples. Defaults to 1000.
            n_steps (int, optional): number of steps. Defaults to 1000.
            return_paths (bool, optional): flag to return paths. Defaults to False.

        Returns:
            np.ndarray: samples from the Euler-Maruyama method.
                (n_step, n_samples, N, n_outputs) shape array if return_paths is True.
                (n_samples, N, n_outputs) shape array if return_paths is False.
        """  # noqa
        if X is None:
            # x: (n_samples, n_outputs)
            x0 = np.random.randn(n_samples, self.n_outputs_) * max(self.noise_strengths_)  # noqa
            N = 1

            def f(x, t):
                return - self.estimator_.predict(np.hstack([x, np.array([[np.sqrt(t)]]*len(x))])).reshape(*x.shape)  # noqa
        else:
            # x: (n_samples * N, n_outputs)
            x0 = np.random.randn(n_samples * X.shape[0], self.n_outputs_)*np.sqrt(max(self.noise_strengths_))  # noqa
            N = X.shape[0]
            X = np.repeat(X, n_samples, axis=0)

            def f(x, t):
                return - self.estimator_.predict(np.hstack([X, x, np.array([[np.sqrt(t)]]*len(x))])).reshape(*x.shape)  # noqa

        paths = euler_maruyama(
            x0=x0,
            f=f,
            g=lambda x, t: 1.,  # type: ignore
            t0=max(self.noise_strengths_)**2,
            t1=0,
            n_steps=n_steps,
        )[1].reshape(n_steps, n_samples, N, self.n_outputs_)

        # Output: (n_steps, n_samples, N, n_outputs) if return_paths else (n_samples, N, n_outputs)  # noqa
        return paths if return_paths else paths[-1]

    def sample(
        self,
        X: np.ndarray | None = None,
        *,
        n_samples: int = 1000,
        sampling_method: SamplingMethod = SamplingMethod.LANGEVIN_MONTECARLO,
        n_warmup: int = 100,  # only for langevin monte carlo
        alpha: float = 0.1,  # only for langevin monte carlo
        sigma: float | None = None,  # only for langevin monte carlo
        init_sample: np.ndarray | None = None,  # only for langevin monte carlo
        n_steps: int = 1000,  # only for euler, euler-maruyama
        return_paths: bool = False,  # only for euler, euler-maruyama
        seed: int | None = None,
    ) -> np.ndarray:
        """Generate samples from the score-based generator.

        Args:
            X (np.ndarray | None, optional): conditions. Defaults to None.
            n_samples (int, optional): number of samples. Defaults to 1000.
            sampling_method (SamplingMethod, optional): sampling method. Defaults to SamplingMethod.LANGEVIN_MONTECARLO.

            n_warmup (int, optional): number of warmup steps before generating samples. Defaults to 100. (NOTE: only for langevin monte carlo)
            alpha (float, optional): time step size of the Langevin Monte Carlo algorithm. Defaults to 0.1. (NOTE: only for langevin monte carlo)
            sigma (float | None, optional): noise strength. Defaults to None. (NOTE: only for langevin monte carlo)
            init_sample (np.ndarray | None, optional): initial sample. Defaults to None. (n_outputs,) shape array if it is not None.  (NOTE: only for langevin monte carlo)

            n_steps (int, optional): number of steps. Defaults to 1000. (NOTE: only for euler, euler-maruyama)
            return_paths (bool, optional): flag to return paths. Defaults to False. (NOTE: only for euler, euler-maruyama)

            seed (int, optional): random seed. Defaults to None.

        Returns:
            np.ndarray: samples from the score-based generator.
                (n_step, n_samples, N, n_outputs) shape array if return_paths is True and sampling_method is Euler or Euler-Maruyama.
                (n_samples, N, n_outputs) shape array otherwise.
        """  # noqa

        check_is_fitted(self, 'estimator_')
        check_is_fitted(self, 'noise_strengths_')

        with np_seed(seed):
            if sampling_method == ScoreBasedGenerator.SamplingMethod.LANGEVIN_MONTECARLO:  # noqa
                return self._sample_langenvin_montecarlo(X, n_samples=n_samples, n_warmup=n_warmup, alpha=alpha, sigma=sigma, init_sample=init_sample)  # noqa
            elif sampling_method == ScoreBasedGenerator.SamplingMethod.EULER:  # noqa
                return self._sample_euler(X, n_samples=n_samples, n_steps=n_steps, return_paths=return_paths)  # noqa
            elif sampling_method == ScoreBasedGenerator.SamplingMethod.EULER_MARUYAMA:  # noqa
                return self._sample_euler_maruyama(X, n_samples=n_samples, n_steps=n_steps, return_paths=return_paths)  # noqa
            else:
                raise ValueError(f'Invalid sampling method: {sampling_method}')
1次元の混合ガウス分布で動作確認
上記で用いた一次元混合ガウス分布($p(x) = 0.5 \mathcal{N}(x|1.6,1) + 0.5 \mathcal{N}(x|-1.6,1)$)の例で動作確認を行います。
sbmgenerator1 = ScoreBasedGenerator(estimator=LGBMRegressor(random_state=42), random_state=42)
sbmgenerator1.fit(X_mixed_gaussian, noise_strengths=np.sqrt(np.linspace(0, 10, 101)[1:]), keep_noised_data=True)
[LightGBM] [Info] Auto-choosing row-wise multi-threading, the overhead of testing was 0.002703 seconds.
You can set `force_row_wise=true` to remove the overhead.
And if memory is not enough, you can set `force_col_wise=true`.
[LightGBM] [Info] Total Bins 356
[LightGBM] [Info] Number of data points in the train set: 1000000, number of used features: 2
[LightGBM] [Info] Start training from score 0.000884
_s1 = sbmgenerator1.sample(n_samples=5000, sampling_method=sbmgenerator1.SamplingMethod.LANGEVIN_MONTECARLO, sigma=0, alpha=0.2, n_warmup=1000)
_s2 = sbmgenerator1.sample(n_samples=1000, sampling_method=sbmgenerator1.SamplingMethod.EULER, return_paths=True)
_s3 = sbmgenerator1.sample(n_samples=1000, sampling_method=sbmgenerator1.SamplingMethod.EULER_MARUYAMA, return_paths=True)

fig, ax = plt.subplots(figsize=(8, 4))
plot_hist_with_true_pdf(_s1.flatten(), ax=ax, true_pdf=None, label='langevin monte carlo', bins=25, histtype='step')
plot_hist_with_true_pdf(_s2[-1].flatten(), ax=ax, true_pdf=None, label='euler', bins=25, histtype='step')
plot_hist_with_true_pdf(_s3[-1].flatten(), ax=ax, true_pdf=None, label='euler maruyama', bins=25, histtype='step')
plot_hist_with_true_pdf(X_mixed_gaussian, ax=ax, true_pdf=true_pdf_mixed_normal, label='train data', bins=25, histtype='step')
plt.show()

fig, ax = plt.subplots(figsize=(15, 5))
plot_samples_with_online_mean_and_variance(_s1.flatten(), true_mean=0.0, true_var=1.0 + 0.25*3.2*3.2, ax=ax)
plt.show()

fig, ax = plt.subplots(figsize=(12, 6))
plot_hist_with_true_pdf(_s1.flatten(), ax=ax, true_pdf=None, label='generated data', bins=25)
plot_hist_with_true_pdf(X_mixed_gaussian, ax=ax, true_pdf=true_pdf_mixed_normal, label='train data', bins=25)
plt.show()

plot_path_with_start_end_histogram(
    _s2[:, :500, 0, 0],
    true_start_density=lambda x: np.exp(-0.5*x**2/10),
    true_end_density=lambda x: 0.5*np.exp(-0.5*(x-1.6)**2)/np.sqrt(2*np.pi) + 0.5*np.exp(-0.5*(x+1.6)**2)/np.sqrt(2*np.pi),
    bins=20,
)

plot_path_with_start_end_histogram(
    _s3[:, :500, 0, 0],
    true_start_density=lambda x: np.exp(-0.5*x**2/10),
    true_end_density=lambda x: 0.5*np.exp(-0.5*(x-1.6)**2)/np.sqrt(2*np.pi) + 0.5*np.exp(-0.5*(x+1.6)**2)/np.sqrt(2*np.pi),
    bins=20,
)
100%|██████████| 5999/5999 [00:04<00:00, 1381.96it/s]
100%|██████████| 999/999 [00:01<00:00, 660.92it/s]
100%|██████████| 999/999 [00:01<00:00, 624.59it/s]
2次元の混合ガウス分布で動作確認
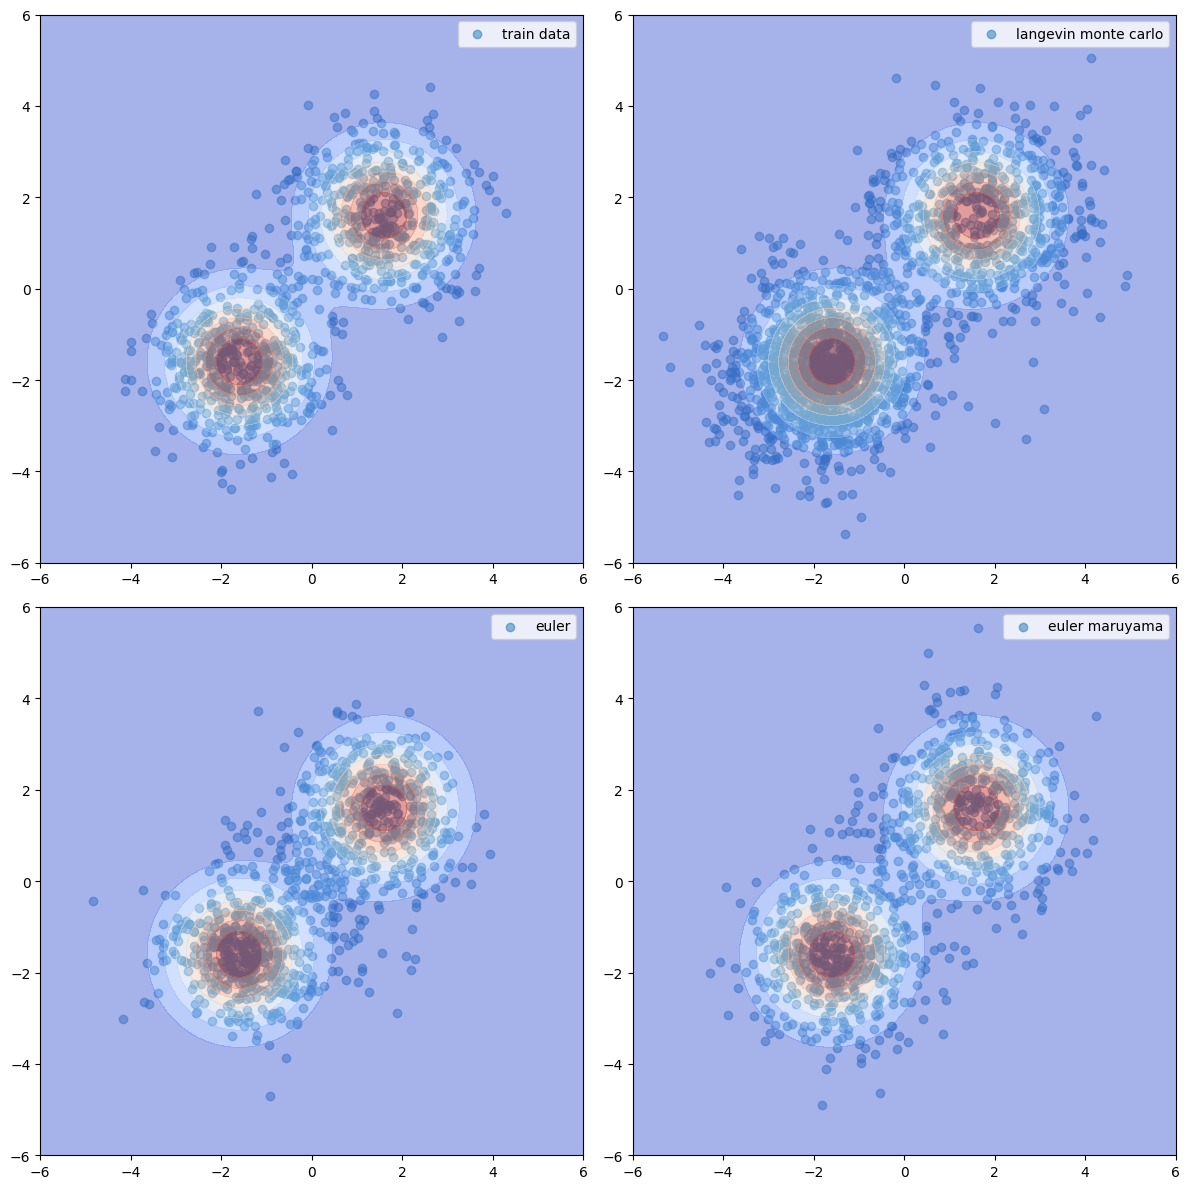
別の例での確認もかねて、2次元の混合ガウス分布で動作確認も行いましょう!
2 次元のデータの生成の場合はスコア関数も 2 次元になるため、multioutput に対応したモデルを使う必要があります。ここでは容易に多変数の出力にも対応できる CatBoost を使ってみます。
# データの生成
X = np.random.randn(1000, 2)
label = np.random.rand(1000) > 0.5
X[:, 0] += (2 * label - 1) * 1.6
X[:, 1] += (2 * label - 1) * 1.6

# 真の確率密度関数
true_pdf = lambda X: 0.5*np.exp(-0.5*(X[:, 0]-1.6)**2 - 0.5*(X[:, 1]-1.6)**2)/np.pi + 0.5*np.exp(-0.5*(X[:, 0]+1.6)**2 - 0.5*(X[:, 1]+1.6)**2)/np.pi

XX, YY = np.meshgrid(np.linspace(-6, 6, 100), np.linspace(-6, 6, 100))
ZZ = true_pdf(np.hstack([XX.reshape(-1, 1), YY.reshape(-1, 1)])).reshape(100, 100)
# モデルの学習
sbmgenerator2 = ScoreBasedGenerator(estimator=CatBoostRegressor(verbose=0, loss_function='MultiRMSE', random_state=42), random_state=42)
sbmgenerator2.fit(X, noise_strengths=np.sqrt(np.linspace(0, 10, 101)[1:]), keep_noised_data=True)
_s1 = sbmgenerator2.sample(n_samples=len(X)*2, sampling_method=sbmgenerator2.SamplingMethod.LANGEVIN_MONTECARLO, sigma=0, alpha=0.2, n_warmup=1000).squeeze()
_s2 = sbmgenerator2.sample(n_samples=len(X), sampling_method=sbmgenerator2.SamplingMethod.EULER, return_paths=True).squeeze()
_s3 = sbmgenerator2.sample(n_samples=len(X), sampling_method=sbmgenerator2.SamplingMethod.EULER_MARUYAMA, return_paths=True).squeeze()

fig, axs = plt.subplots(2, 2, figsize=(12, 12))
axs[0, 0].scatter(X[:, 0], X[:, 1], alpha=0.5, label='train data')
axs[0, 1].scatter(_s1[:, 0].squeeze(), _s1[:, 1].squeeze(), alpha=0.5, label='langevin monte carlo')
axs[1, 0].scatter(_s2[-1][:, 0].squeeze(), _s2[-1][:, 1].squeeze(), alpha=0.5, label='euler')
axs[1, 1].scatter(_s3[-1][:, 0].squeeze(), _s3[-1][:, 1].squeeze(), alpha=0.5, label='euler maruyama')
for ax in axs.flatten():
    ax.contourf(XX, YY, ZZ, alpha=0.5, cmap='coolwarm')
    ax.set_xlim(-6, 6)
    ax.set_ylim(-6, 6)
    ax.legend()
plt.tight_layout()
plt.show()
100%|██████████| 2999/2999 [00:01<00:00, 2053.82it/s]
100%|██████████| 999/999 [00:03<00:00, 313.09it/s]
100%|██████████| 999/999 [00:04<00:00, 246.22it/s]
条件付き分布からのデータ生成
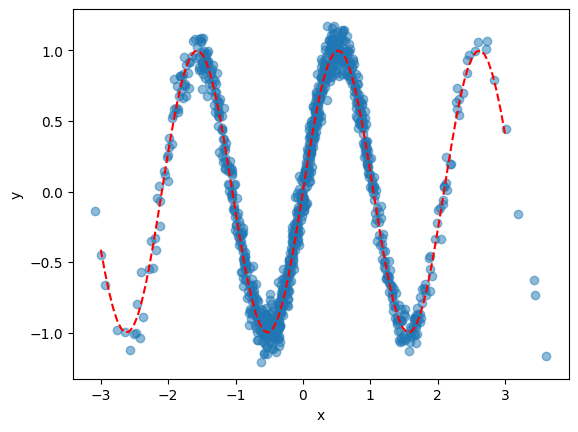
最後に条件付き分布からのデータ生成も試してみましょう。
$$
\begin{matrix}
x &\sim& \mathcal{N}(0, 1)\
y|x &\sim& \mathcal{N}(\sin(3x), \sqrt{0.1})\
\end{matrix}
$$
# データ生成
def true_func(x):
    return np.sin(3*x)

X = np.random.randn(1000, 1)
y = true_func(X).flatten() + np.random.randn(len(X))*0.1

plt.scatter(X, y, alpha=0.5)
plt.plot(np.linspace(-3, 3, 100), true_func(np.linspace(-3, 3, 100)), color='r', linestyle='--')
plt.xlabel('x')
plt.ylabel('y')
plt.show()
# モデルの学習
sbmgenerator3 = ScoreBasedGenerator(estimator=LGBMRegressor(random_state=42), random_state=42)
sbmgenerator3.fit(X, y, noise_strengths=np.sqrt(np.logspace(-4, np.log10(y.var()), 101)), keep_noised_data=True)
# [1] 2.2.2 p.37 で記載されている「$\sigma_$は等比数列となるように設定するのが一般的にである」に倣い、noise_strengths は対数スケールで設定
[LightGBM] [Info] Auto-choosing row-wise multi-threading, the overhead of testing was 0.000335 seconds.
You can set `force_row_wise=true` to remove the overhead.
And if memory is not enough, you can set `force_col_wise=true`.
[LightGBM] [Info] Total Bins 612
[LightGBM] [Info] Number of data points in the train set: 101000, number of used features: 3
[LightGBM] [Info] Start training from score 0.001831
今回のケースでは
$$
\begin{matrix}
dy &=& - \nabla_y \log q_\theta(y|x)dt + \sqrt{2}dW_t\\
&=& - \nabla_y \log q_\theta(x, y)dt + \sqrt{2}dW_t & (\because p(y|x)p(x) = p(x,y))\\
\end{matrix}
$$
のランジュバン・モンテカルロ法に基づいてデータ生成を行います。
# サンプリング
_s1 = sbmgenerator3.sample(
    np.linspace(-3, 3).reshape(-1, 1),
    n_samples=10000,
    sampling_method=sbmgenerator3.SamplingMethod.LANGEVIN_MONTECARLO,
    sigma=1e-6, alpha=0.001, n_warmup=1000,
    init_sample=np.array([0]),
).squeeze()
100%|██████████| 10999/10999 [00:08<00:00, 1309.78it/s]
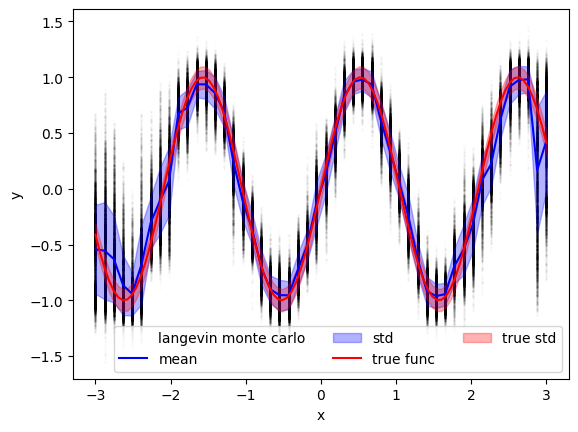
様々な $x$ に対して $y$ を生成した結果がこちら!
各 $x$ ごとに $sin(3x)$ に近い値が生成されていることが確認できます!
また、各 $x$ ごとの平均値を取った結果が真の $sin(3x)$ 近くなっている様子も確認できます!
plt.scatter(
    np.repeat(np.linspace(-3, 3).reshape(1, -1), 10000, axis=0).flatten(),
    _s1.flatten(),
    s=1, alpha=0.01, color='k', label='langevin monte carlo',
)
plt.plot(np.linspace(-3, 3), _s1.mean(axis=0), color='b', label='mean')
plt.fill_between(np.linspace(-3, 3), _s1.mean(axis=0)+_s1.std(axis=0), _s1.mean(axis=0)-_s1.std(axis=0), color='b', alpha=0.3, label='std')
plt.plot(np.linspace(-3, 3, 100), true_func(np.linspace(-3, 3, 100)), color='r', linestyle='-', label='true func')
plt.fill_between(np.linspace(-3, 3, 100), true_func(np.linspace(-3, 3, 100))+0.1, true_func(np.linspace(-3, 3, 100))-0.1, color='r', alpha=0.3, label='true std')
plt.xlabel('x')
plt.ylabel('y')
plt.legend(ncol=3)
plt.show()

plt.plot(np.linspace(-3, 3), _s1.std(axis=0), color='b', alpha=0.3, label='langenvin monte carlo')
plt.axhline(0.1, color='r', linestyle='--', label='true std')
plt.xlabel('x')
plt.ylabel('std')
plt.legend()
plt.show()
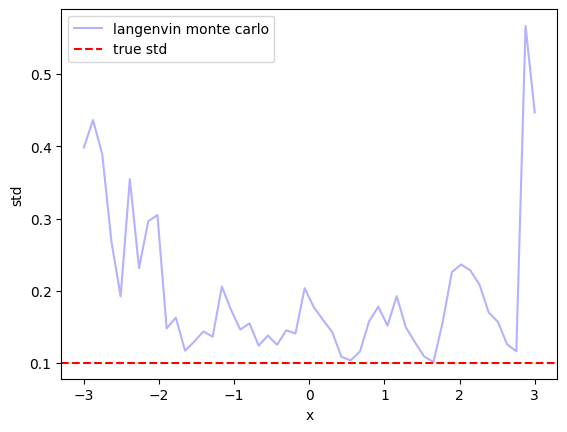
ただ、各 $x$ ごとに生成された $y$ の標準偏差を見ると真の標準偏差よりも少し大きな値となっていることがわかります。このあたりはモデル化誤差やモデルの予測誤差、離散化誤差などが関係しているのでしょうか?🤔
($x$が-3付近や3付近で大きな標準偏差になっているのはそもそもデータ点がほとんど存在しないからですね。ガウス過程回帰などでもよくあるやつです)
まとめ
さて、ここまで読んでいただきありがとうございます🙇♂️
本記事では岡野原さんの著書「拡散モデル データ生成技術の数理」の第2章くらいまでの内容をベースに、スコアベースモデルを用いたデータ生成について学びました。
特にスコアマッチング・デノイジングスコアマッチングを用いてスコア関数を推定し、ランジュバン・モンテカルロ法を用いてデータを生成する方法を python で実装することで理解を深めました。
特に今回実装した ScoreBasedGenerator クラスにより、scikit-learn 準拠の回帰モデルを用いて、
- 学習データ($\{x_n\}_{n=1}^{N}$)により $q_\theta(x)$ (のスコア関数)を学習し、学習された分布を使用してデータを生成;
- 学習データ($\{(x_n, y_n)\}_{n=1}^{N}$)により $q_\theta(y|x)$ (のスコア関数)を学習し、学習された分布を使用してデータを生成
をできるようになりました👏
ぜひ、本記事が拡散モデルを勉強されている方のお役に立てれば幸いです!
ご質問やご指摘等ございましたらぜひコメントいただけますと幸いです。
もっとわかりやすい例などがありましたら、ぜひご教示ください。
それでは、このあたりで👋
References
- [1] 岡野原大輔, 拡散モデル データ生成技術の数理, 岩波書店, 2023/02
- [2] Y. Song and S. Ermon, Generative Modeling by Estimating Gradients of the Data Distribution, In Proc. NeurIPS 2019
