はじめに
- 業務でGCEのVMを使って、nginxのリバースプロキシを作成する必要がありましたので、その際のCloud Monitoringの設定方法を説明したものになります。
- Stackdriver公式からnginxのモニタリング用プラグインが提供されており、本記事ではそれを使用しています。
- 以下の公式ドキュメントはVMに直接nginxをインストールするやり方を説明しているのですが、本記事ではDockerコンテナでnginxを作成する際の設定方法になります。
GCP環境
今回検証した環境は以下になります。同様な環境を構築しておく・VMにSSHログインできることが前提です。
- GCE VM N1 n1-standard-1 CentOS7
- Docker version 20.10.3
- ゾーン:asia-northeast1-b
- 外部IPがあることも前提です(内部IPのみは検証していません)
Cloud MonitoringのエージェントをVMにインストールする
以下の記事に従って、Cloud MonitoringのエージェントをVMにインストールします。
単一の VM に Cloud Monitoring エージェントをインストールする
- エージェントのパッケージ リポジトリを追加します。
curl -sSO https://dl.google.com/cloudagents/add-monitoring-agent-repo.sh
sudo bash add-monitoring-agent-repo.sh
- エージェントのバージョン一覧を確認します。
sudo yum list --showduplicates stackdriver-agent
- 今回は6.1.1のバージョンのエージェントをインストールしました。
sudo yum install -y stackdriver-agent-6.1.1
- エージェント サービスを開始します
sudo service stackdriver-agent start
- エージェントが期待どおりに動作していることを確認します
sudo service stackdriver-agent status
stackdriver-agent is running [ OK ]
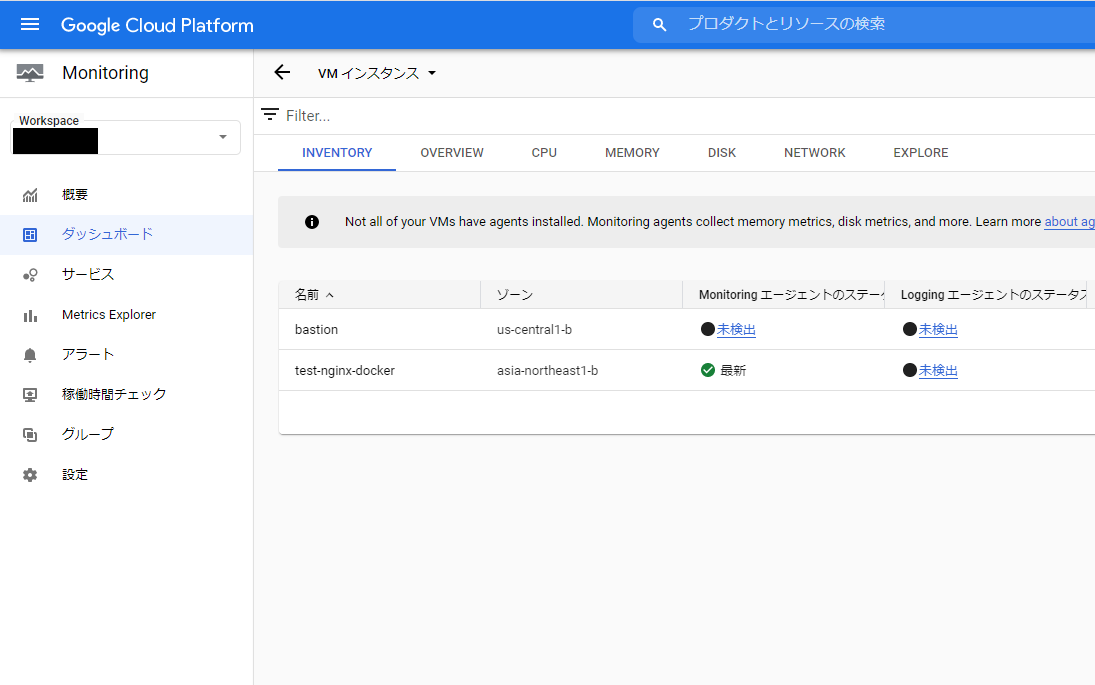
- 正常にエージェントのインストールが終了すると、Monitoring > ダッシュボード画面でMonitoringエージェントのステータスが緑色であるのを確認できます。
Nginxモニタリングプラグインを有効にする
以下の記事に従って、Nginxのモニタリング用のプラグインをインストールします。ApacheやMySQLなどのそのほかのプラグインもあるようです。
- Nginx のステータス情報ハンドラを有効にする必要があります。まずは、以下からファイル
status.confを取得する。
curl -O https://raw.githubusercontent.com/Stackdriver/stackdriver-agent-service-configs/master/etc/nginx/conf.d/status.conf
status.conf
server {
    listen 80;
    server_name local-stackdriver-agent.stackdriver.com;
    location /nginx_status {
        stub_status on;
        access_log off;
        allow 127.0.0.1;
        deny all;
    }
    location / {
        root /dev/null;
    }
}
- 以下のような
default.confファイルを用意し、上でダウンロードしてきたstatus.confの情報を記載します- VMにインストールされたエージェントがDockerコンテナ内のNginxのステータスを取得できるように、
location /nginx_statusのallowにVMの内部IPを記載します。
- VMにインストールされたエージェントがDockerコンテナ内のNginxのステータスを取得できるように、
default.conf
server {
    listen       80;
    listen  [::]:80;
    server_name  localhost;

    #charset koi8-r;
    #access_log  /var/log/nginx/host.access.log  main;

    location /nginx_status {
        stub_status on;
        access_log off;
        allow 127.0.0.1;
        allow xxx.xxx.xxx.xxx;  # ←VMの内部IPを記載する
        deny all;
    }

    location / {
        root   /usr/share/nginx/html;
        index  index.html index.htm;
    }

    #error_page  404              /404.html;

    # redirect server error pages to the static page /50x.html
    #
    error_page   500 502 503 504  /50x.html;
    location = /50x.html {
        root   /usr/share/nginx/html;
    }
}
- NginxのDockerコンテナを以下のコマンドで起動します。
- 今回、
--network="host"を指定して起動することで、ホストのネットワークを利用するようにコンテナを作成しています。こうすることで、VMのMonitoringエージェントが、VMの内部IPを指定し、http://VM内部IP:80/nginx_statusと通信できるようにしました。
- 今回、
sudo docker run --name nginx-server \
-v $PWD/default.conf:/etc/nginx/conf.d/default.conf \
-d --network="host" nginx
- curlコマンドでnginxのステータス情報を取得してみます。
curl http://VMの内部IP/nginx_status
- 以下のようなステータス情報が取得できます。
Active connections: 2
server accepts handled requests
 5 5 14
Reading: 0 Writing: 1 Waiting: 1
- nginxのモニタリングプラグインの設定ファイルを取得します。
(cd /etc/stackdriver/collectd.d/ && sudo curl -O https://raw.githubusercontent.com/Stackdriver/stackdriver-agent-service-configs/master/etc/collectd.d/nginx.conf)
- 取得した
nginx.confのファイルを以下のように書き換えます。
sudo vi /etc/stackdriver/collectd.d/nginx.conf
nginx.conf
# This is the monitoring configuration for Nginx.
# Make sure to enable stub_status in your Nginx configuration.
# Look for NGINX_HOST and NGINX_PORT to adjust your configuration file.
LoadPlugin nginx
<Plugin "nginx">
    # When using non-standard Nginx configurations, replace the below with
    #URL "http://NGINX_HOST:NGINX_PORT/nginx_status"
    #URL "http://local-stackdriver-agent.stackdriver.com:80/nginx_status"
    URL "http://VMの内部IP:80/nginx_status"
</Plugin>
- モニタリングエージェントを再起動します。
sudo service stackdriver-agent restart
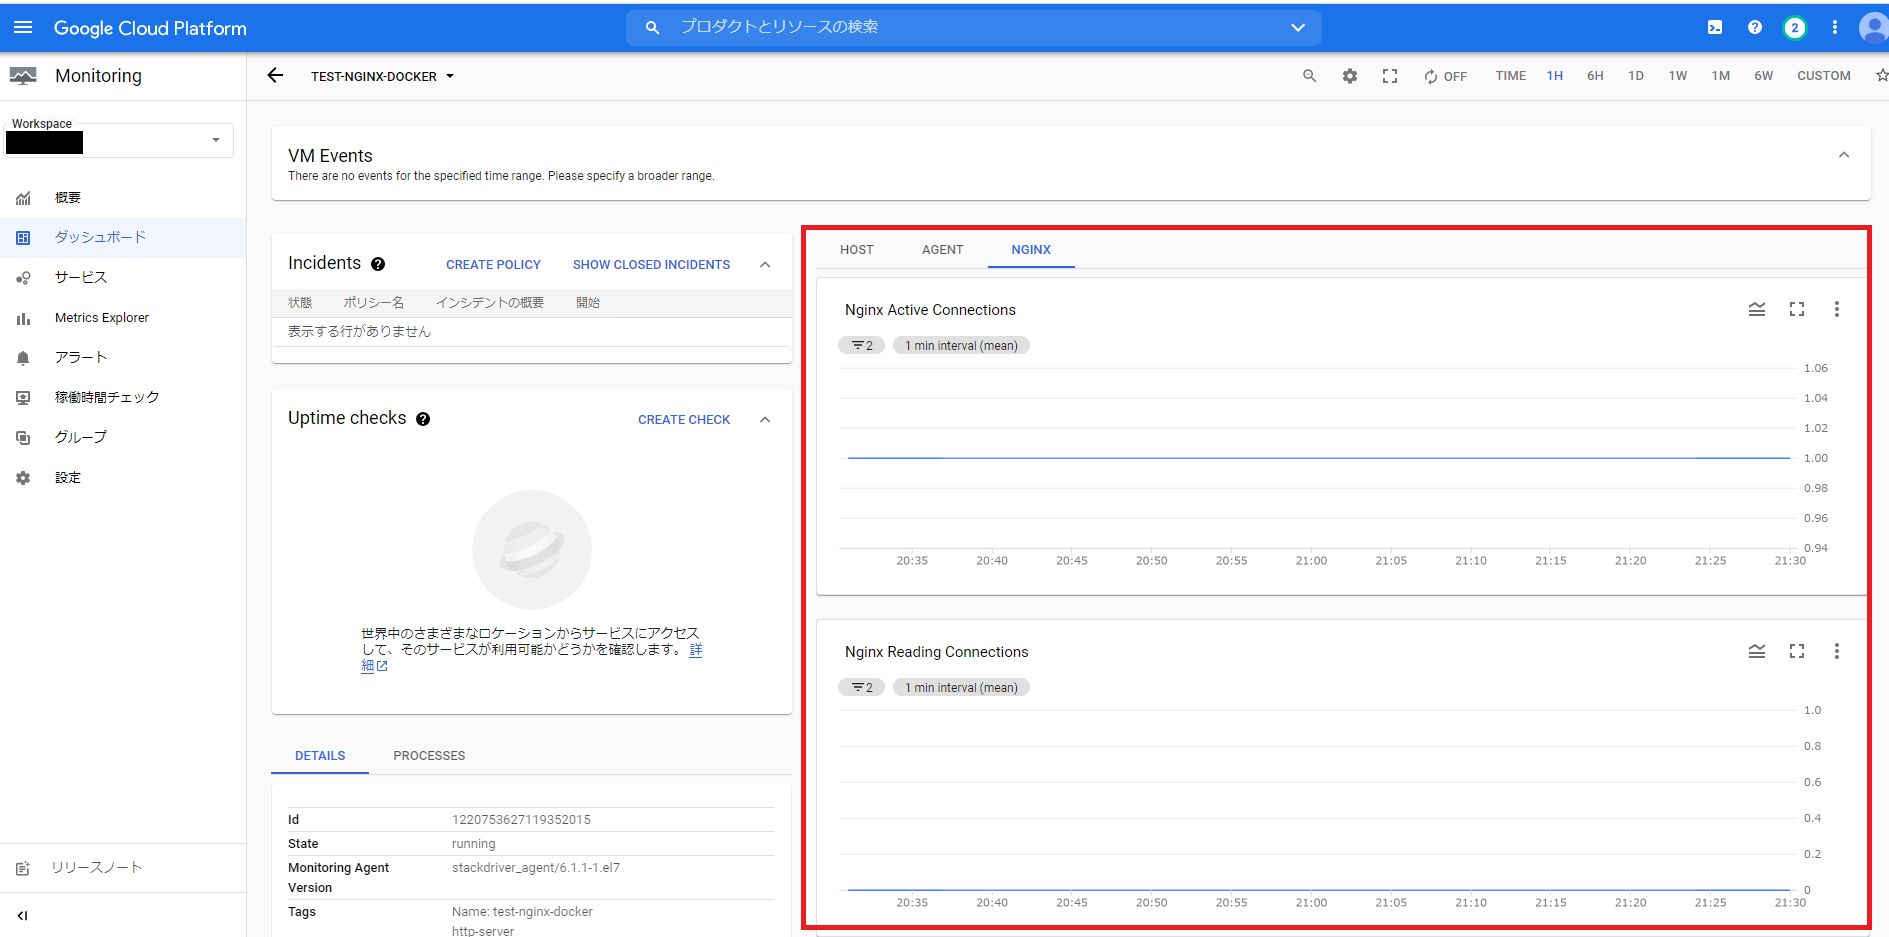
- GCPの
Monitoring > ダッシュボード > VM Instances > VM名をクリックします。正常に設定できていると、以下のようにNGINXタブがありますので、クリックする。- nginxへのコネクション数やリクエスト数が確認できます。
- nginxのエージェント指標を知りたい方は、このリンクを参照ください。
以上で、Cloud MonitoringでDockerコンテナ内のnginxを監視する設定は完了です。