前回pythonでptsファイルの中身をプロットしてみた
ちゃんと指定した点の形でプロットできたことを確認したが、、ここで問題発生!
実際に取得している点群とプロットした形が違うことが分かった
以下のコードで画像の保存が可能
main.py
import math
import matplotlib.pyplot as plt
fig = plt.figure()
for i in range(len(list_float_sorted)):
    for ii in range(1):
        plt.plot(float(list_float_sorted[i][ii]),float(list_float_sorted[i][ii+1]),marker='*')
plt.xlim(0,math.ceil(float(max(x_list))))
plt.ylim(0,math.ceil(float(max(y_list))))
plt.title('Title',fontsize=15)
plt.xlabel('X',fontsize=10)
plt.ylabel('Y',fontsize=10)
fig.savefig('plot.jpg')
保存したプロット画像
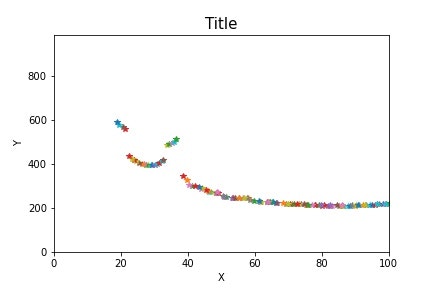
取得した点群情報
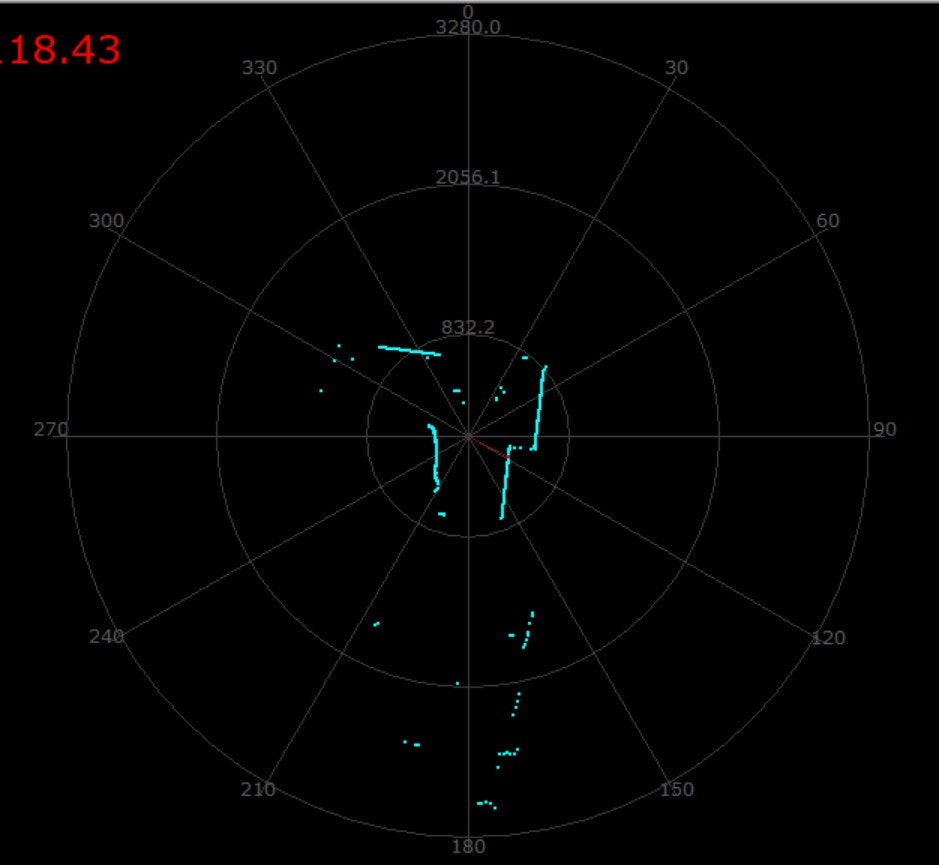
使用したアプリケーションはframe_grabberというもの
プロットしたものが点群の一部にないことが分かる
課題
点群情報を保存したptsファイルが何を意味しているのかを調べる必要がある