1. はじめに
ForiGate の監視を Microsoft Sentinel で取り込んで監視する方法なのですが、ドキュメントに AMA (Azure Monitor Agent) を用いた接続方法が記載されていないので、検証も含めて試してみました。
[遍歴]
- 2023.6.12 Linux 側 rsyslog の ntp 設定、rsyslog 書き込み設定削除を追記しました。
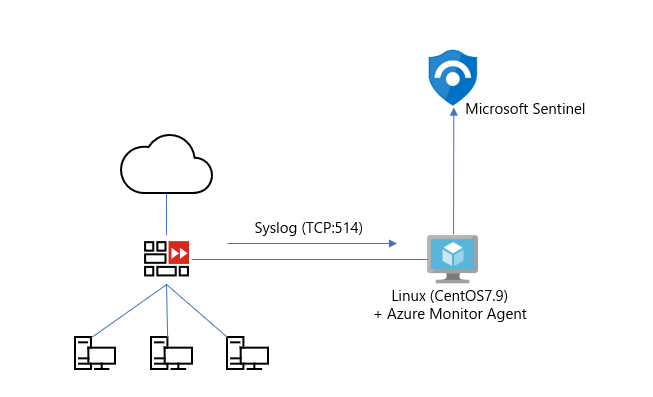
2. 構成
今回、Azure 上に FortiGate 仮想アプライアンスを建てて、Linux 仮想マシンに AMA (Azure Monitor Agent) を導入して実施しています。
2. 導入手順
事前環境として、以下が構成されているものとします。
- ForiGate アプライアンス
- Linux サーバー (物理/仮想/Azure VMなど)
- 物理/仮想環境の場合は、Azure Arc オンボーディングされていること
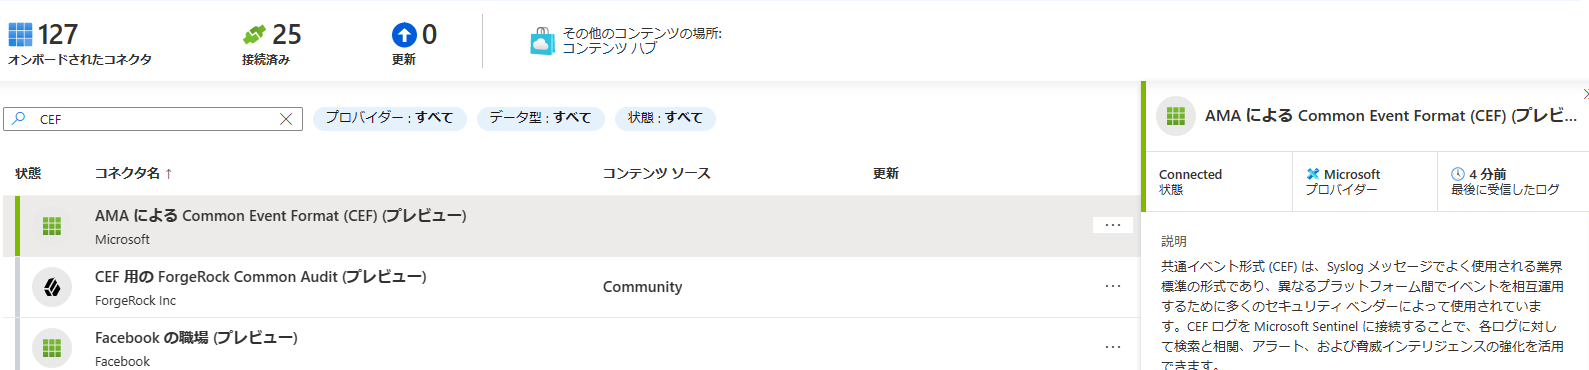
2.1 Sentinel - 「AMA による Common Event Format (CEF) コネクター」の設定
AMA による CEF コネクターは Microsoft Sentinel のコネクター設定より行います。
Microsoft Sentinel には FortiGate 用のコネクター設定が提供されているのですが、2024.8 に EoS となる MMA (Microsoft Monitoring Agent) の設定方式なので、こちらは用いません。
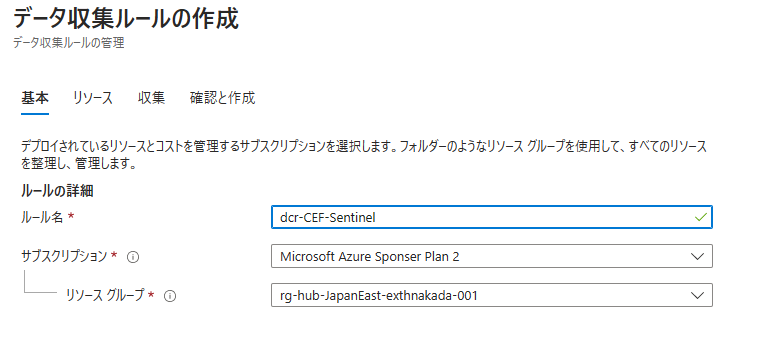
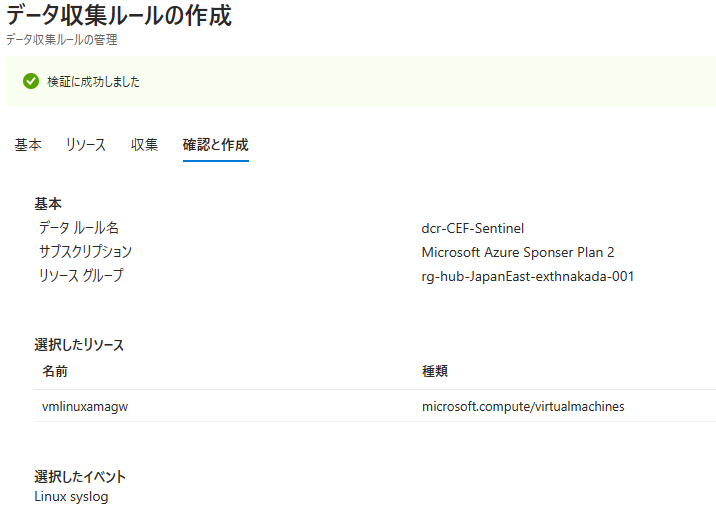
はじめにデータ収集ルールを作成します。
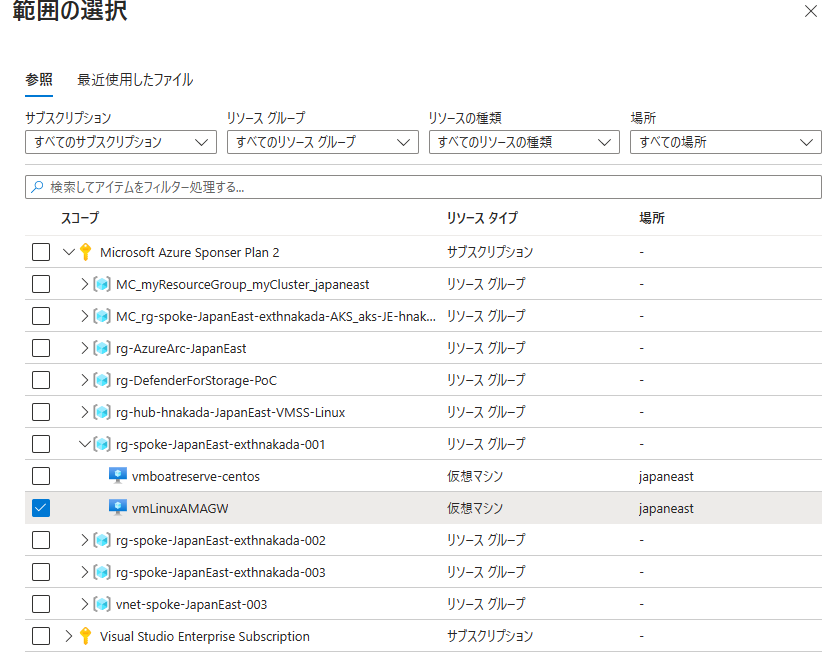
対象となるリソースより、AMA を導入する Linux を指定します。本設定を進めることで、対象のマシンに AMA が自動的に導入されます。
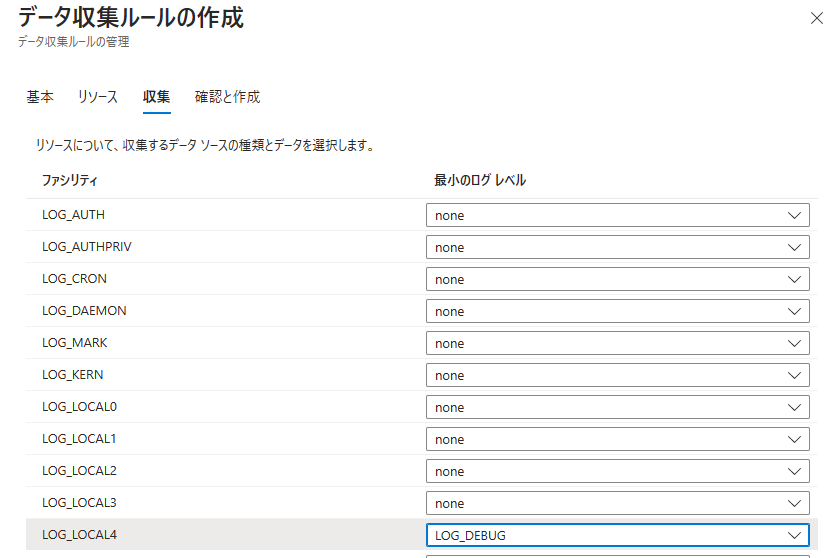
データ収集ルールの作成より、CEF で通知される syslog ファシリティを設定します。
今回は Syslog ファシリティとして LOG_LOCAL4 宛てに FortiGate アプライアンスが転送する設定としています。
最後に作成することで、Linux サーバーに AMA が導入され、Syslog ファシリティに対して Microsoft Sentinel の Log Analytics ワークスペースに転送する設定が完了となります。
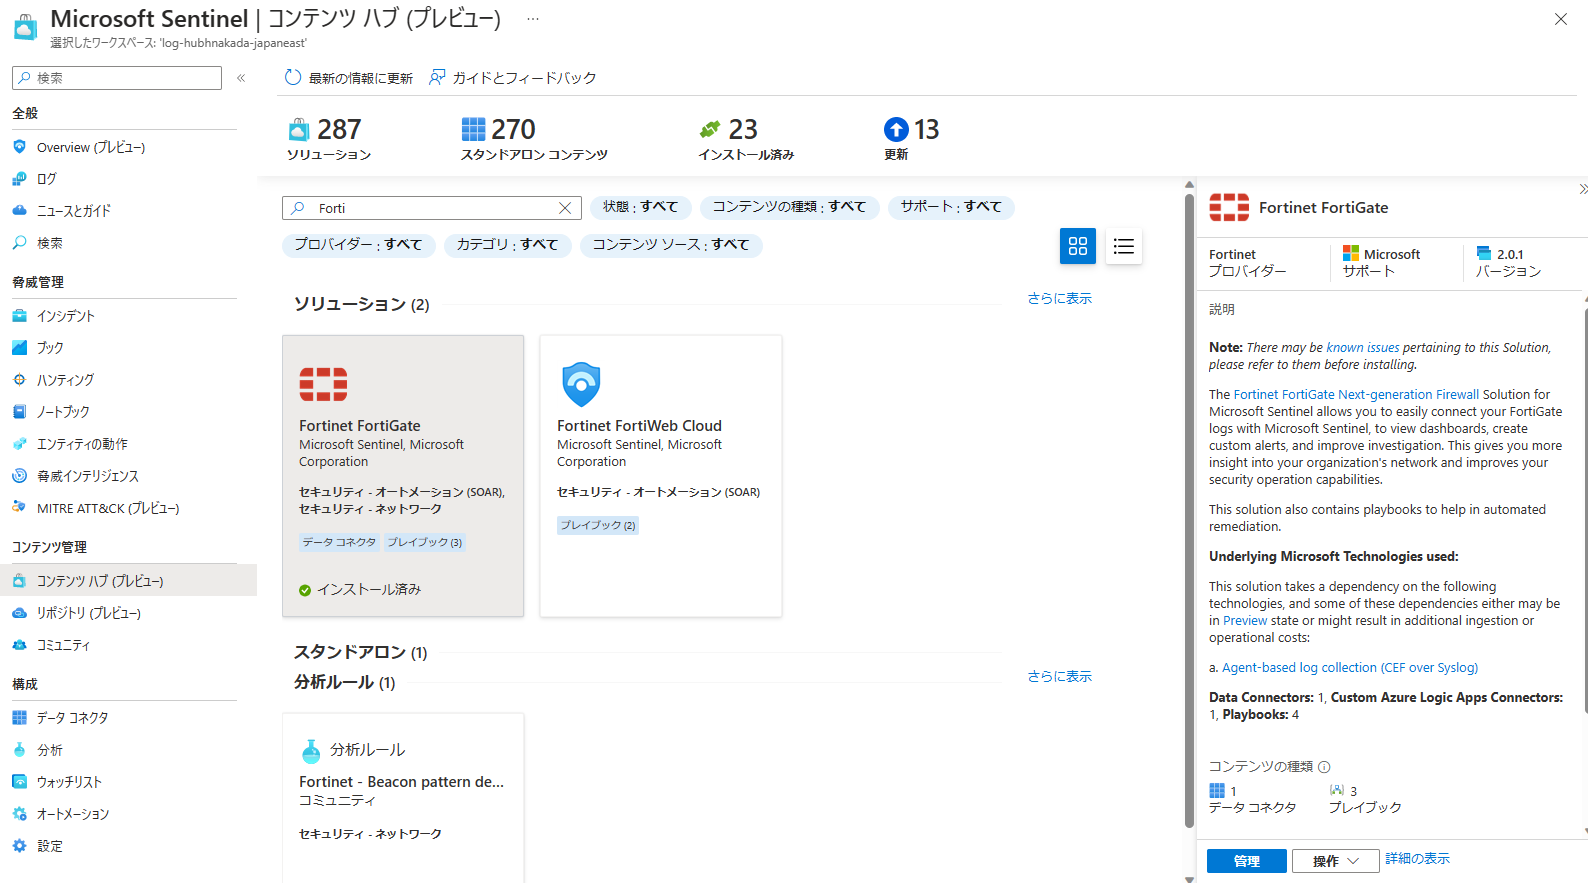
2.2 Sentinel - 「FortiGate」コンテンツパックのインストール
FortiGate CEF 形式のログを認識するデータコネクターと、FortiGate 用のプレイブックが提供されています。
コンテンツパックから導入を行います。
2.3 Linux 仮想マシン側 - selinux を無効にしておく
はじめに、selinux を停止させる必要があります。起動時に selinux 無効化になるように設定しておきましょう。
# vi /etc/selinux/config
SELINUX=disabled
2.4 Linux 仮想マシン側 - rsyslogd の有効化
次に Sentinel 画面に表示されているコマンドを Linux に適用して、rsyslogd を導入します。
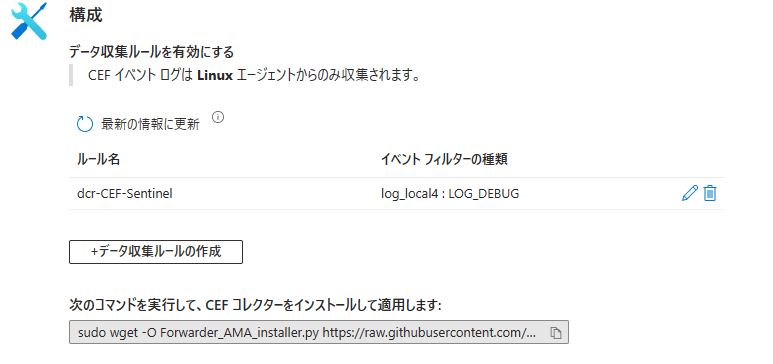
sudo wget -O Forwarder_AMA_installer.py https://raw.githubusercontent.com/Azure/Azure-Sentinel/master/DataConnectors/Syslog/Forwarder_AMA_installer.py&&sudo python Forwarder_AMA_installer.py
2.5 受信 syslog データのローカルファイル書き込みを削除する
AMA の受信サーバーを Syslog データの保管用途として用いない場合は、rsyslogd 側でローカルファイル (/var/log/messages など) に書き込みが行われないように留意する必要があります。デフォルトでは *.info の宣言内に全てのファシリティが含まれているため、/var/log/messages 内に syslog で受信したイベントの全てが書き込まれてしまいます。
以下は CentOS 7.9 /etc/rsyslog.conf の設定例です。
*.infoは書き込みを行いつつ、以降のlocal4.none の設定を rsyslog.conf に追加することで local4 ファシリティを none 指定で書き込まないように設定を加えています。Azure Monitor 側で rsyslog で受信するイベントは AMA Agent がちゃんと転送してくれるので、基本ローカルには保管しないようにしましょう。
また、出力先は - を定義することで非同期モードに設定しています。
# Log anything (except mail) of level info or higher.
# Don't log private authentication messages!
#*.info;mail.none;authpriv.none;cron.none                /var/log/messages
*.info;local4.none;mail.none;authpriv.none;cron.none-/var/log/messages
Ubuntu Linux の場合は以下公式 Docs に記載がありますので参考として下さい。
rsyslog.conf の書き方については、以下のブログが分かりやすかったです。
2.6 JST で受信するログの場合は Linux の timezone を JST に変更する
Azure Monitor Agent では Linux OS の timezone を判定して Azure 側へ転送しているようです。
FortiGate アプライアンス側が JST の時刻で設定している場合は、Azure Monitor 側の時刻を JST に設定することで、Azure 基盤側では UTC 表示で全体と合わせて管理することが出来ます。
もし海外拠点などで複数の timezone が異なるアプライアンスを有している場合は、timezone 毎の AMA Gateway を用意するのが良さそうです。
[root@vmlinuxamagw2 events]# timedatectl set-timezone Asia/Tokyo
[root@vmlinuxamagw2 events]# timedatectl status
      Local time: Mon 2023-06-12 09:35:49 JST
  Universal time: Mon 2023-06-12 00:35:49 UTC
        RTC time: Mon 2023-06-12 00:35:49
       Time zone: Asia/Tokyo (JST, +0900)
     NTP enabled: yes
NTP synchronized: yes
 RTC in local TZ: no
      DST active: n/a
2.7 (オプション) journald / rsyslog のチューニング
CentOS/RHEL 7 以降から、syslog が systemd 方式になっているのですが、デフォルトの設定値では大量のログが発生した場合は、記録できず溢れてしまう状況が発生します。journald がプロセスのメッセージを収集する際にデフォルトの設定が 30 秒で 10,000 イベントに制約されているのが原因になっています。対象の Syslog 受信を設計する場合は以下チューニングを行います。
-
/etc/systemd/journald.conf設定- [before] ※30秒間に10000件転送という制限値になっている
 #RateLimitIntervalSec=30s
 #RateLimitBurst=10000
- [after] ※無制限に変更する
 RateLimitIntervalSec=0
 RateLimitBurst=0
-
/etc/rsyslog.confの修正- 以下パラメータの追加
 $imjournalRatelimitInterval 0
 $imjournalRatelimitBurst 0
以下ブログに詳しい内容を紹介いただいている方々がいらっしゃったので、転記しておきます。
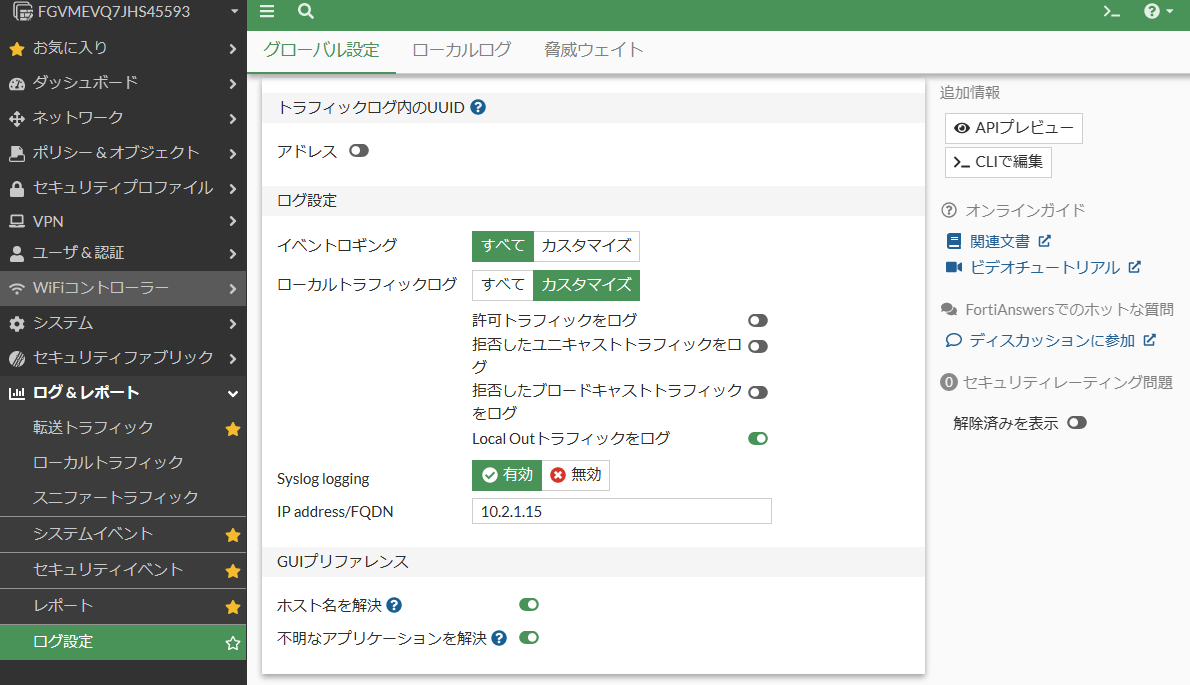
2.8 FortiGate アプライアンス - Syslog 転送設定
上記設定が完了したので、FotiGate 側から Syslog 転送設定を行います。
2.1 で設定した syslog ファシリティで設定しています。
config log syslogd setting
set status enable
set format cef
set port 514
set server <ip_address_of_Forwarder>
set mode reliable
set facility local4
end
FortiGate の GUI からは Syslog が有効になった情報だけ見れるようです。
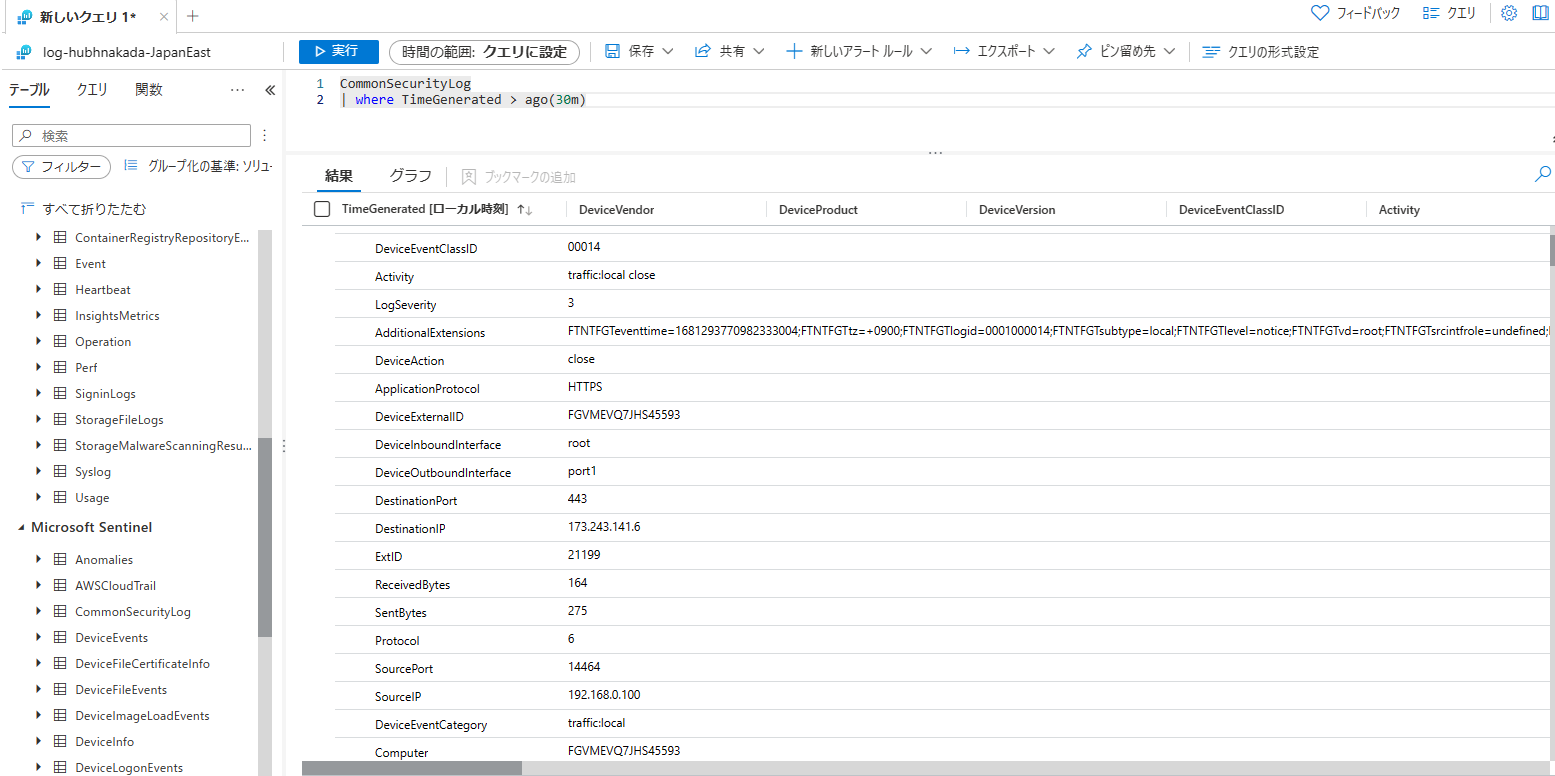
3. データの確認
3.1 ログ形式
CEF 形式で Syslog 転送が行われると、Microsoft Sentinel カテゴリに CommonSecurityLog が取り込まれるのが分かります。
3.2 FortiGate ブック
CEF 形式による取り込みで正規化が行われているため、テンプレートの可視化ブックが使えるようになります。


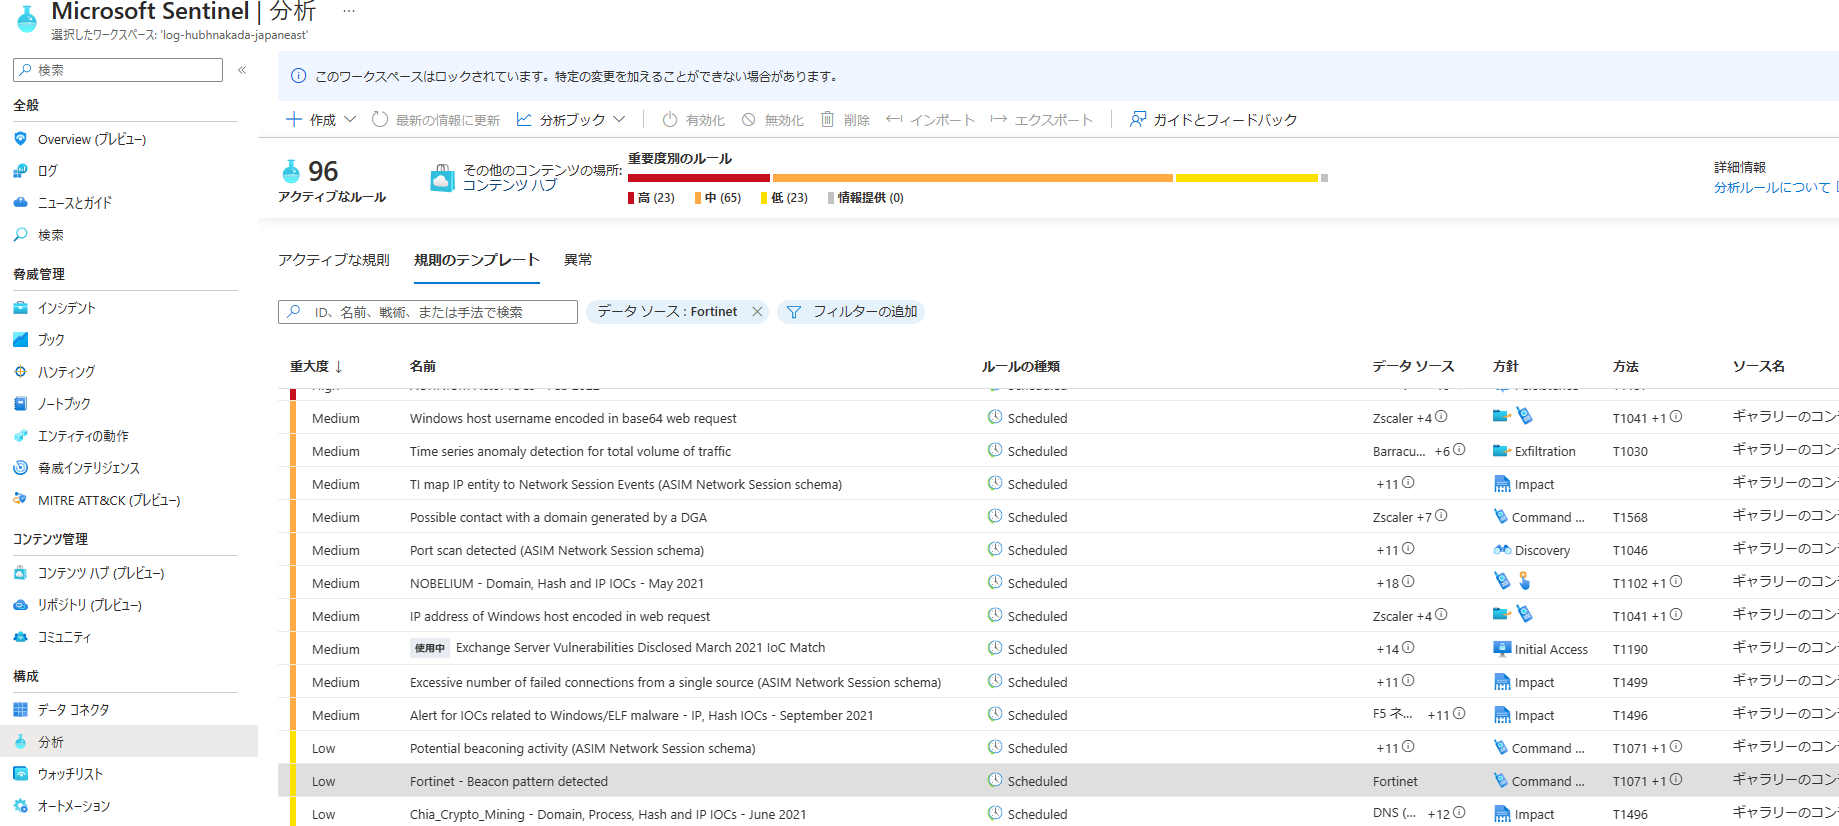
3.3 FortiGate に対応した分析ルール
テンプレートの分析ルールで FortiGate のログに対応したものが幾つか用意されています。
多くは IP アドレスで TI (Threat Intelligence) と連携するルールが多いように見受けられます。
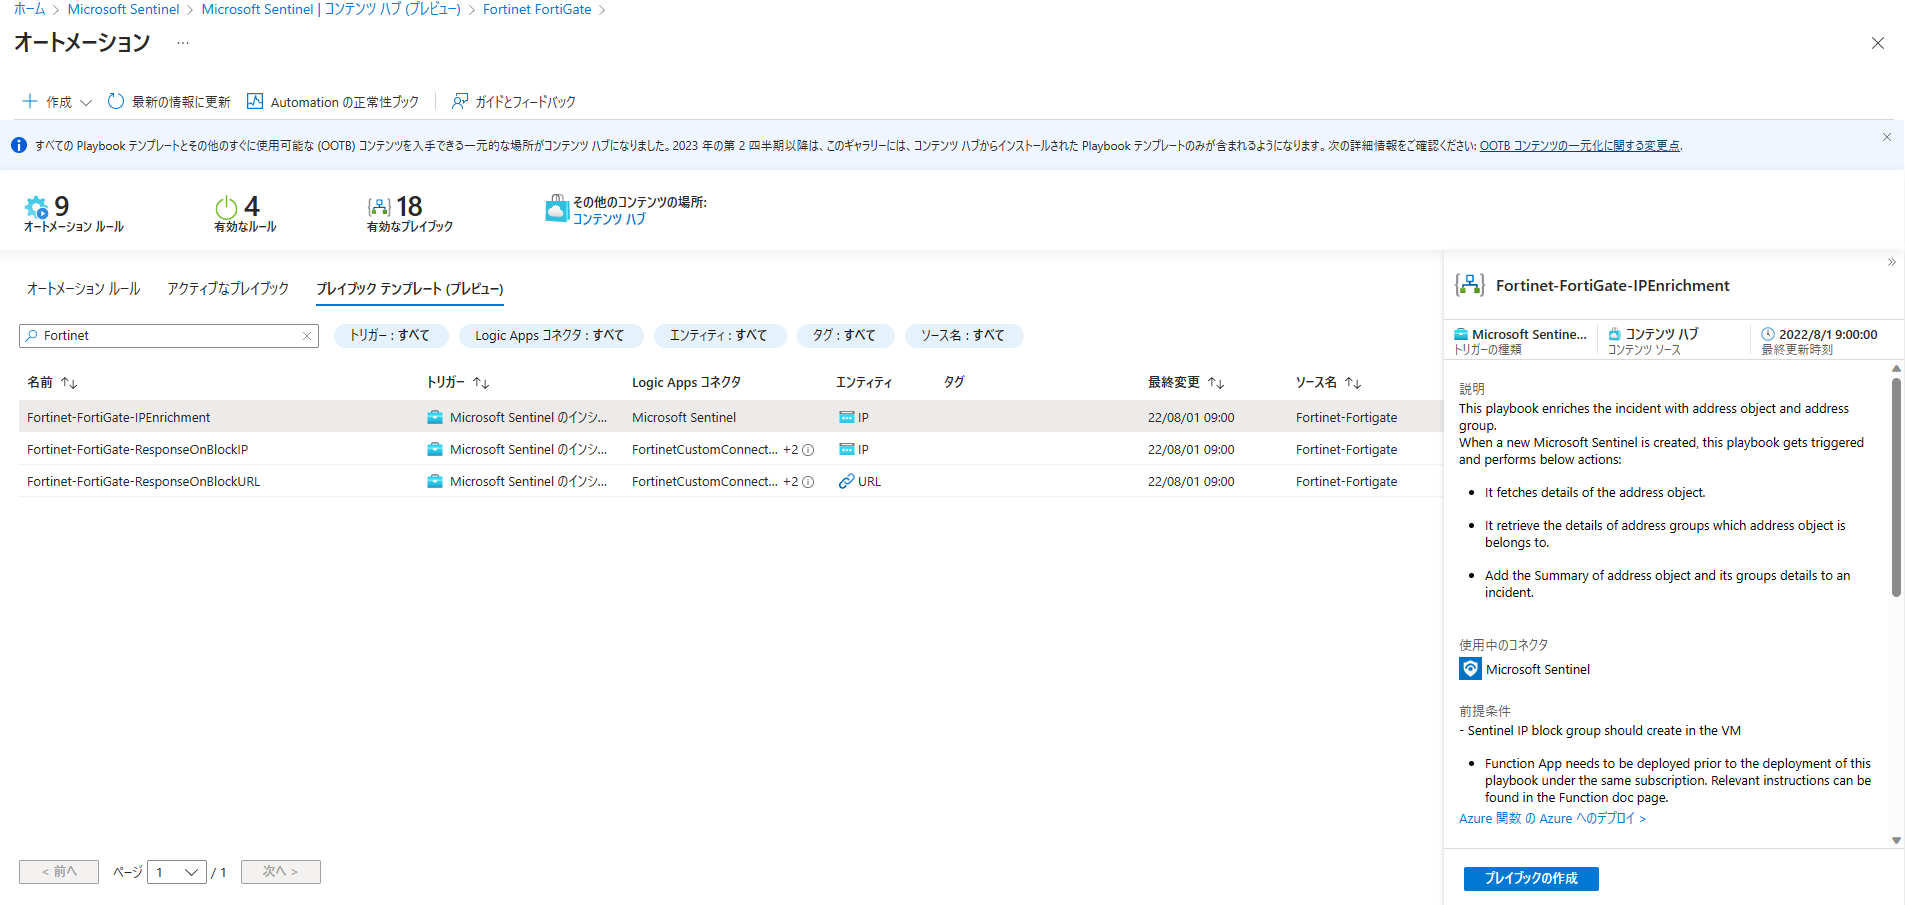
3.3 オートメーション
前述のコンテンツパックを導入することで、インシデント検知時に ForitGate アプライアンスに対して自動化を行うテンプレートが使えるようになります。
- Fortinet-FortiGate-IPEnrichment
- Fortinet-FortiGate-ResponseOnBlockIP
- Fortinet-FortiGate-ResponseOnBlockURL
4. トラブルシューティング
FortiGate からの CEF ログがうまく取り込めない場合は、Linux 側でトラブルシューティングを実施してみましょう。
4.1 rsyslogd 動いているかどうかをチェックする
[root@vmlinuxamagw ~]# netstat -lnptv
Active Internet connections (only servers)
Proto Recv-Q Send-Q Local Address           Foreign Address         State       PID/Program name
tcp        0      0 0.0.0.0:111             0.0.0.0:*               LISTEN      701/rpcbind
tcp        0      0 127.0.0.1:12563         0.0.0.0:*               LISTEN      685/amacoreagent
tcp        0      0 0.0.0.0:22              0.0.0.0:*               LISTEN      2882/sshd
tcp        0      0 127.0.0.1:25            0.0.0.0:*               LISTEN      2565/master
tcp        0      0 0.0.0.0:514             0.0.0.0:*               LISTEN      6373/rsyslogd
tcp        0      0 127.0.0.1:28130         0.0.0.0:*               LISTEN      775/mdsd
tcp        0      0 127.0.0.1:28230         0.0.0.0:*               LISTEN      775/mdsd
tcp        0      0 127.0.0.1:13000         0.0.0.0:*               LISTEN      685/amacoreagent
tcp6       0      0 :::111                  :::*                    LISTEN      701/rpcbind
tcp6       0      0 :::22                   :::*                    LISTEN      2882/sshd
tcp6       0      0 ::1:25                  :::*                    LISTEN      2565/master
tcp6       0      0 :::514                  :::*                    LISTEN      6373/rsyslogd
4.2 トラブルシューティング用専用コマンドを動かす
こちらは Microsoft Sentinel の AMA / CEF データコネクタに記載があります。
コマンドを打つと、以下のような Daemon のチェックや DCR が設定されているか (CEF 形式の DCR になっているか)、CEF イベントは実際に飛んでいるかなどを確認することが出来るようになっています。
[root@vmlinuxamagw ~]# sudo wget -O cef_AMA_troubleshoot.py https://raw.githubusercontent.com/Azure/Azure-Sentinel/master/DataConnectors/CEF/cef_AMA_troubleshoot.py&&sudo python cef_AMA_troubleshoot.py
--2023-04-12 18:28:25--  https://raw.githubusercontent.com/Azure/Azure-Sentinel/master/DataConnectors/CEF/cef_AMA_troubleshoot.py
Resolving raw.githubusercontent.com (raw.githubusercontent.com)... 185.199.111.133, 185.199.108.133, 185.199.109.133, ...
Connecting to raw.githubusercontent.com (raw.githubusercontent.com)|185.199.111.133|:443... connected.
HTTP request sent, awaiting response... 200 OK
Length: 42874 (42K) [text/plain]
Saving to: ‘cef_AMA_troubleshoot.py’

100%[==================================================================================================>] 42,874      --.-K/s   in 0.002s

2023-04-12 18:28:26 (19.3 MB/s) - ‘cef_AMA_troubleshoot.py’ saved [42874/42874]


Starting to run the CEF validation script
Please validate you are sending CEF messages to the agent machine

----- Starting validation tests for AMA ---------------------------
verify_ama_agent_service_is_running------------> Success
Detected AMA running version- 1.25.2
verify_oms_agent_not_running-------------------> Success

----- Starting validation tests for data collection rules ---------
verify_DCR_exists------------------------------> Success
verify_DCR_content_has_CEF_stream--------------> Success
verify_CEF_dcr_has_valid_content---------------> Success
check_cef_multi_homing-------------------------> Success

----- Starting validation tests for the Syslog daemon -------------
verify_Syslog_daemon_listening-----------------> Success
verify_Syslog_daemon_forwarding_configuration--> Success

----- Starting validation tests for the operating system ----------
verify_selinux_disabled------------------------> Success
verify_iptables_policy_permissive--------------> Success
verify_iptables_rules_permissive---------------> Success
verify_free_disk_space-------------------------> Success

----- Starting validation tests for capturing incoming events -----
Attempting to capture CEF events using tcpdump. This could take up to 10 seconds.
listen_to_incoming_cef_events------------------> Success
Found CEF events in stream. Please verify CEF events arrived at your workspace
All tests passed successfully
This script generated an output file located here - /tmp/cef_troubleshooter_output_file.log
Please review it if you would like to get more information on failed tests.

If you would like to open a support case please run this script with the 'collect' feature flag in order to collect additional system data for troubleshooting.'python cef_AMA_troubleshoot.py collect'
5. まとめ
以上、FortiGate を Azure Monitor Agent を用いて CEF 形式で取り込む設定例でした。
本記事がどなたかの参考になれば幸いです。
*本稿は、個人の見解に基づいた内容であり、所属する会社の公式見解ではありません。また、いかなる保証を与えるものでもありません。正式な情報は、各製品の販売元にご確認ください。