はじめに
seabornのヒートマップの使い方をまとめました。
記事タイトルは相変わらずコピーメカに考えてもらってます。
母はヒートマップを暖房器具か何かだと思っているのかな?
seaborn ヒートマップの使い方
今回はseabornのflightsというデータを使っていきます。
import seaborn as sns; sns.set()
import pandas as pd
flights = sns.load_dataset("flights")
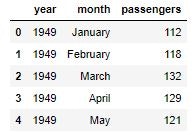
display(flights.head())
※年月毎に乗客数があるだけのシンプルなデータです。
基本
%matplotlib inline
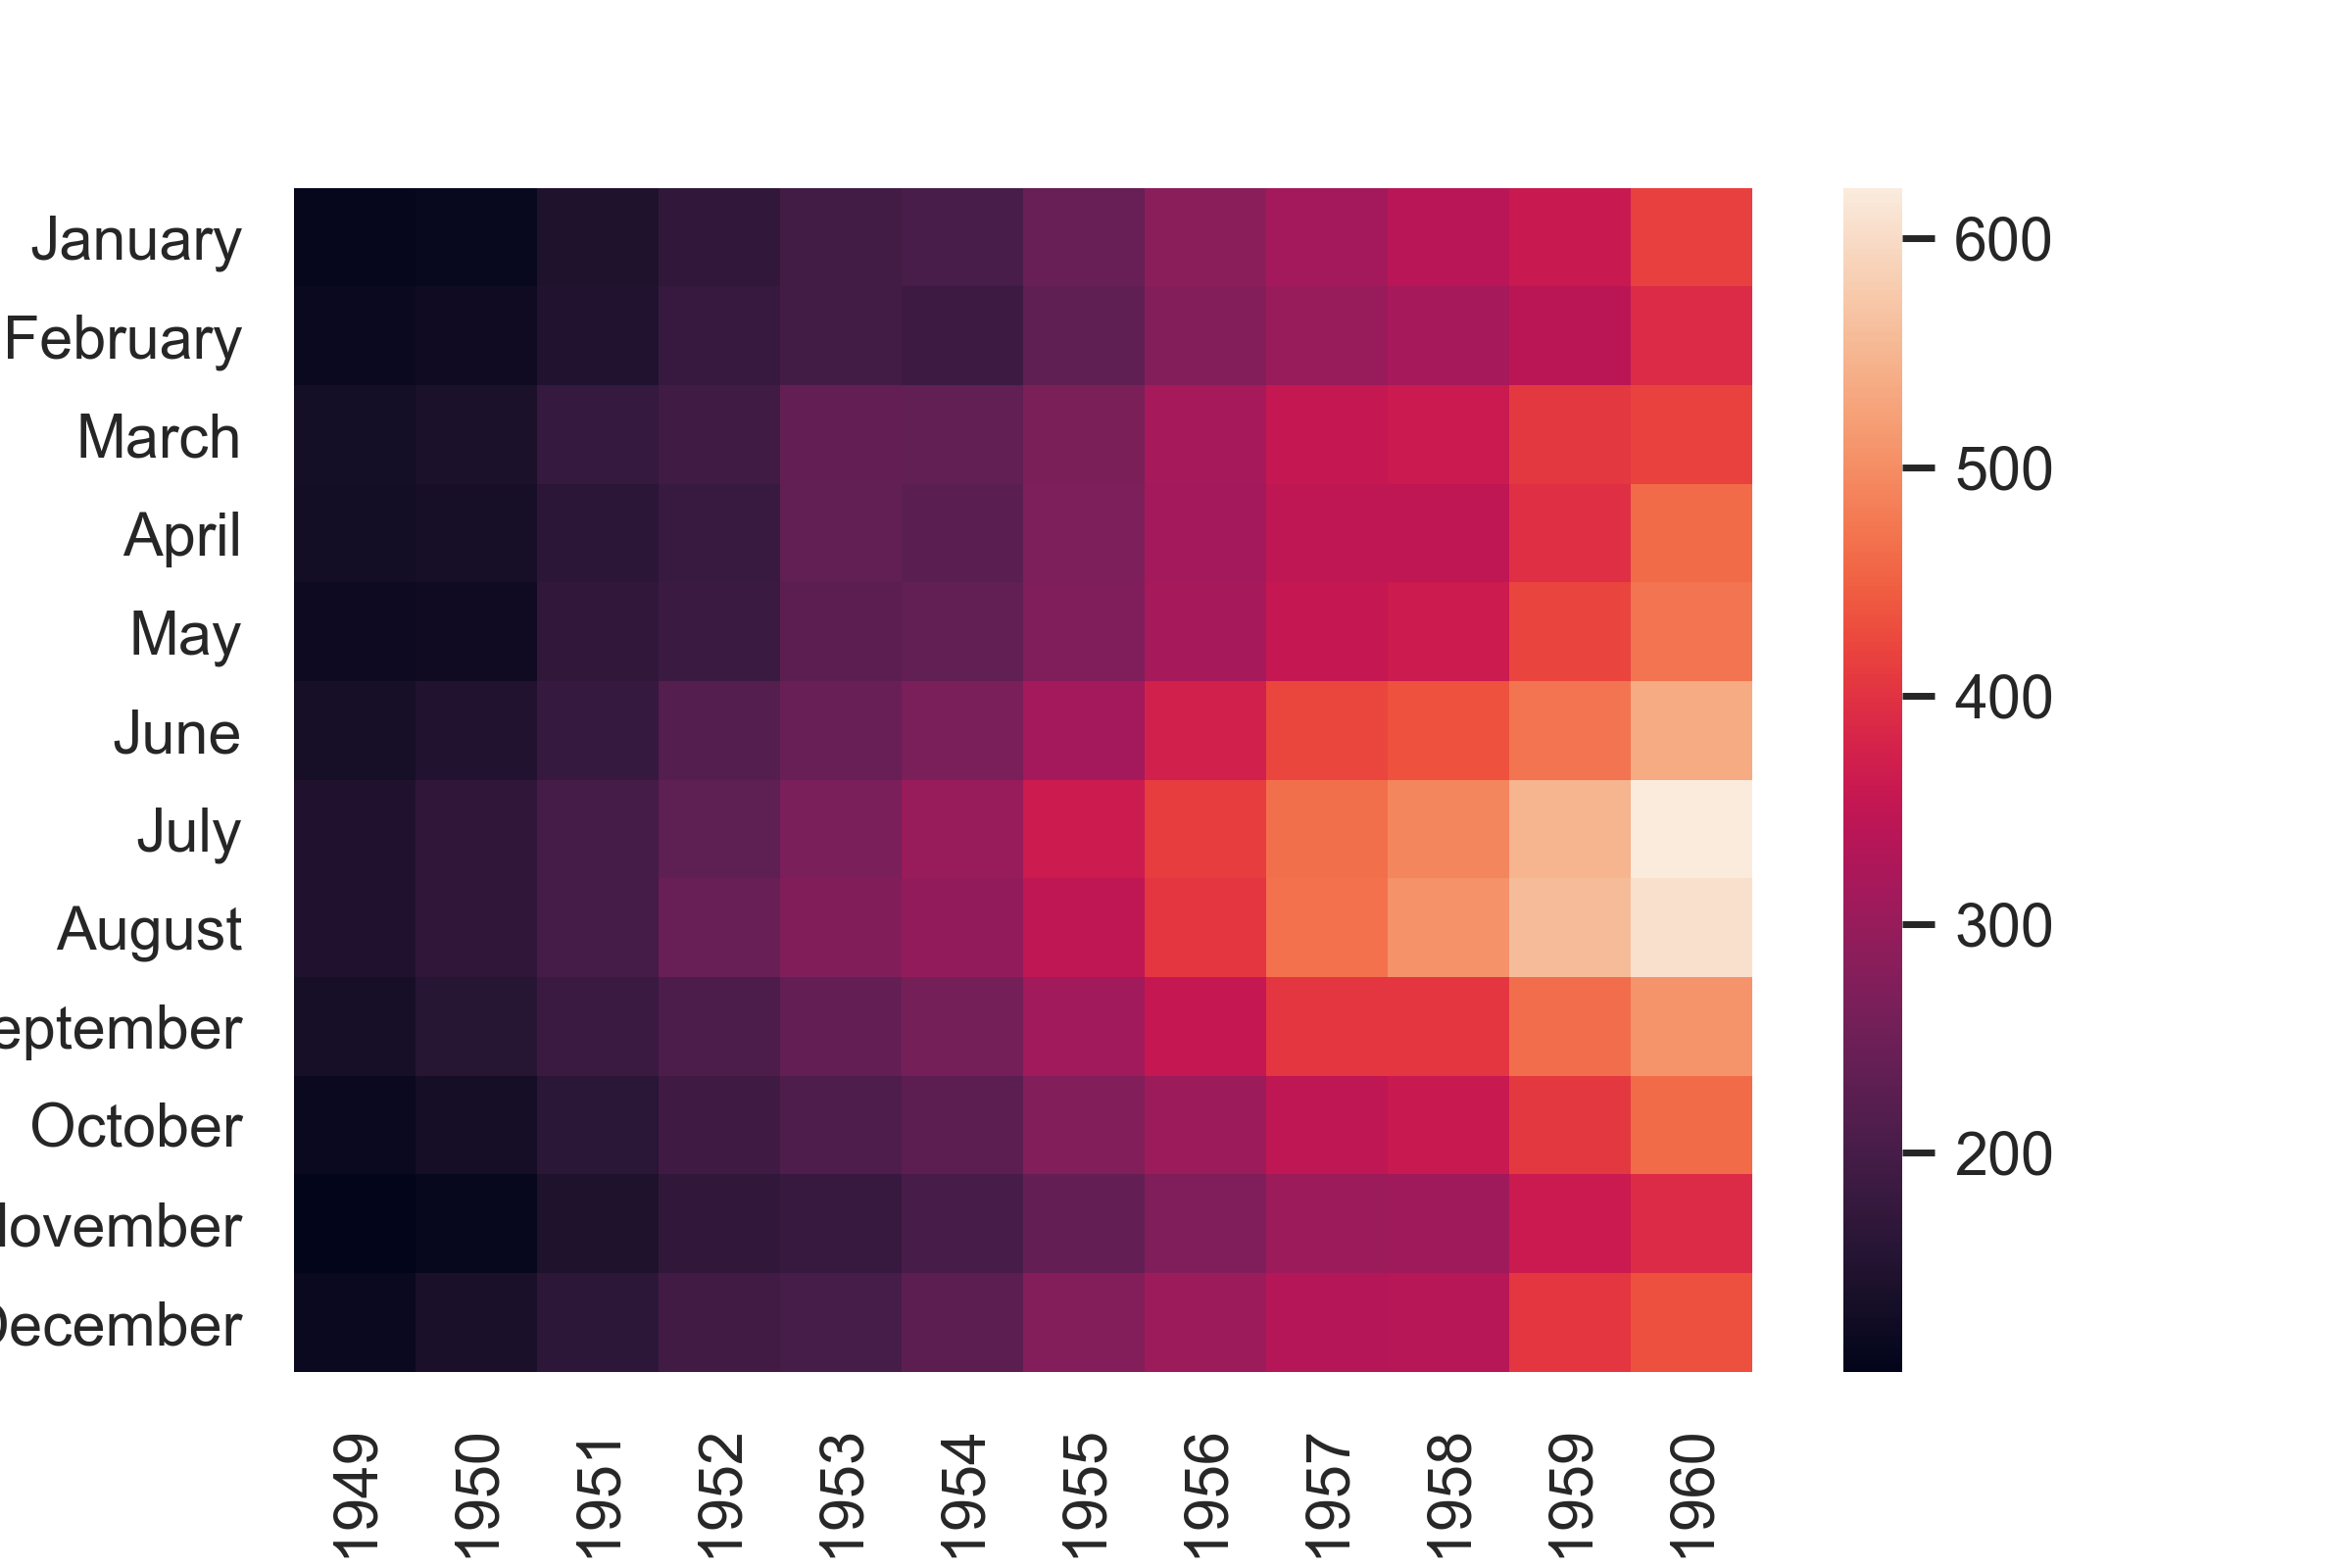
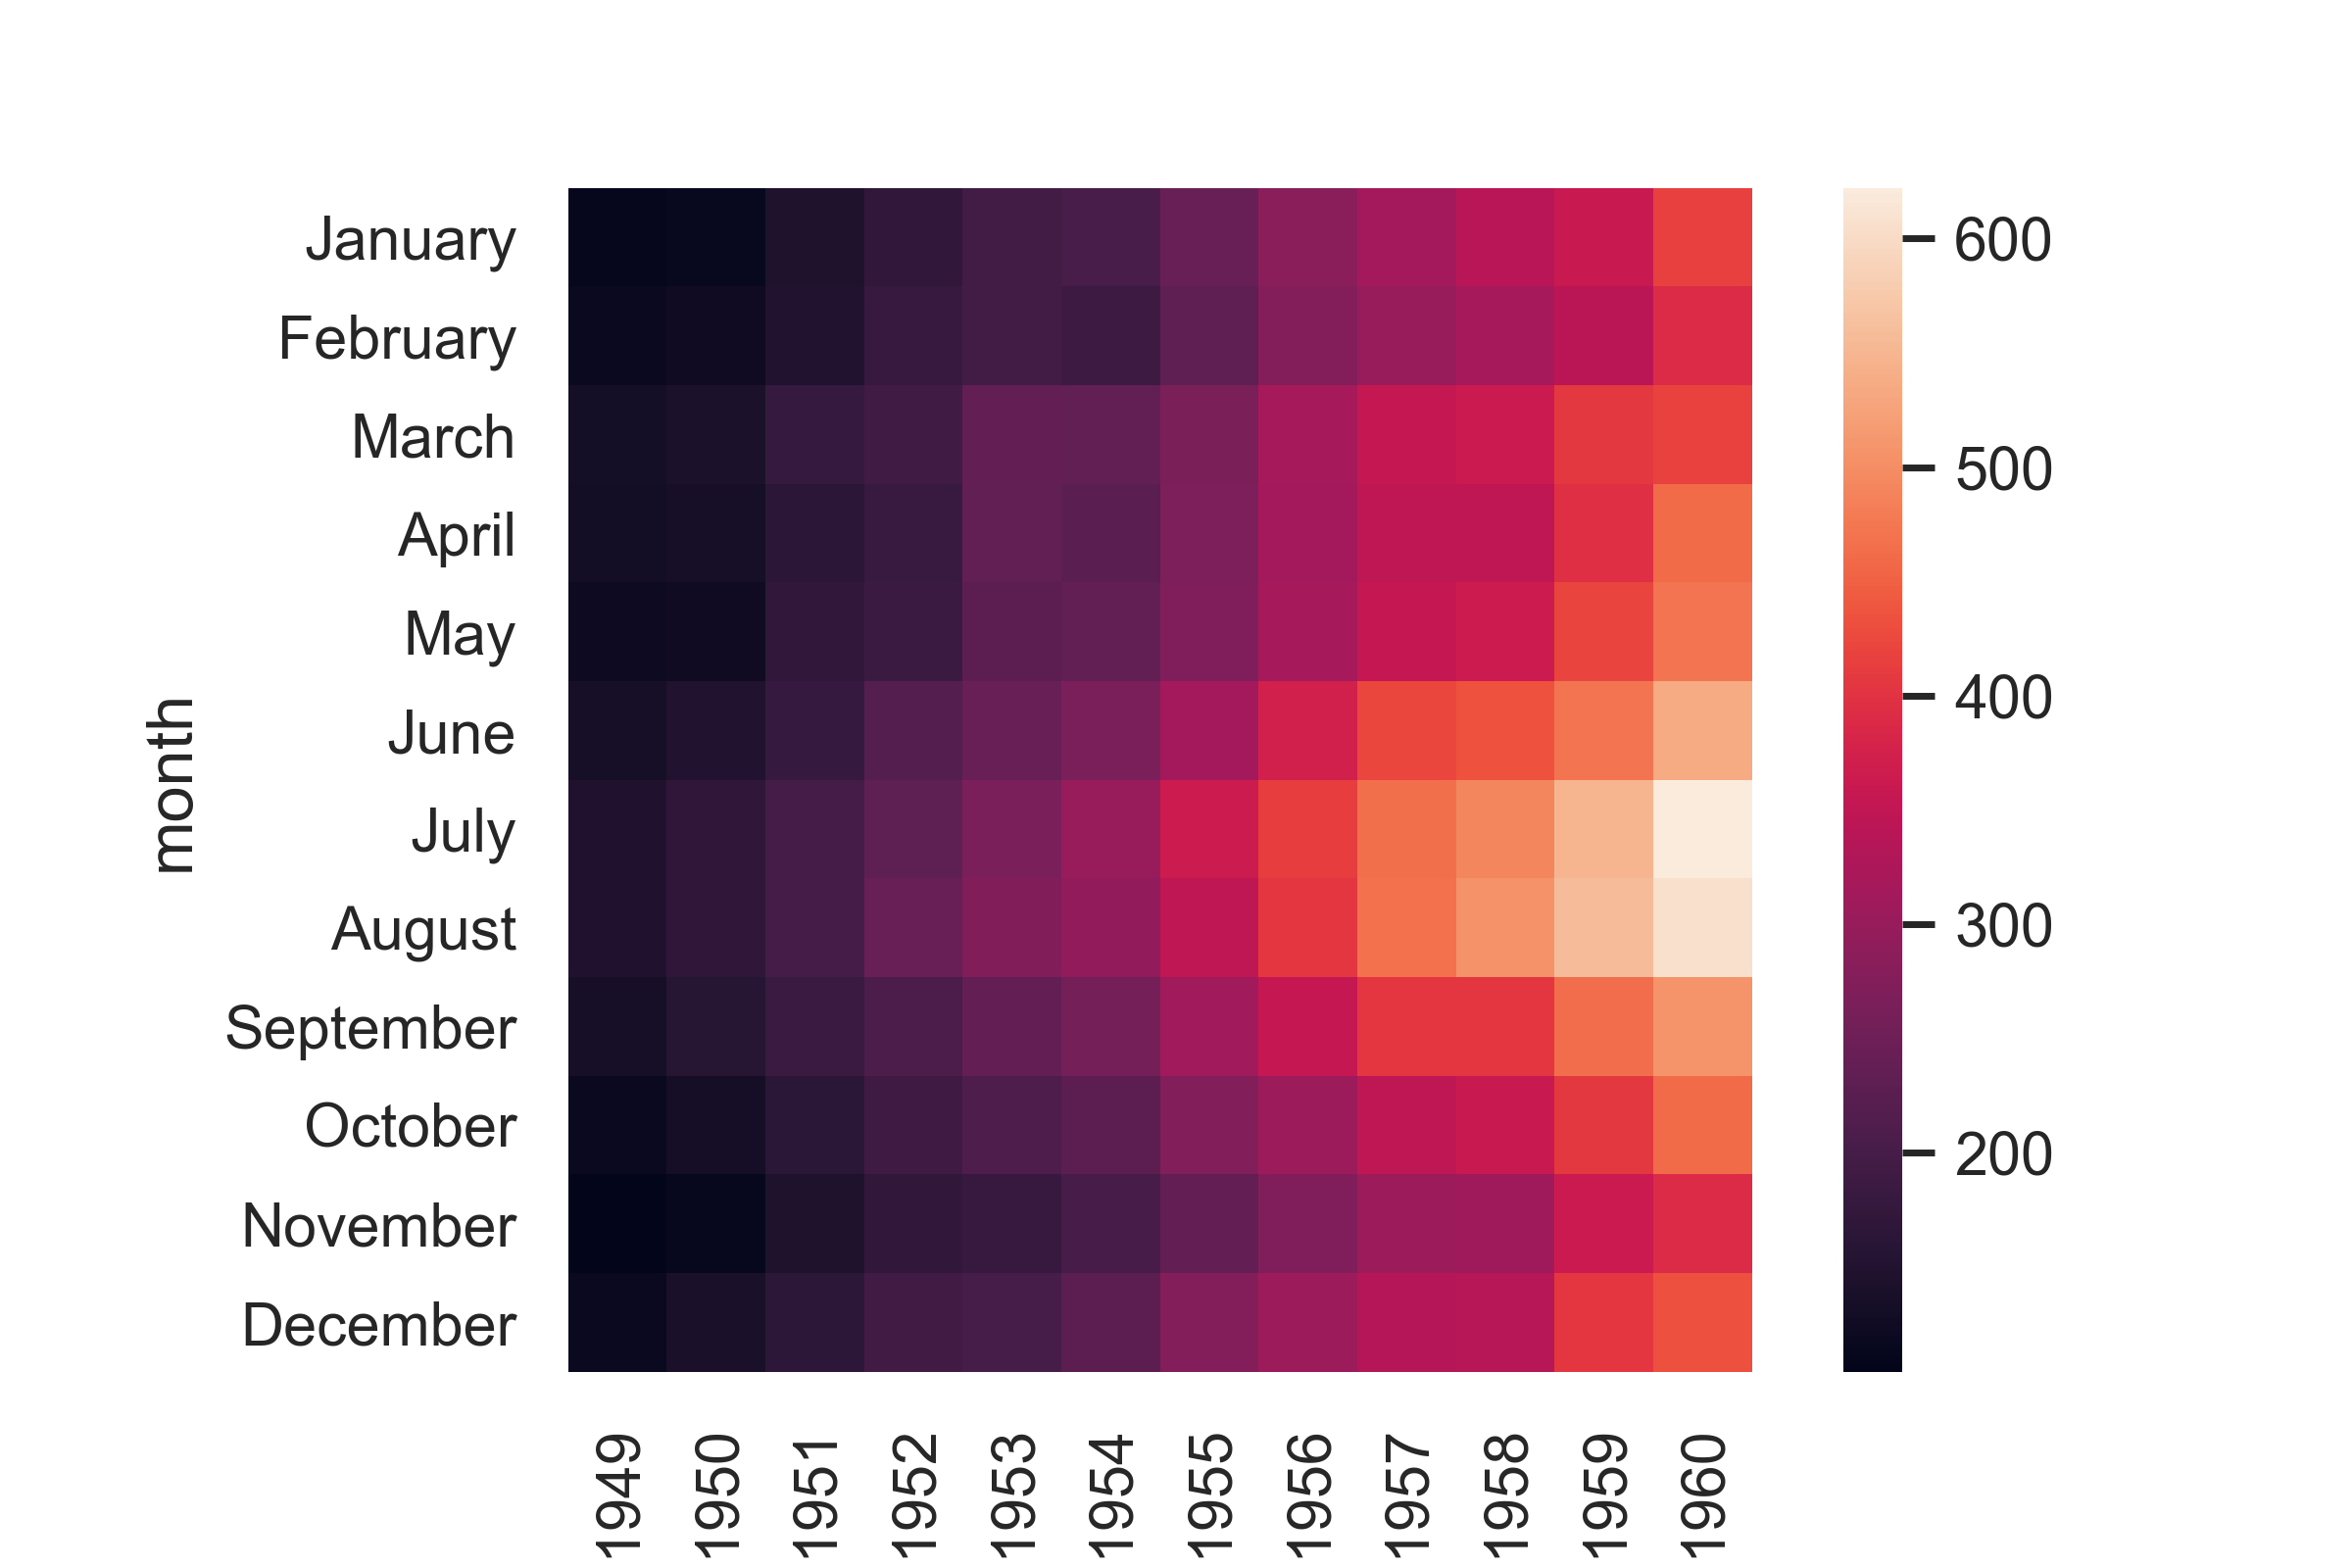
flights = flights.pivot("month", "year", "passengers")
heatmap = sns.heatmap(flights)
セル内に数値表示 : annot
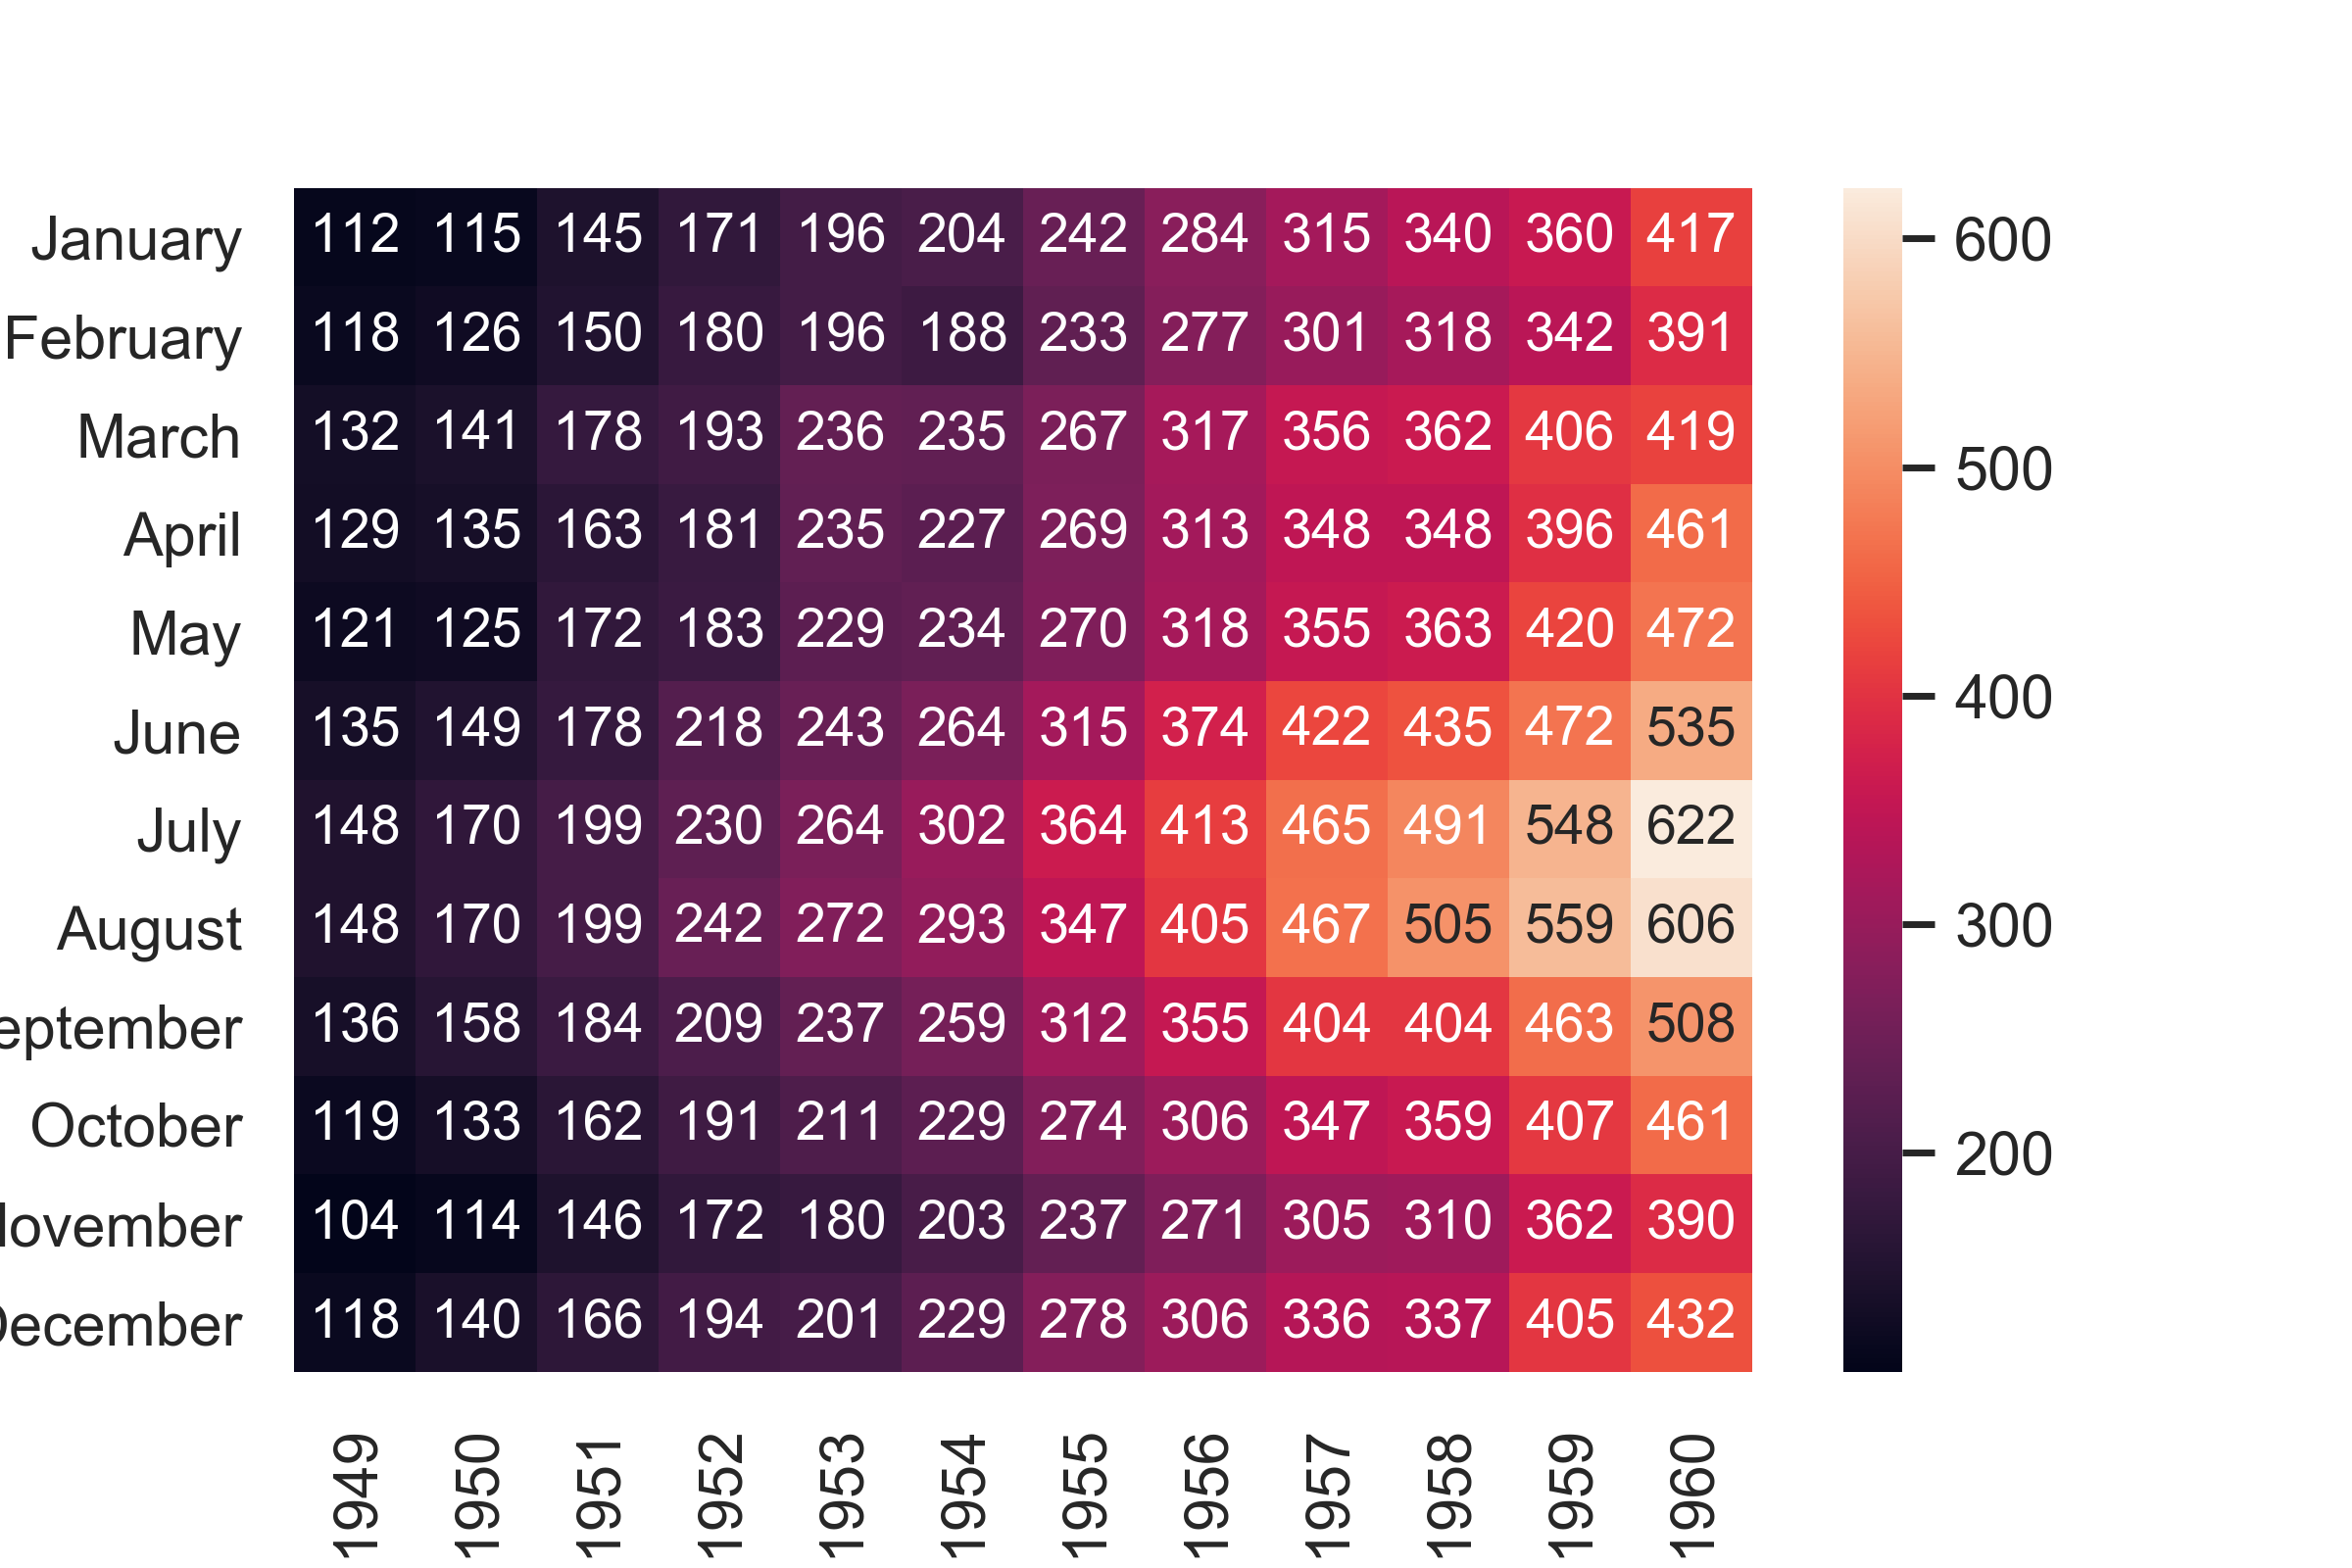
annot=Trueを指定すると、セル内に値が表示される。
fmtはannotを追加する際の文字列のフォーマット
少数1桁まではfmt=".1f"
少数2桁まではfmt=".2f"
整数ではfmt="d"
heatmap = sns.heatmap(flights,annot=True,fmt="d")
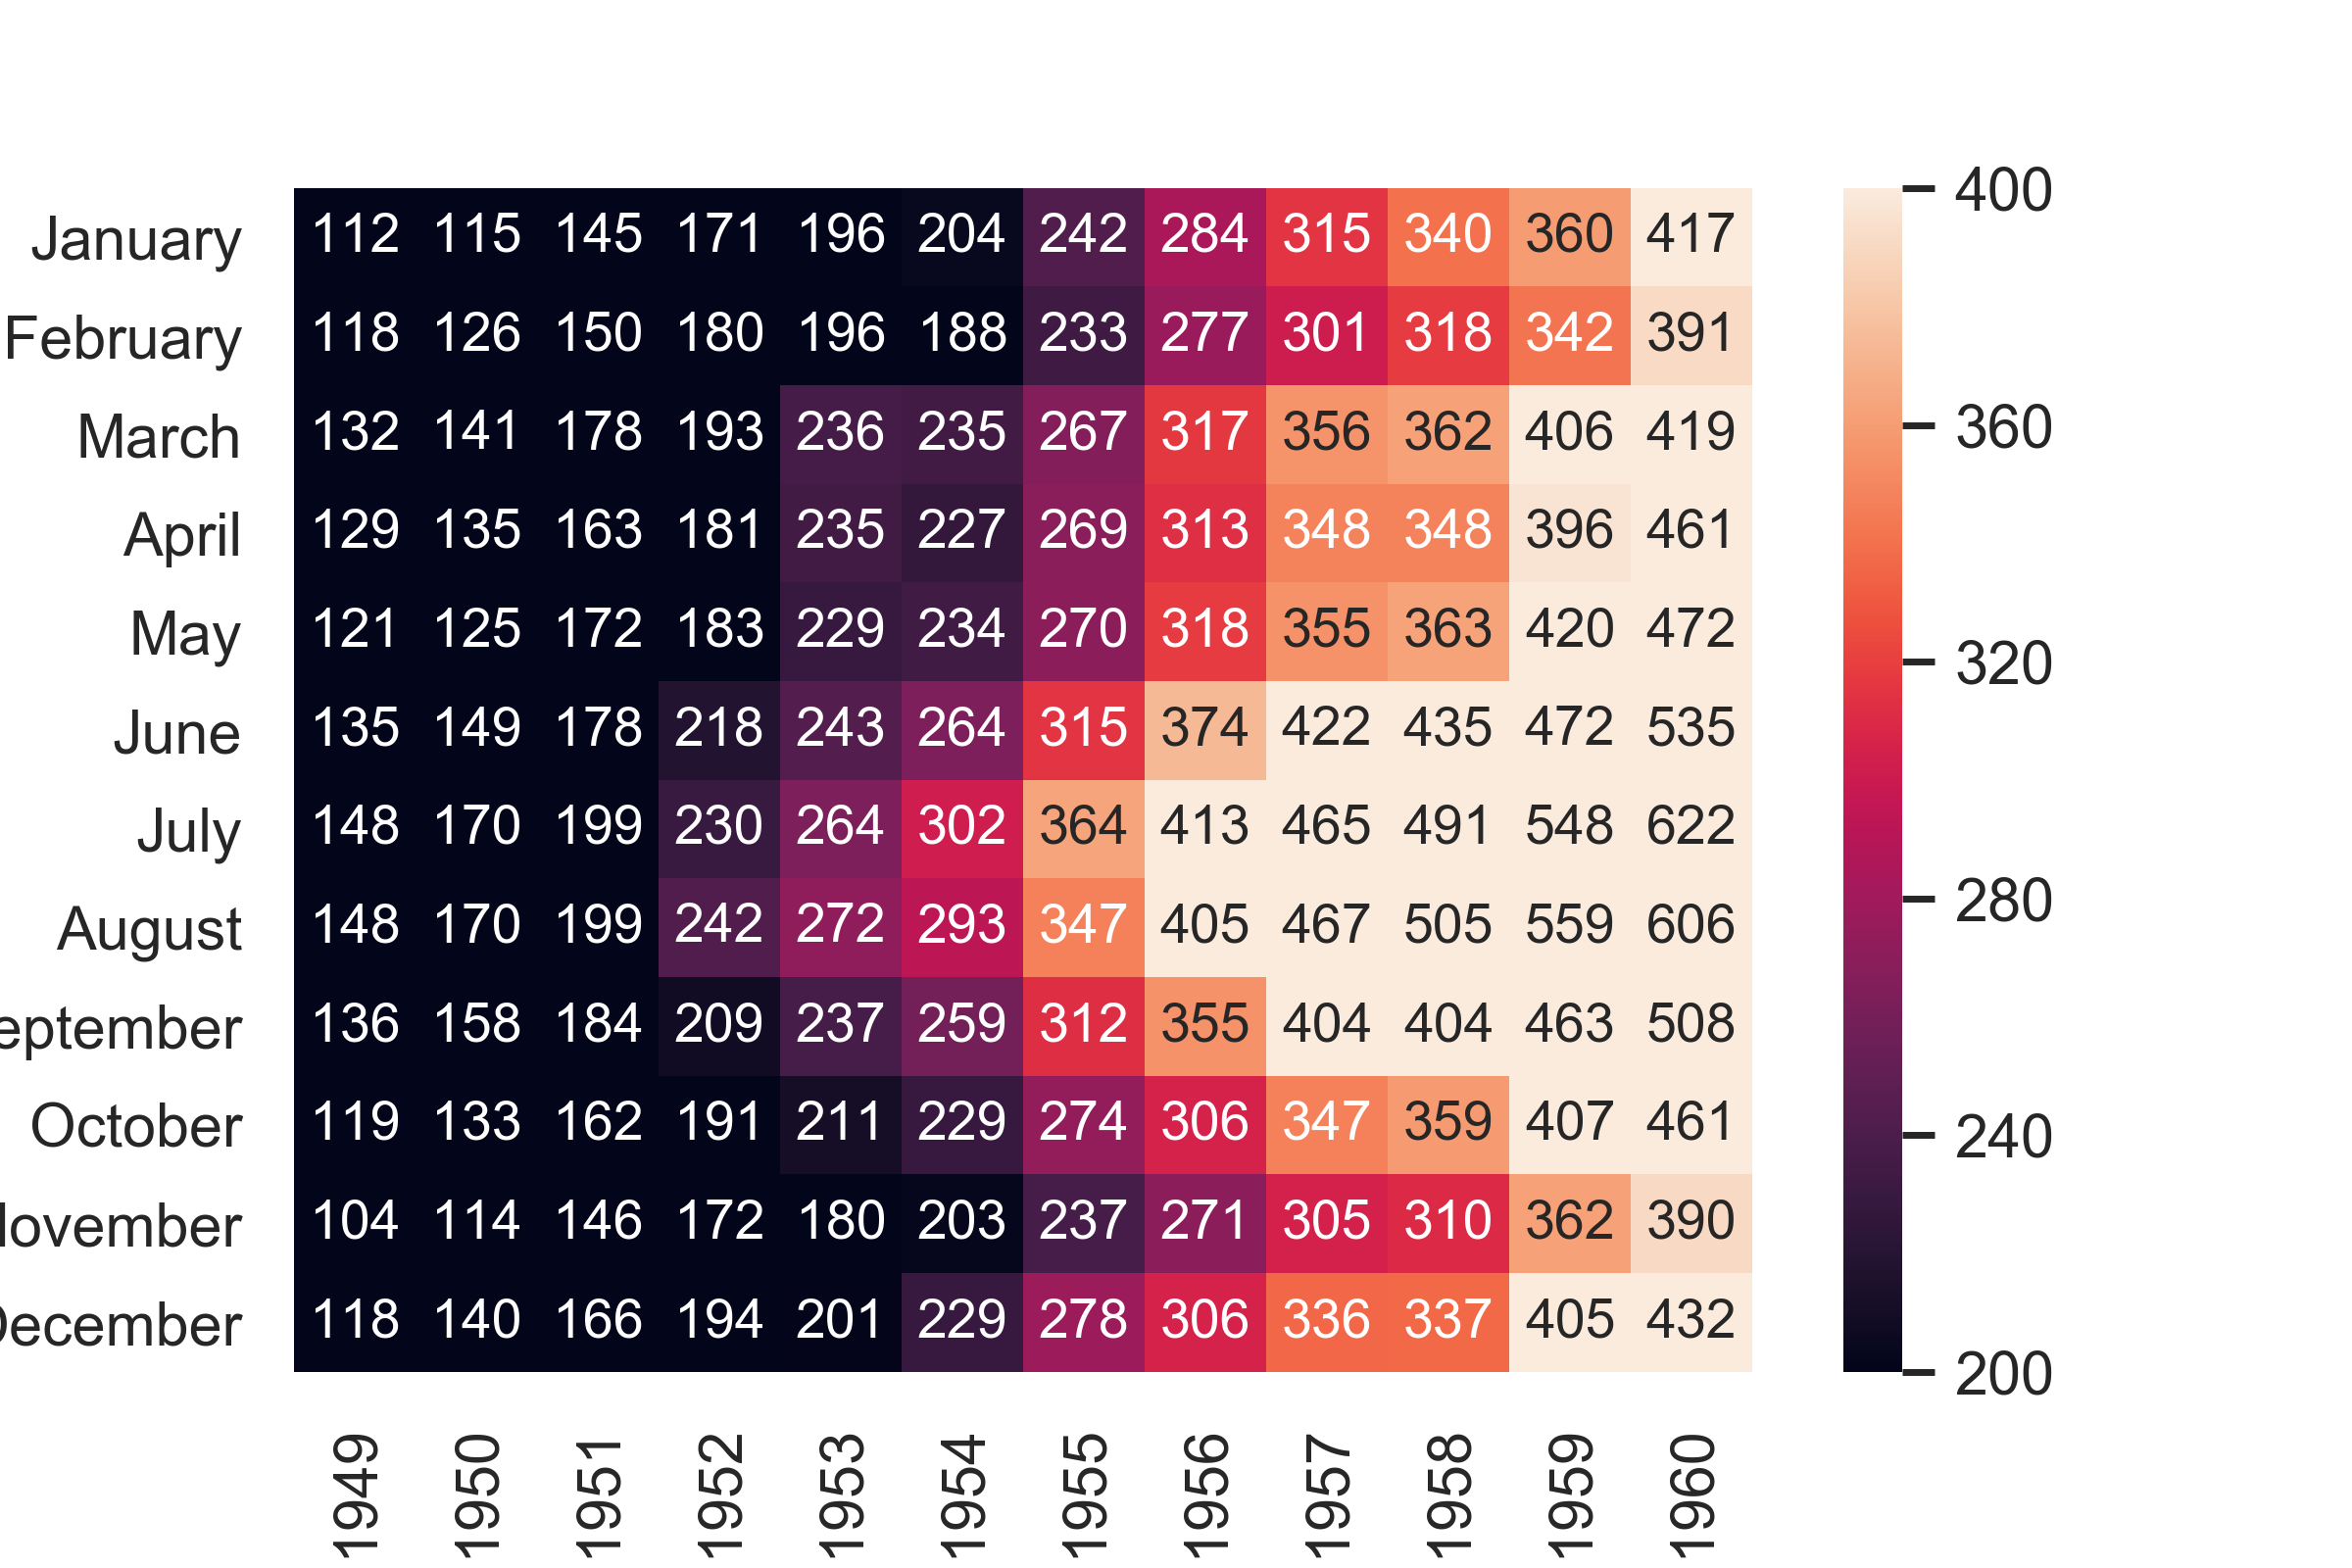
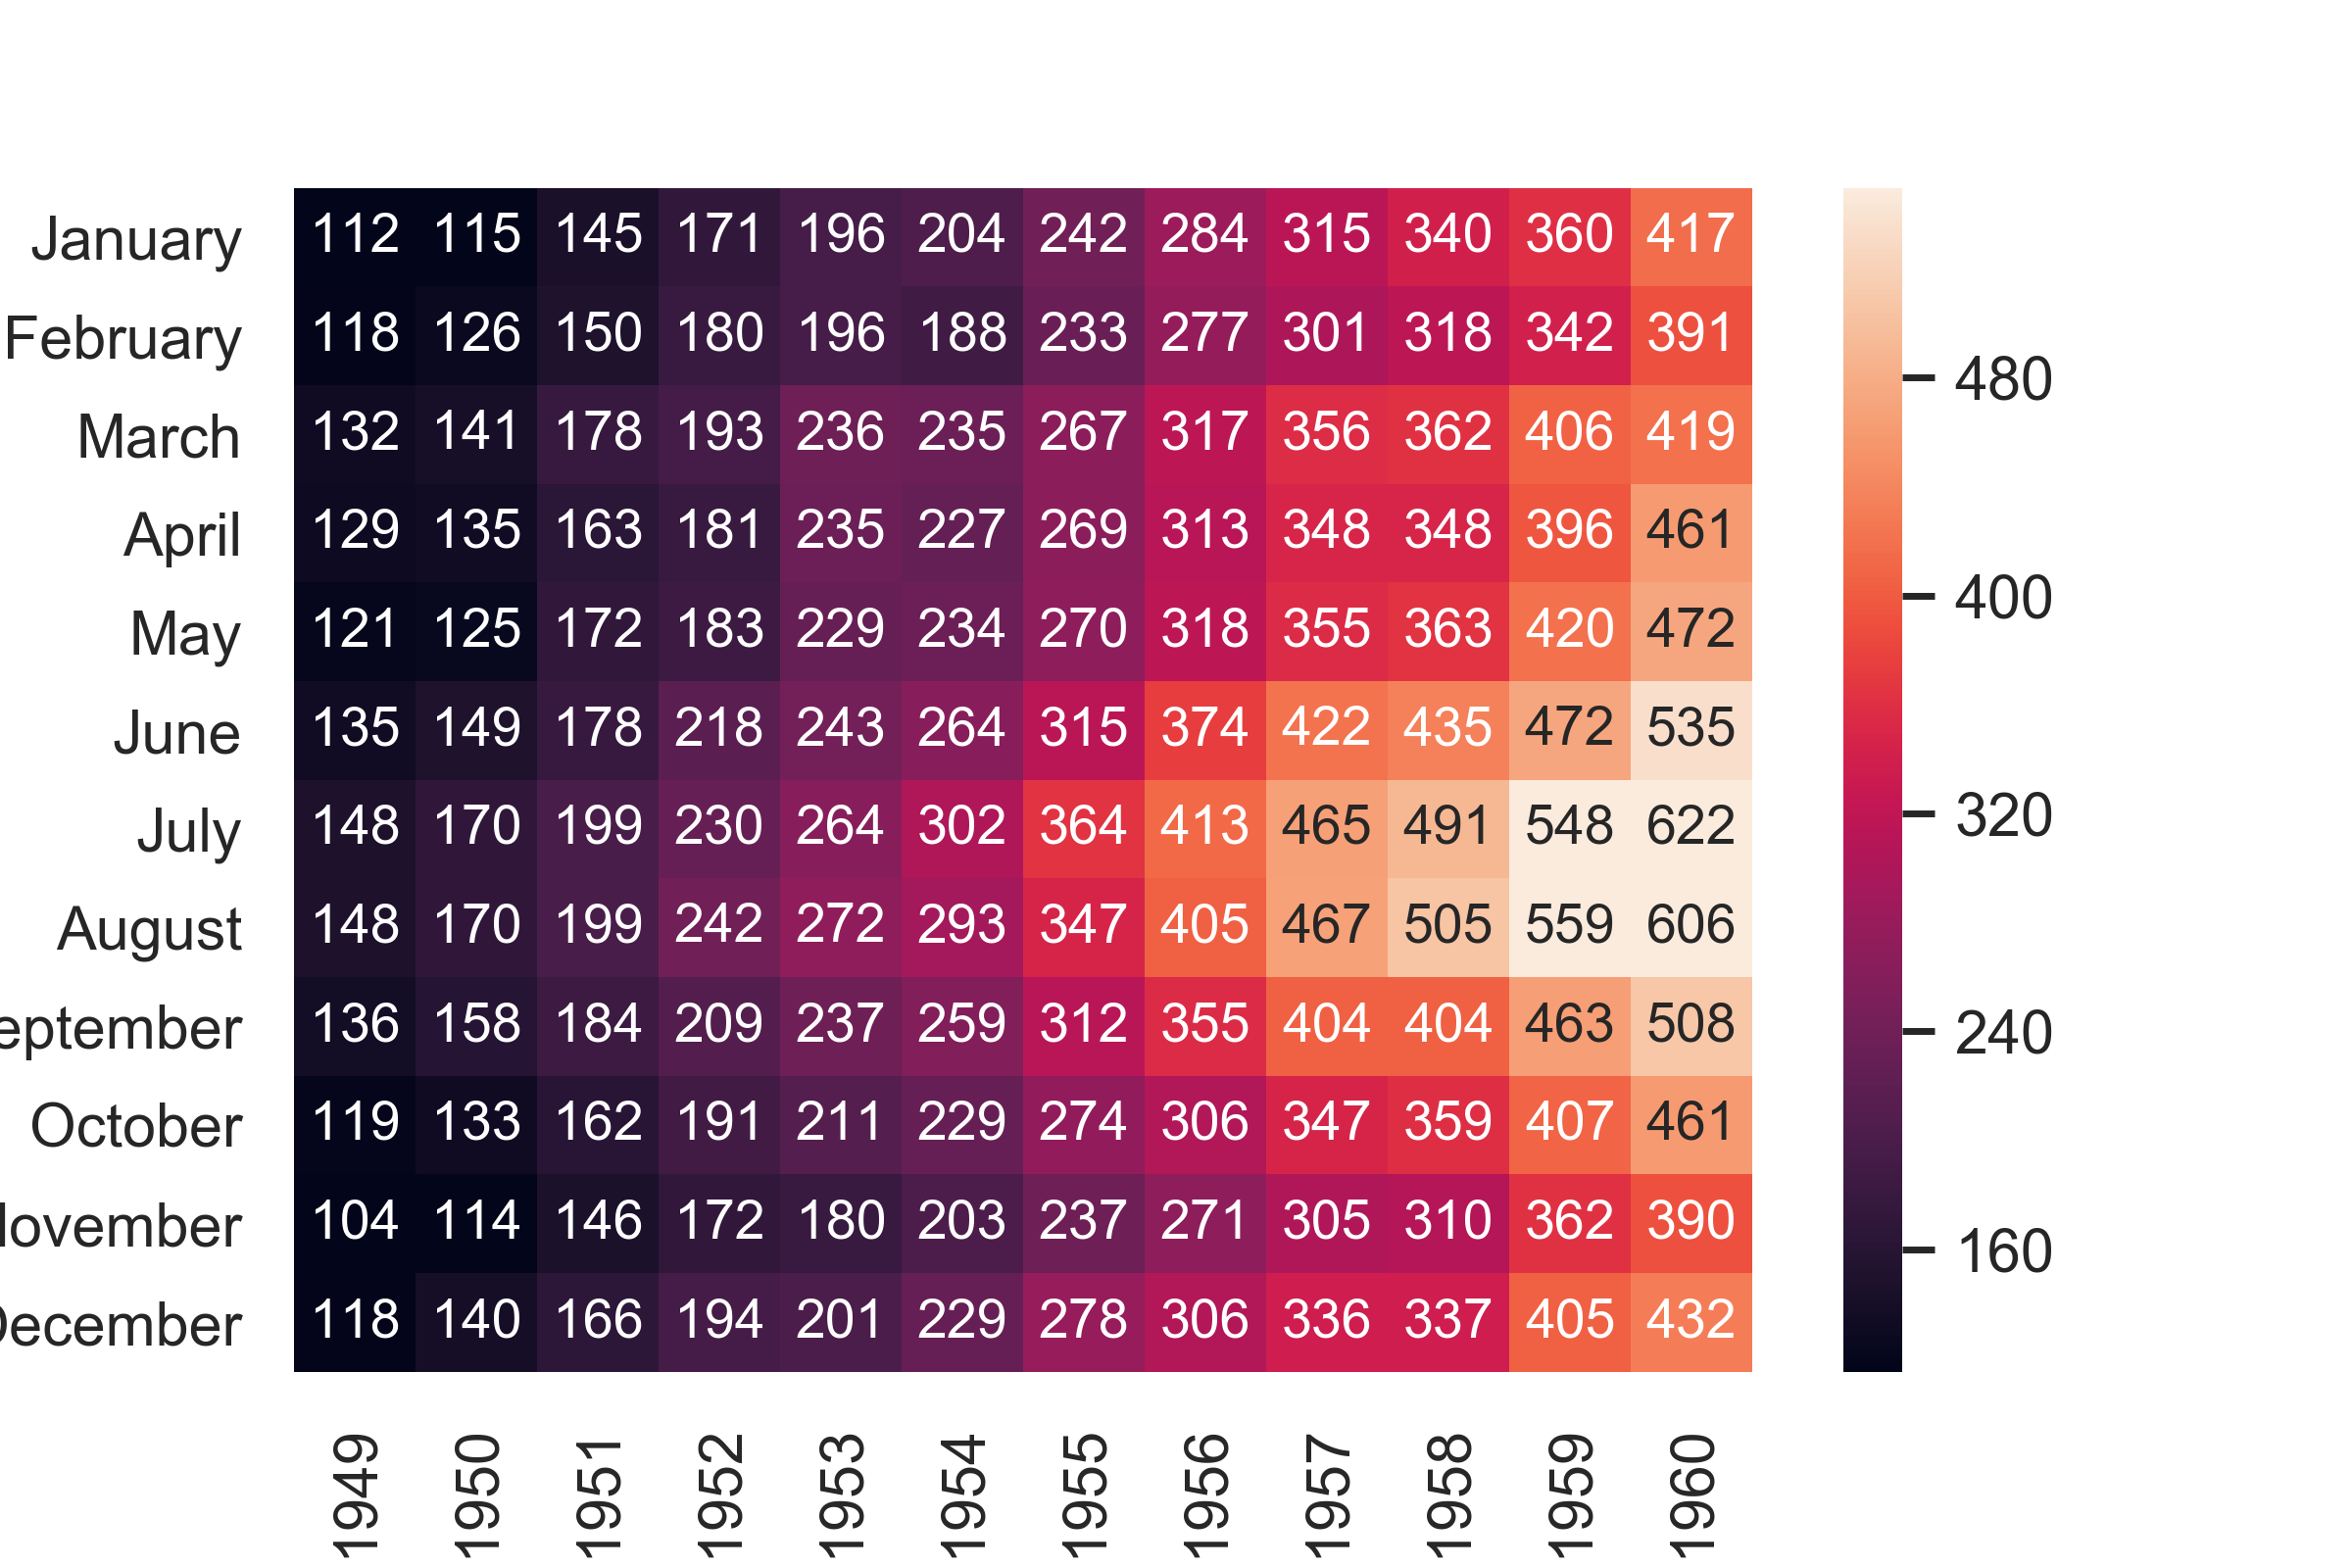
カラーバーの範囲指定 : vmin,vmax
heatmap = sns.heatmap(flights,annot=True,fmt="d",vmin=200,vmax=400)
カラーバーの範囲をロバストに : robust
heatmap = sns.heatmap(flights,annot=True,fmt="d",robust=True)
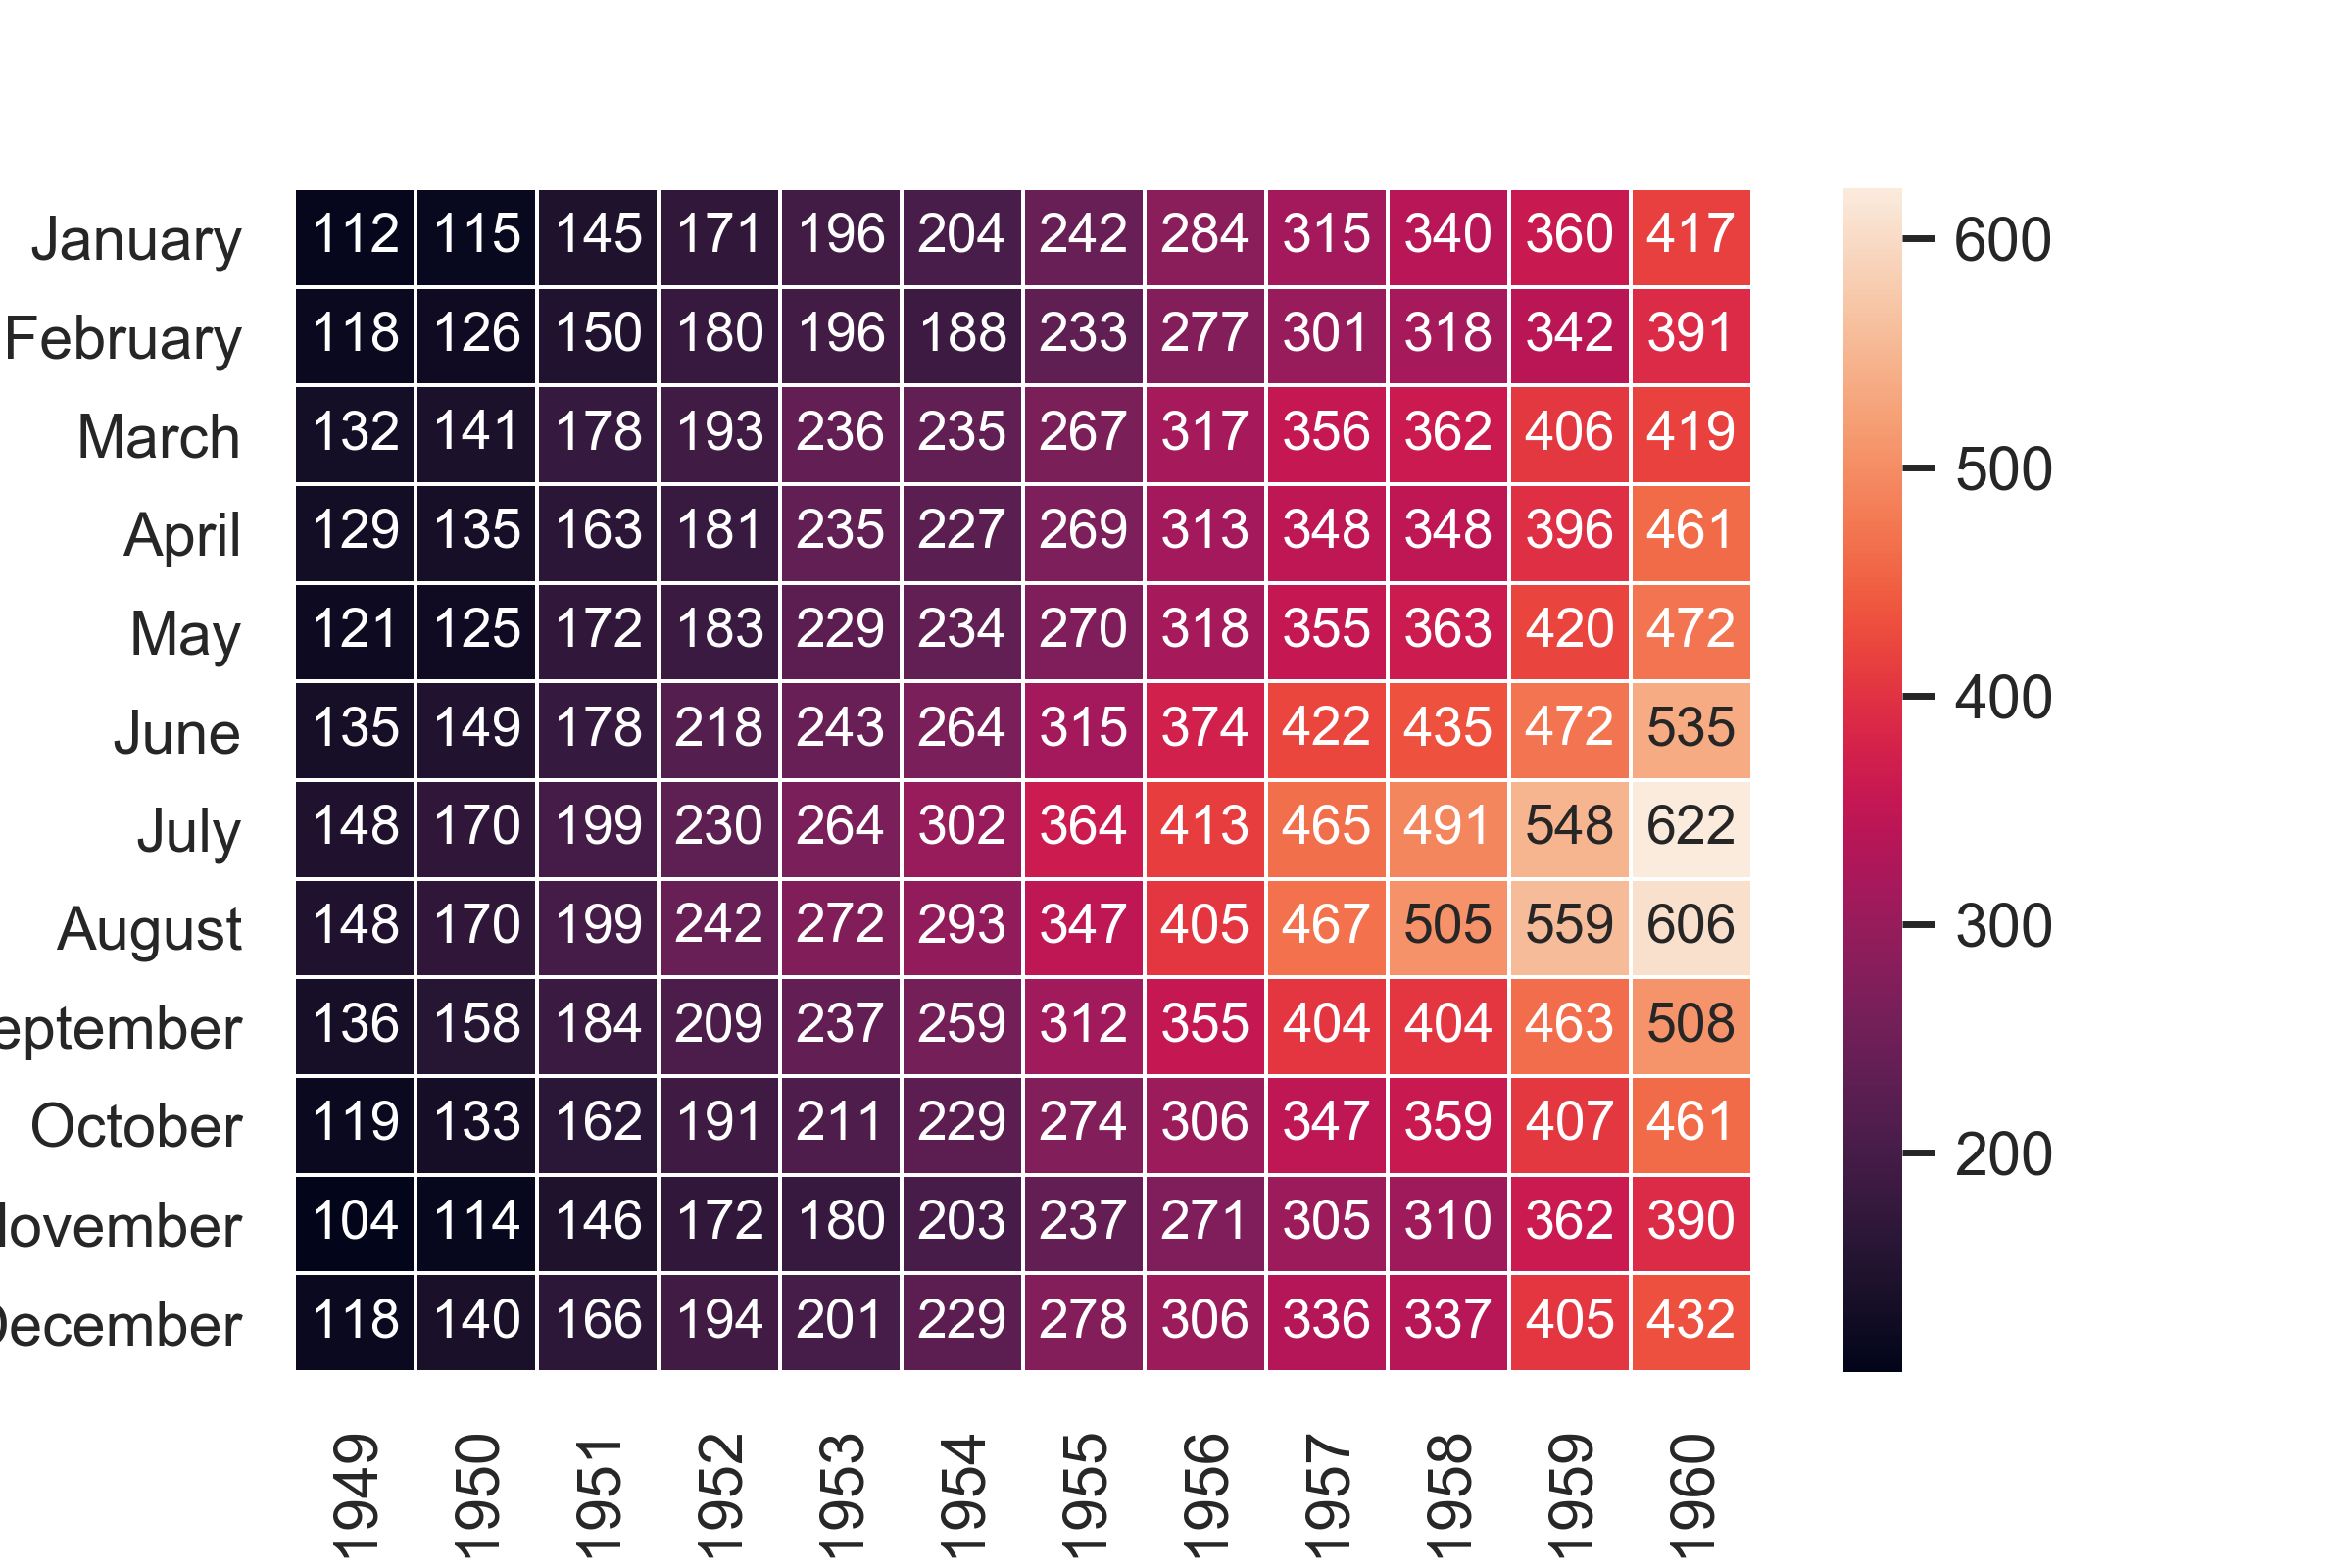
セル境界線の幅設定 : linewidths
linewidthsを設定することで、セル間に隙間を持たせることができる。
heatmap = sns.heatmap(flights,annot=True,fmt="d",linewidths=.5)
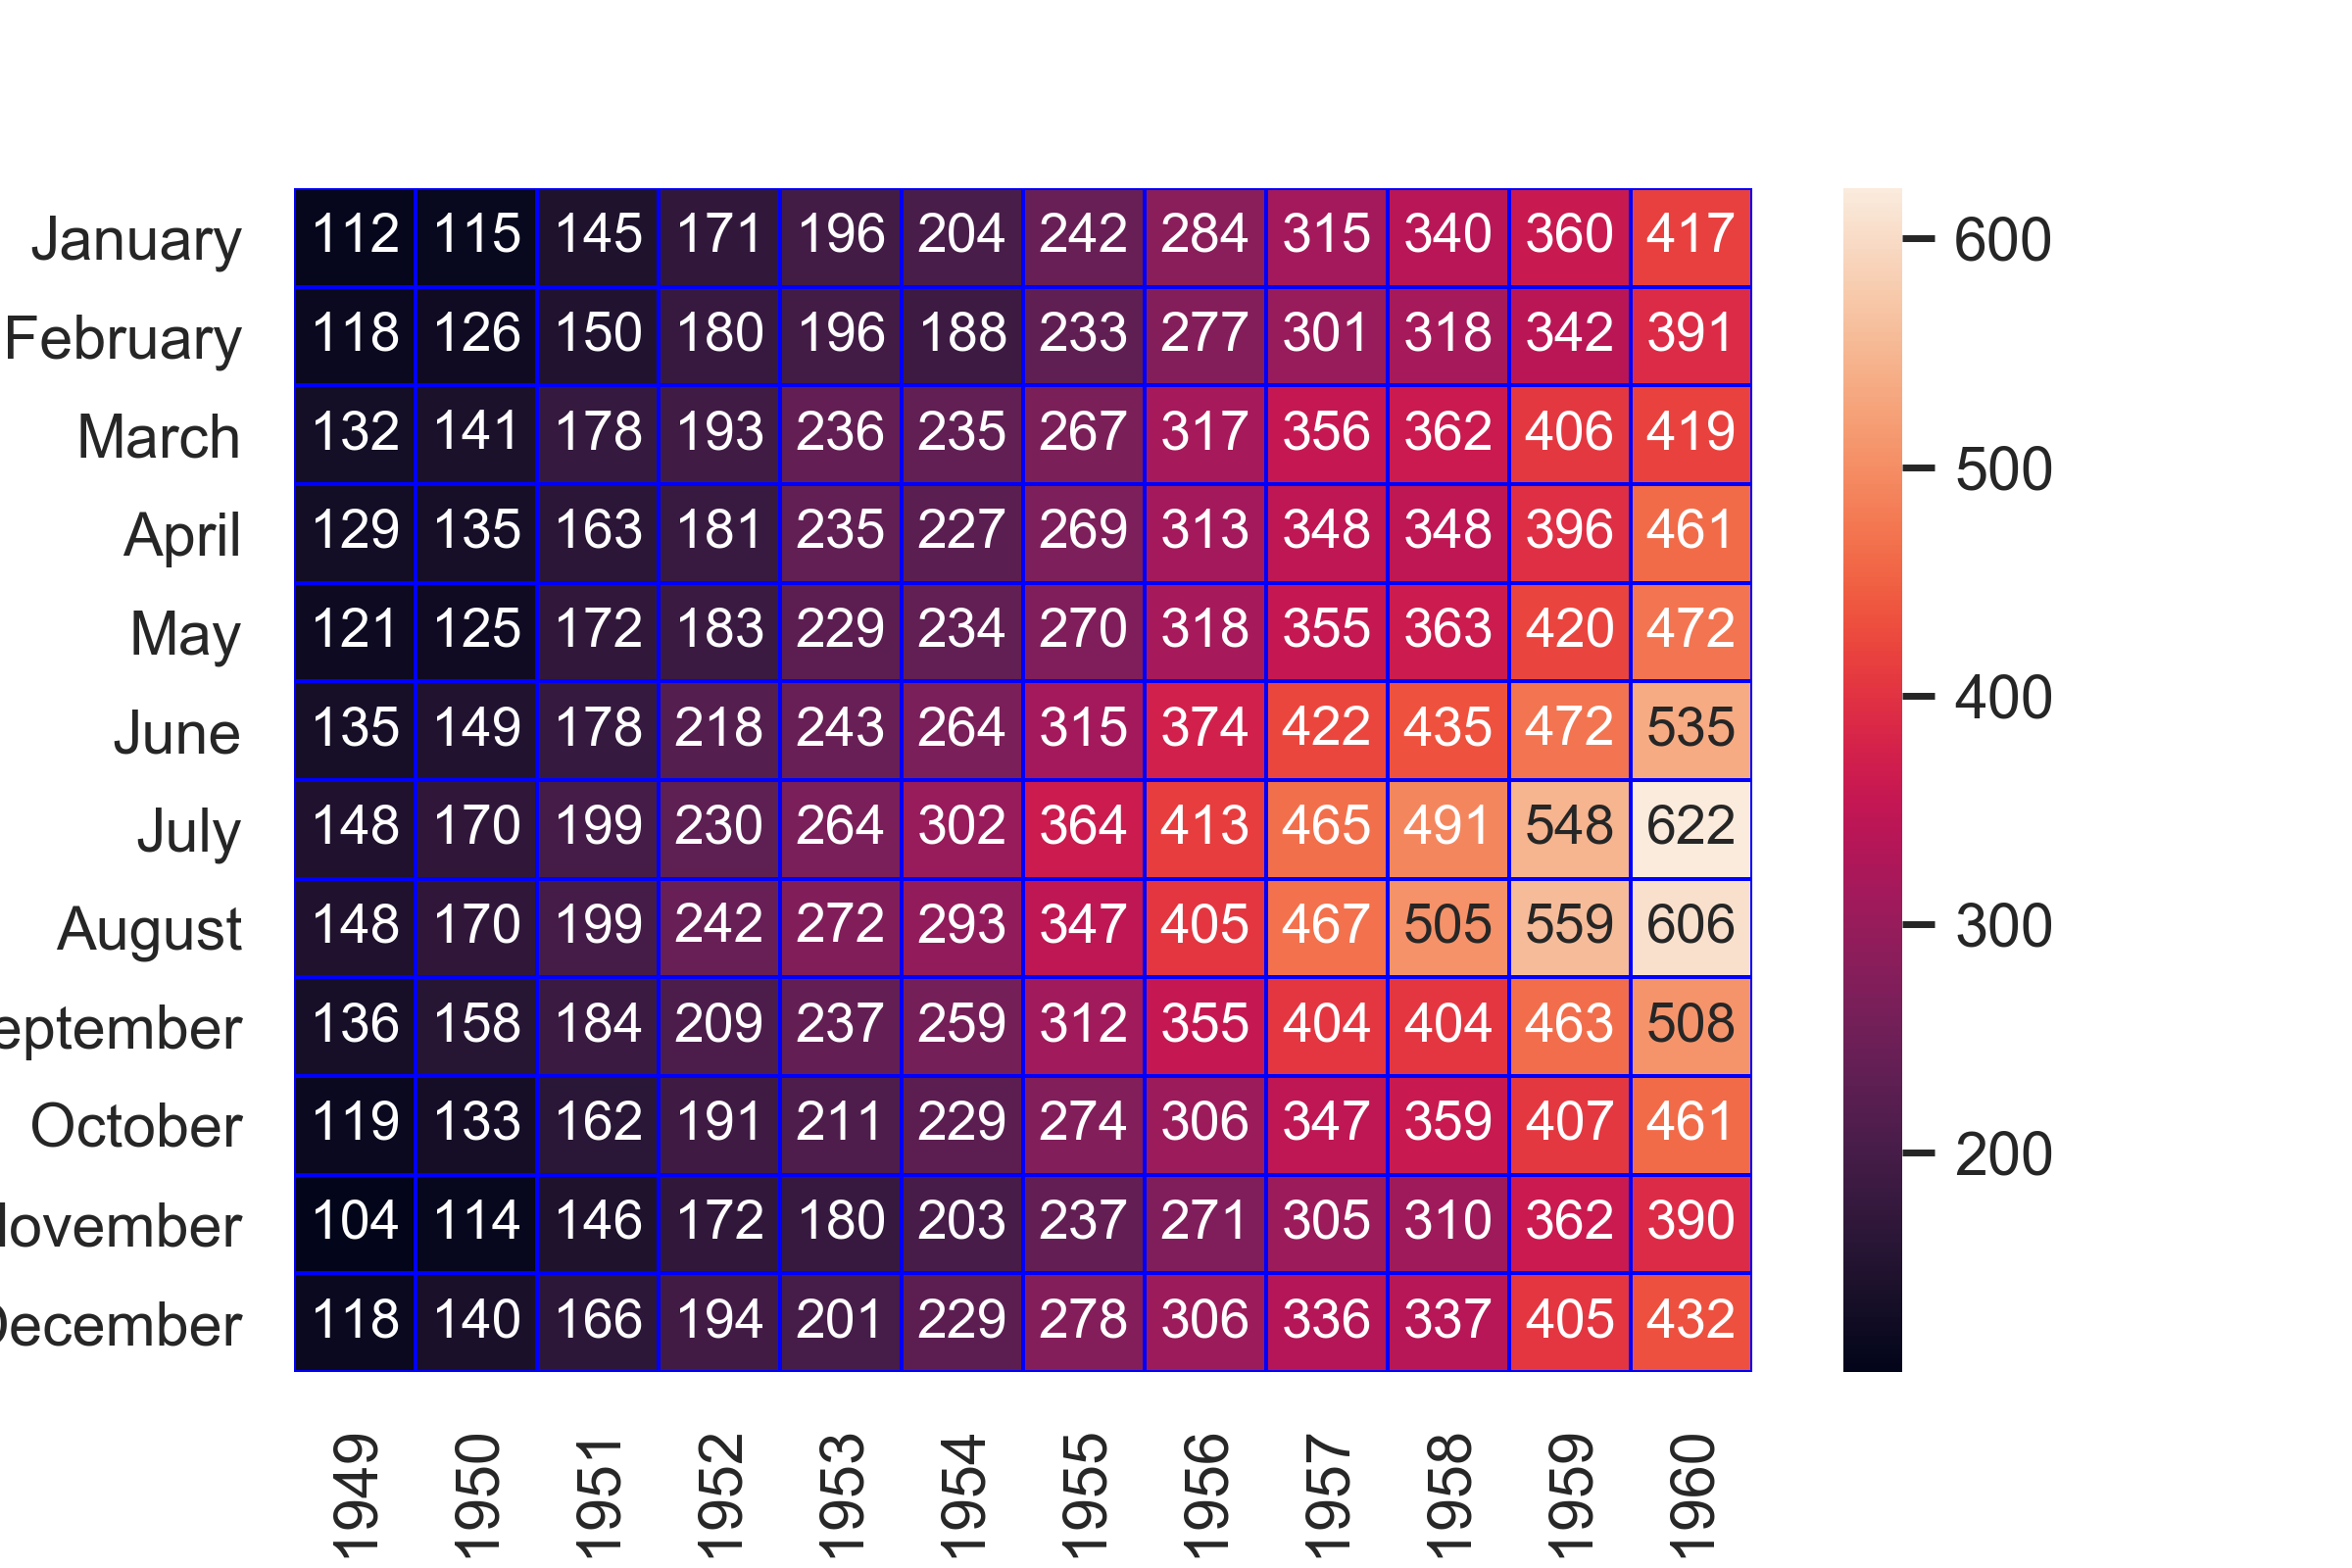
セル境界線の色彩設定 : linecolor
heatmap = sns.heatmap(flights,annot=True,fmt="d",linewidths=.5,linecolor="Blue")
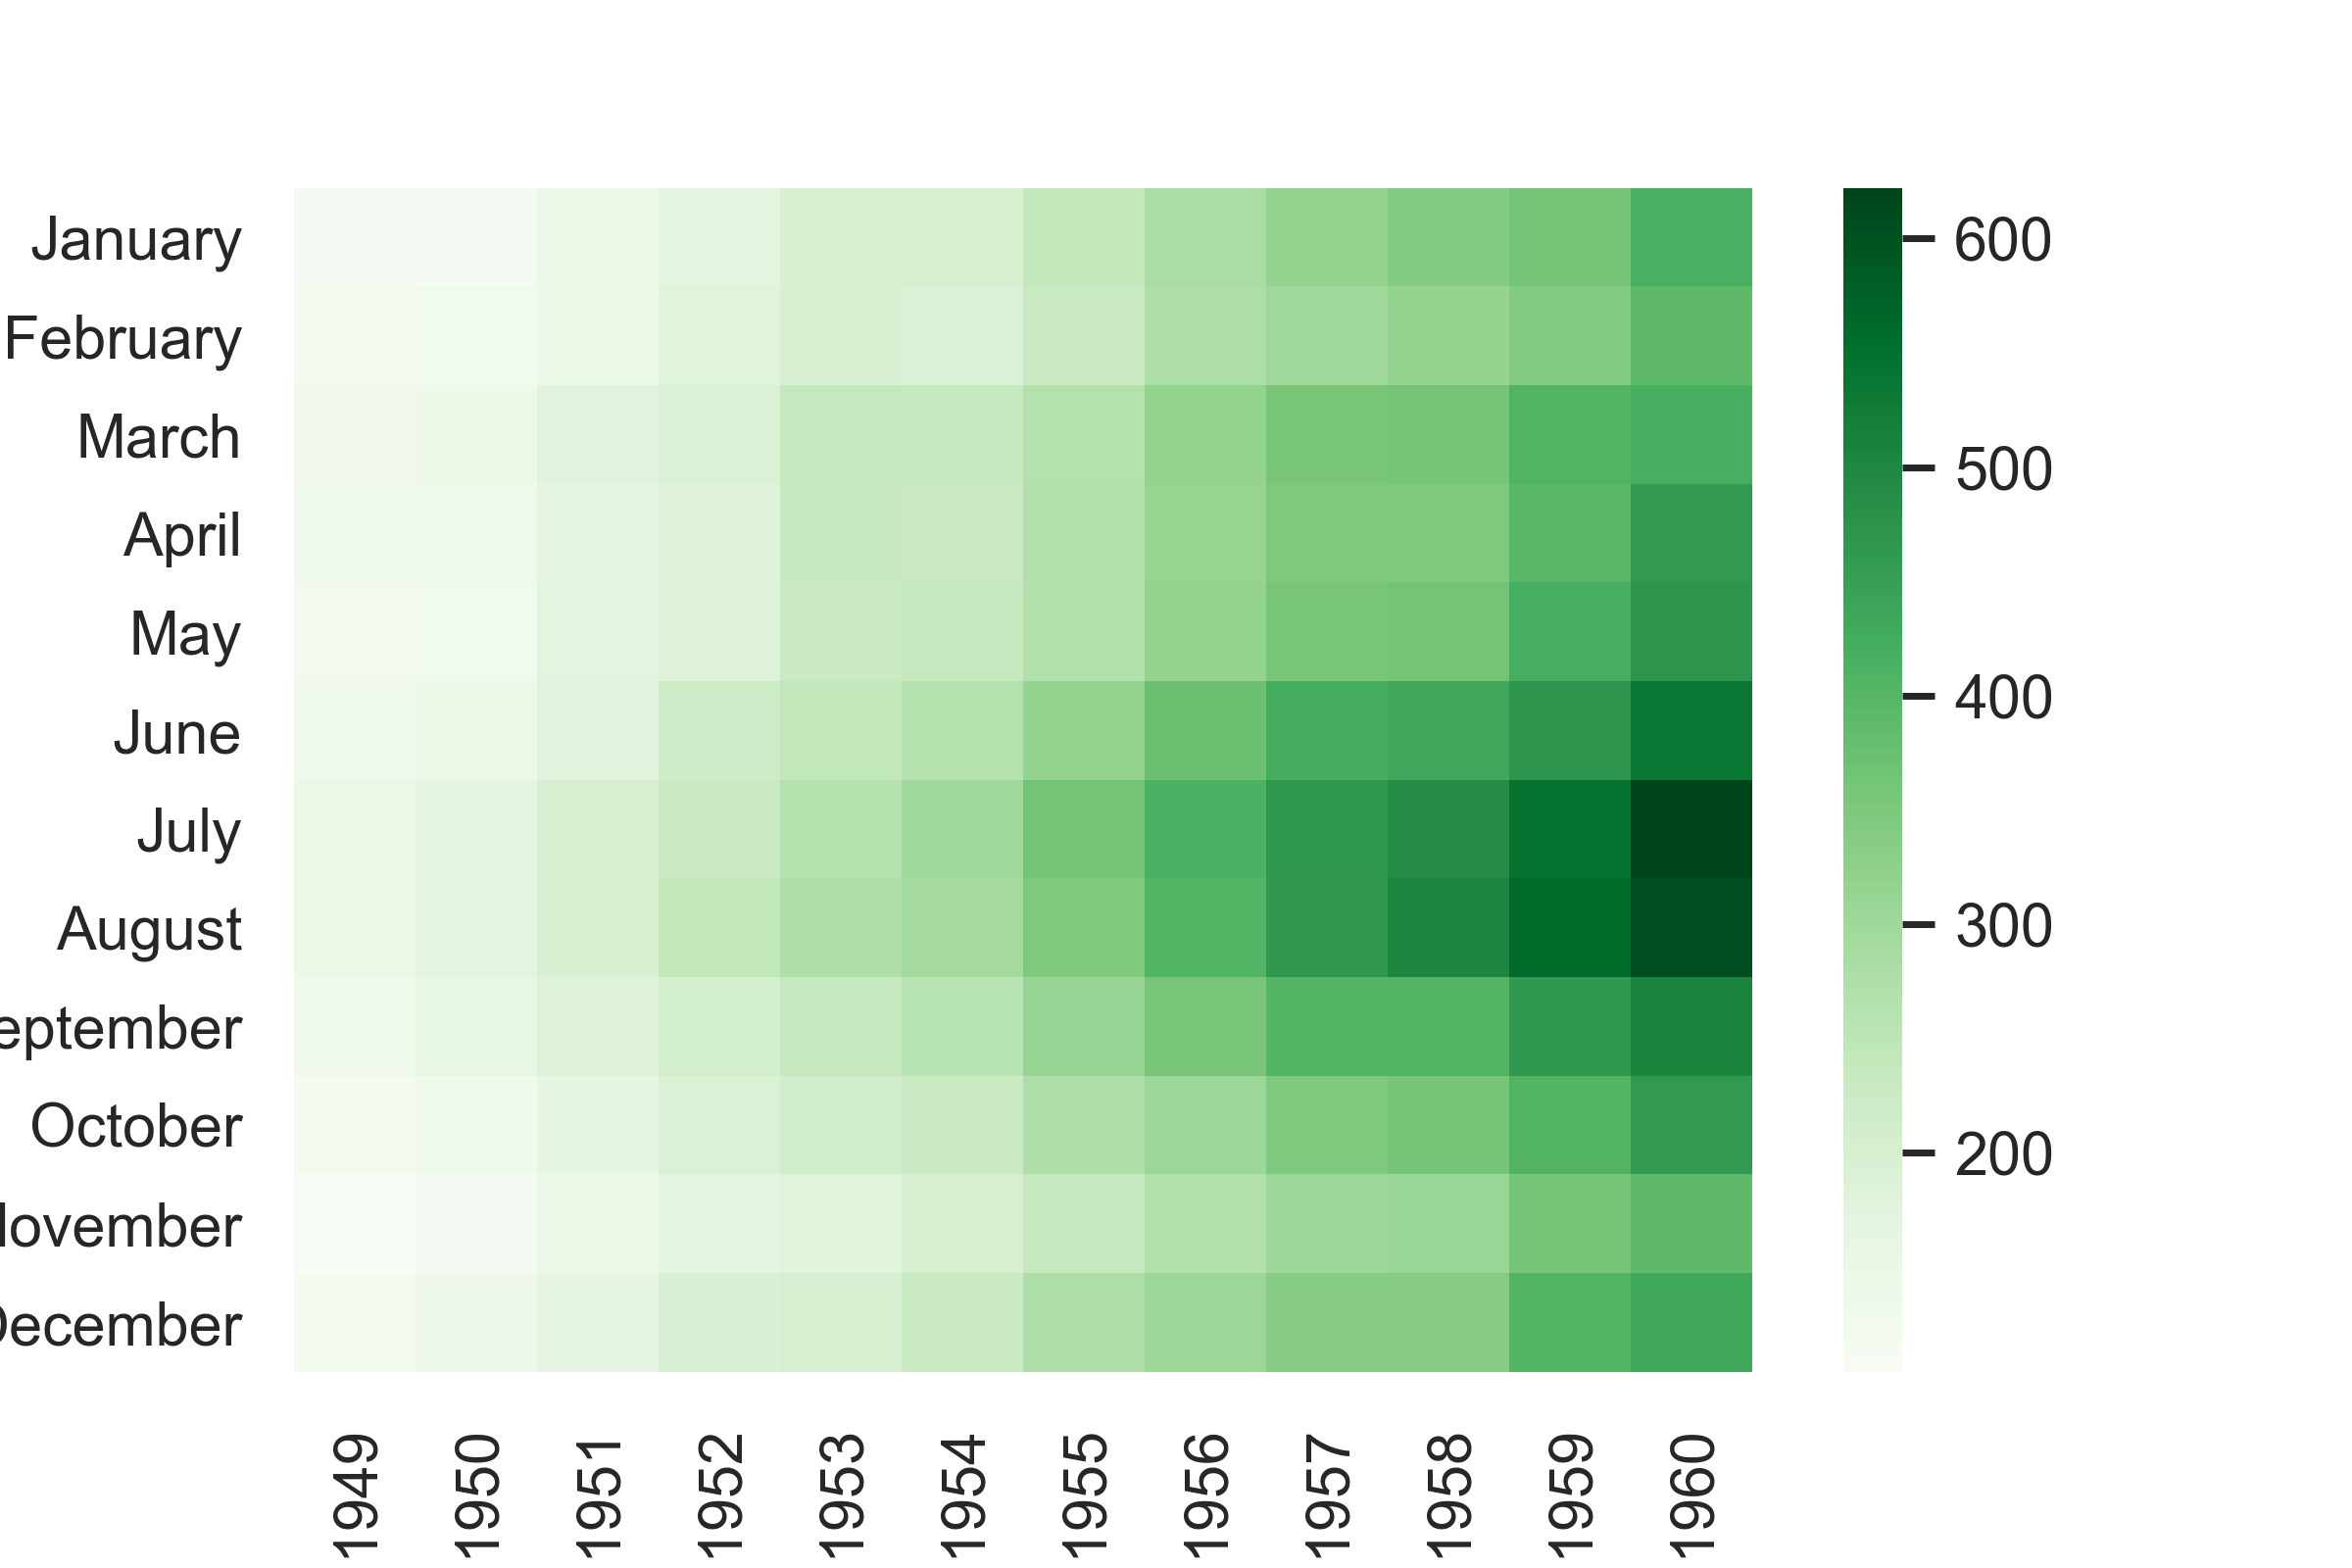
色調の変更 : cmap
cmapで色調を変更できる。設定値の詳細は以下を参照。
https://matplotlib.org/examples/color/colormaps_reference.html
heatmap = sns.heatmap(flights,cmap="Greens")
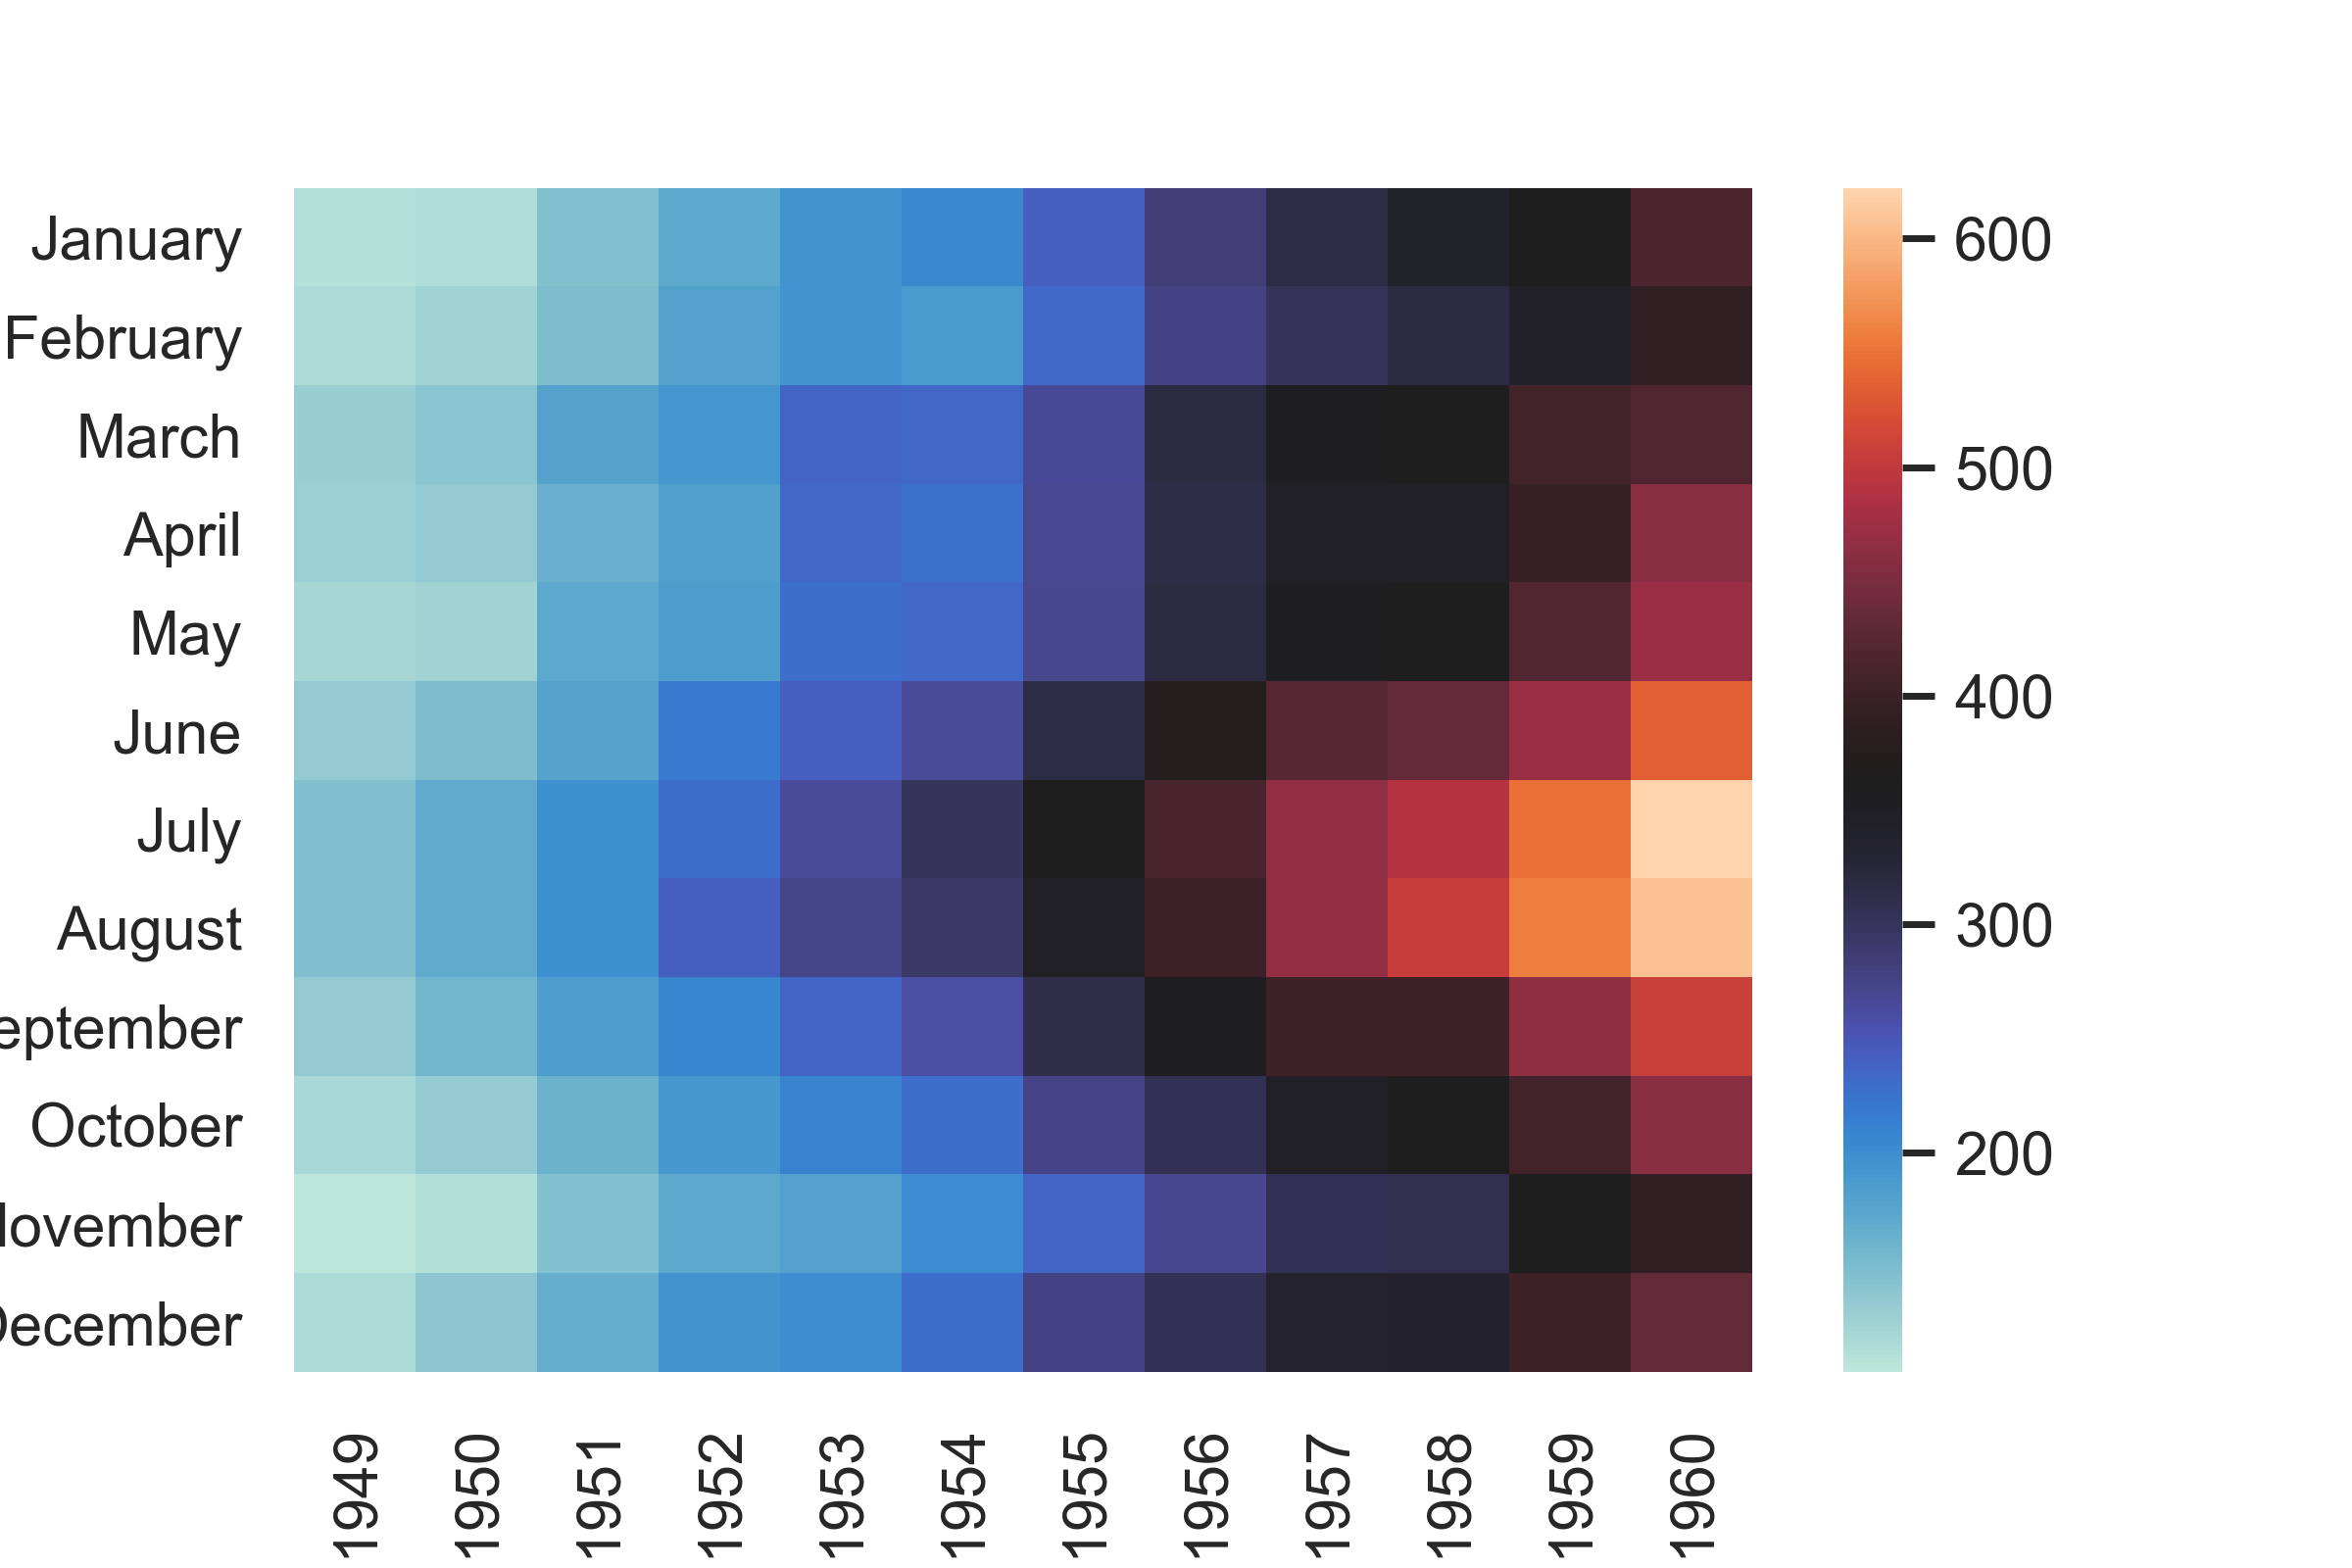
中央値の設定 : center
centerでセルを指定すると、そのセル部分を中央値の黒色としてヒートマップが形成される。
買ったばかりの鉄フライパン熱した時みたいで綺麗だと思った。
heatmap = sns.heatmap(flights, center=flights.loc["July", 1955])
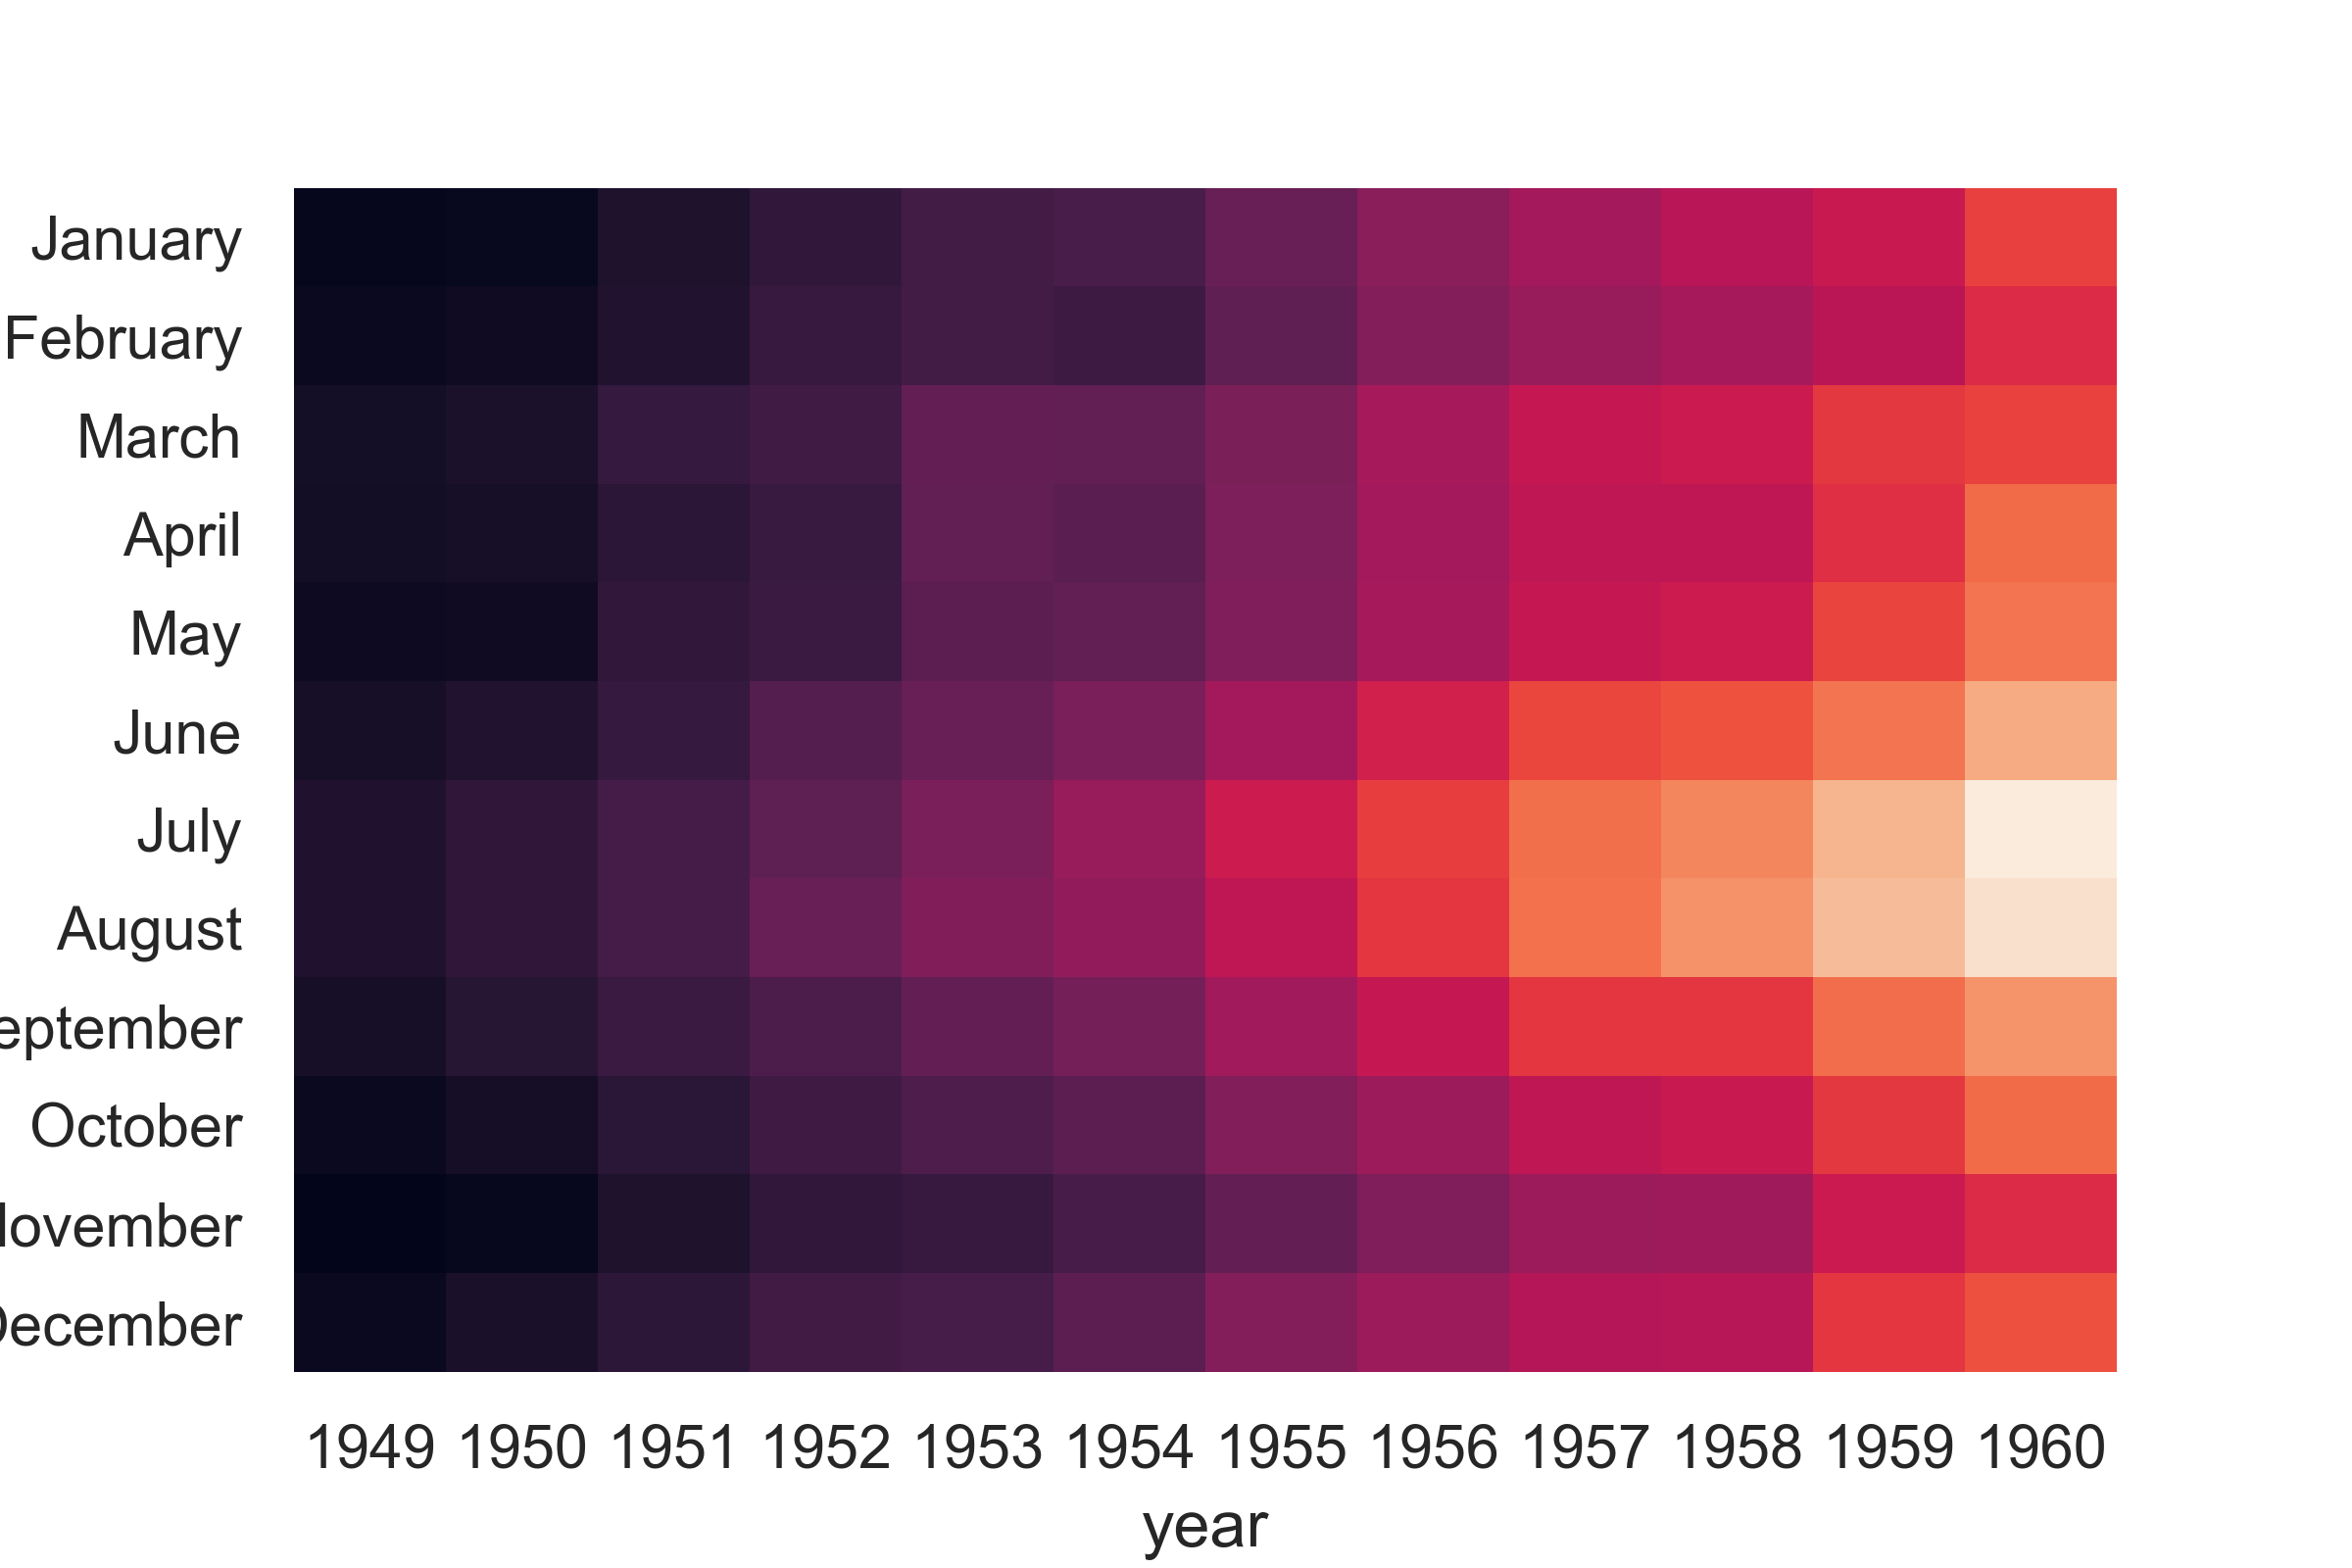
カラーバーの有無 : cbar
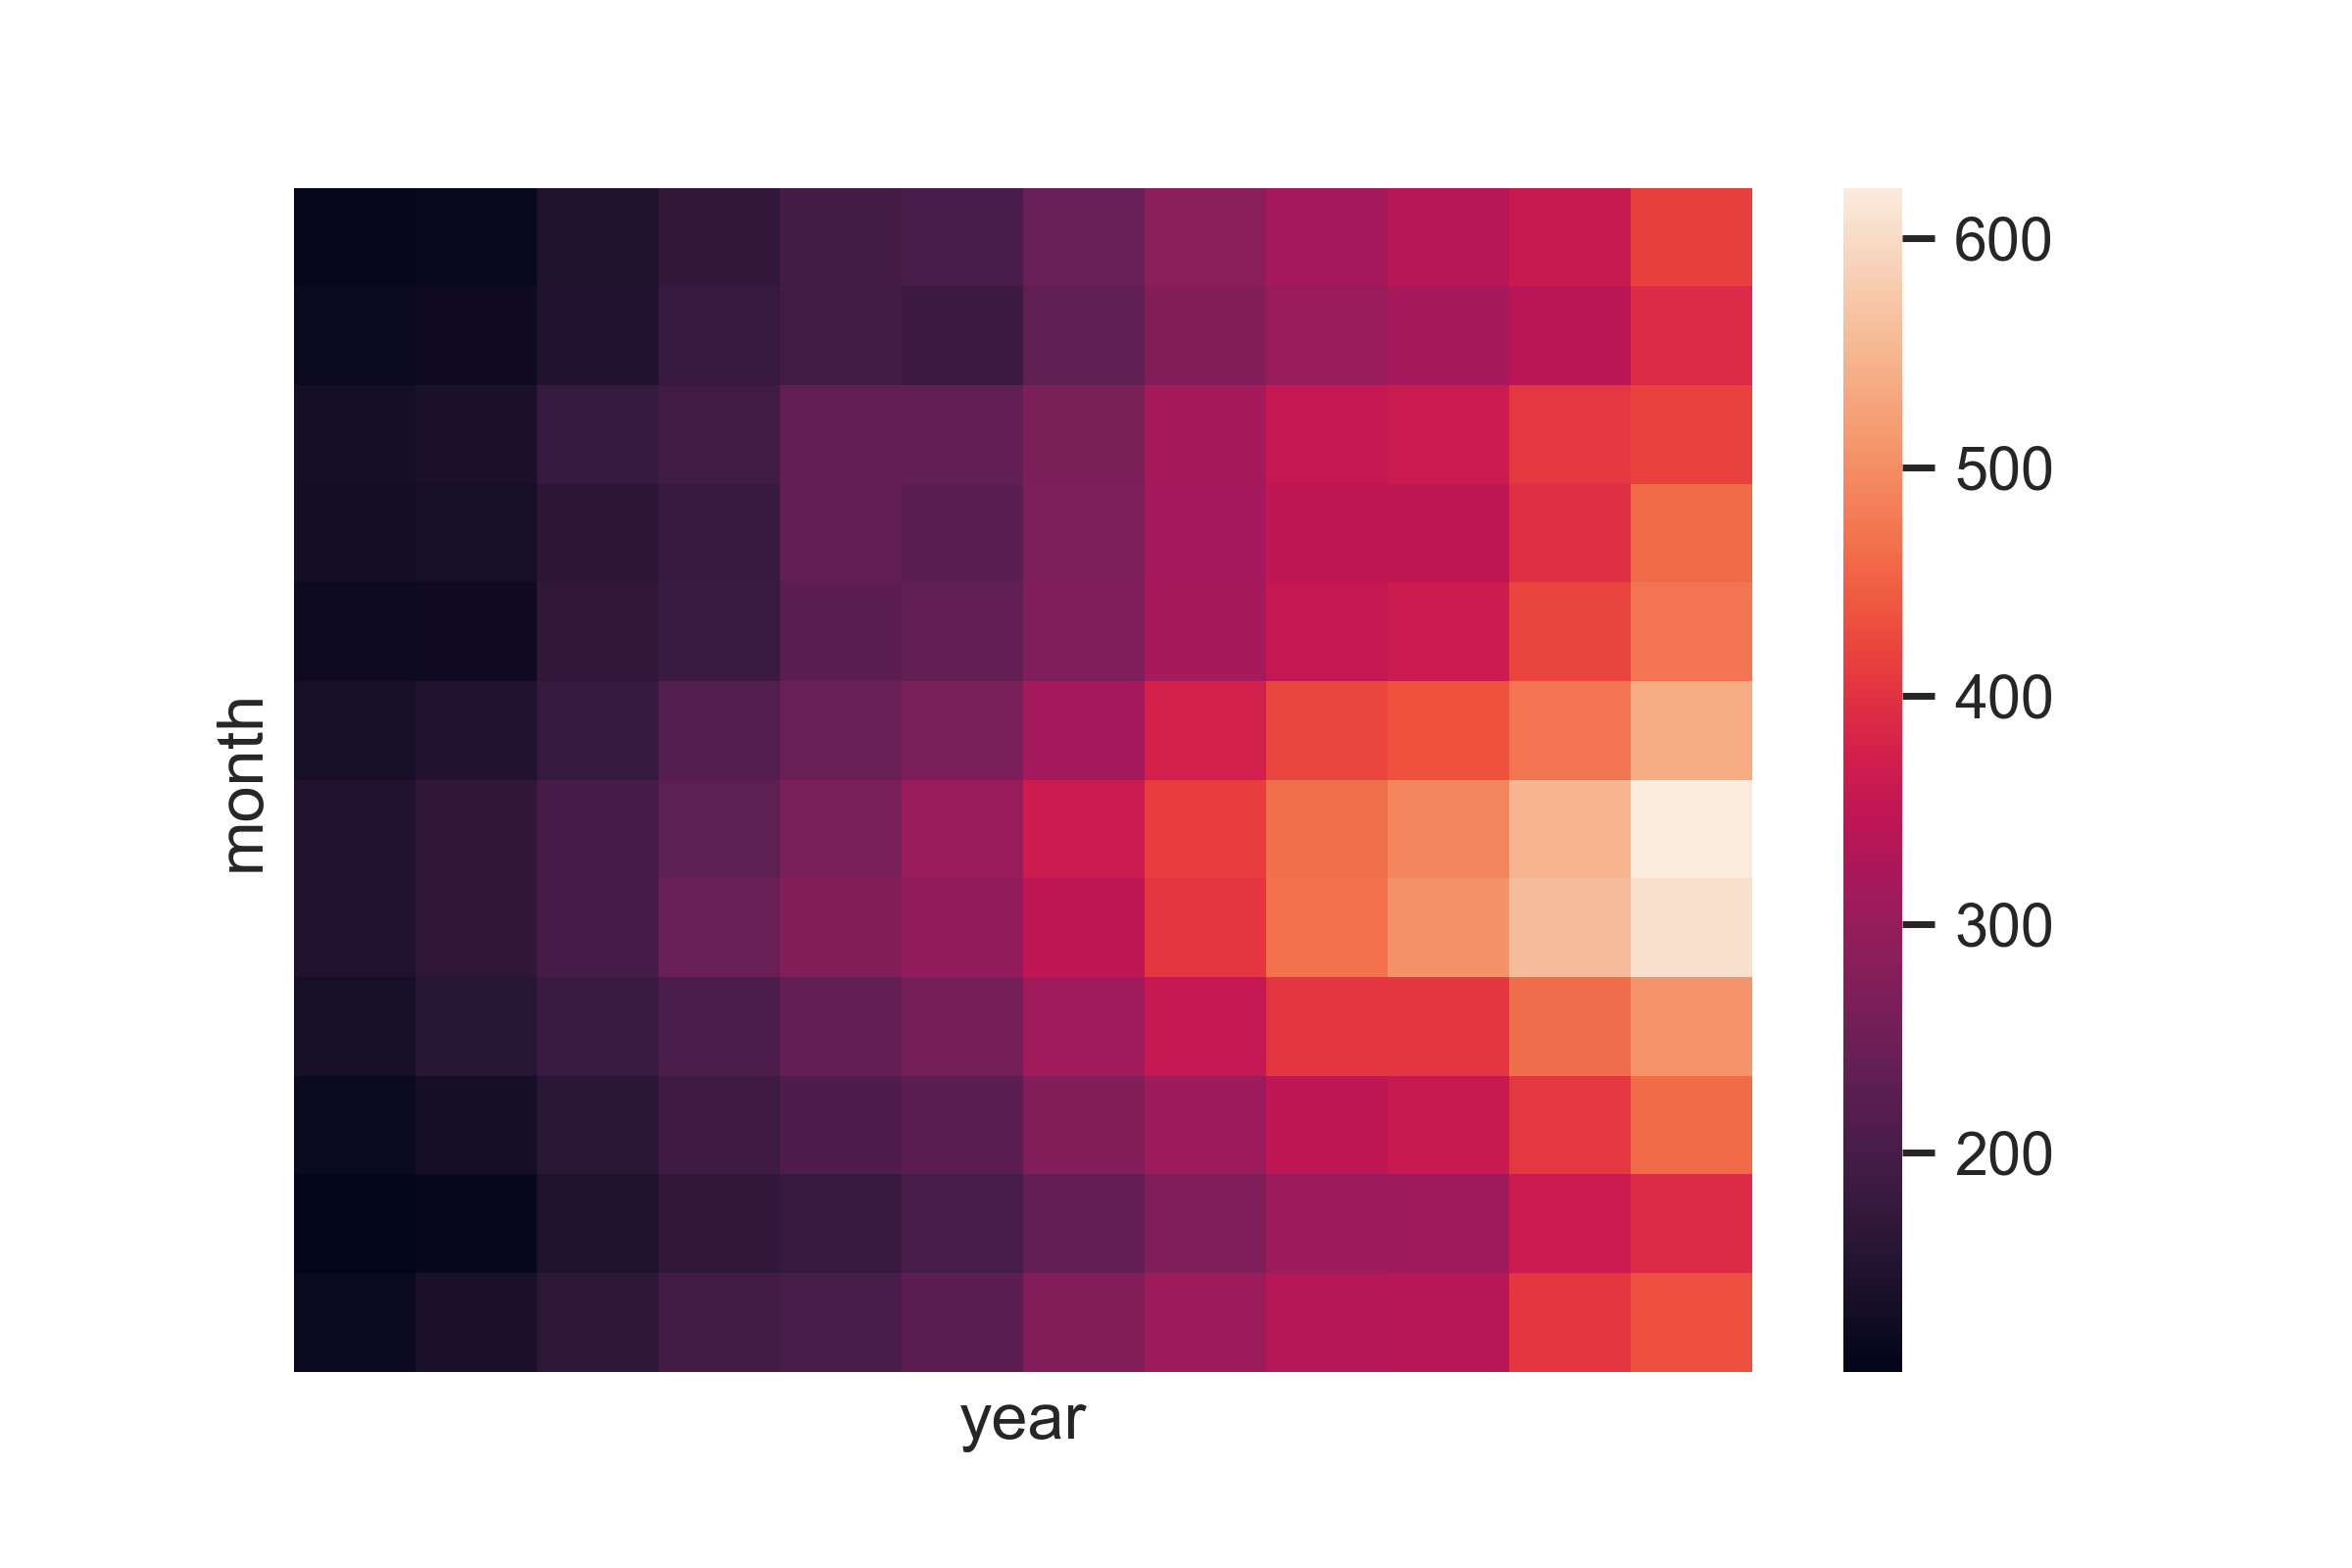
cbar=Falseでカラーバーを非表示に。
heatmap = sns.heatmap(flights,cbar=False)
正方形 : square
square=Trueでヒートマップが正方形になるよ。
heatmap = sns.heatmap(flights,square=True)
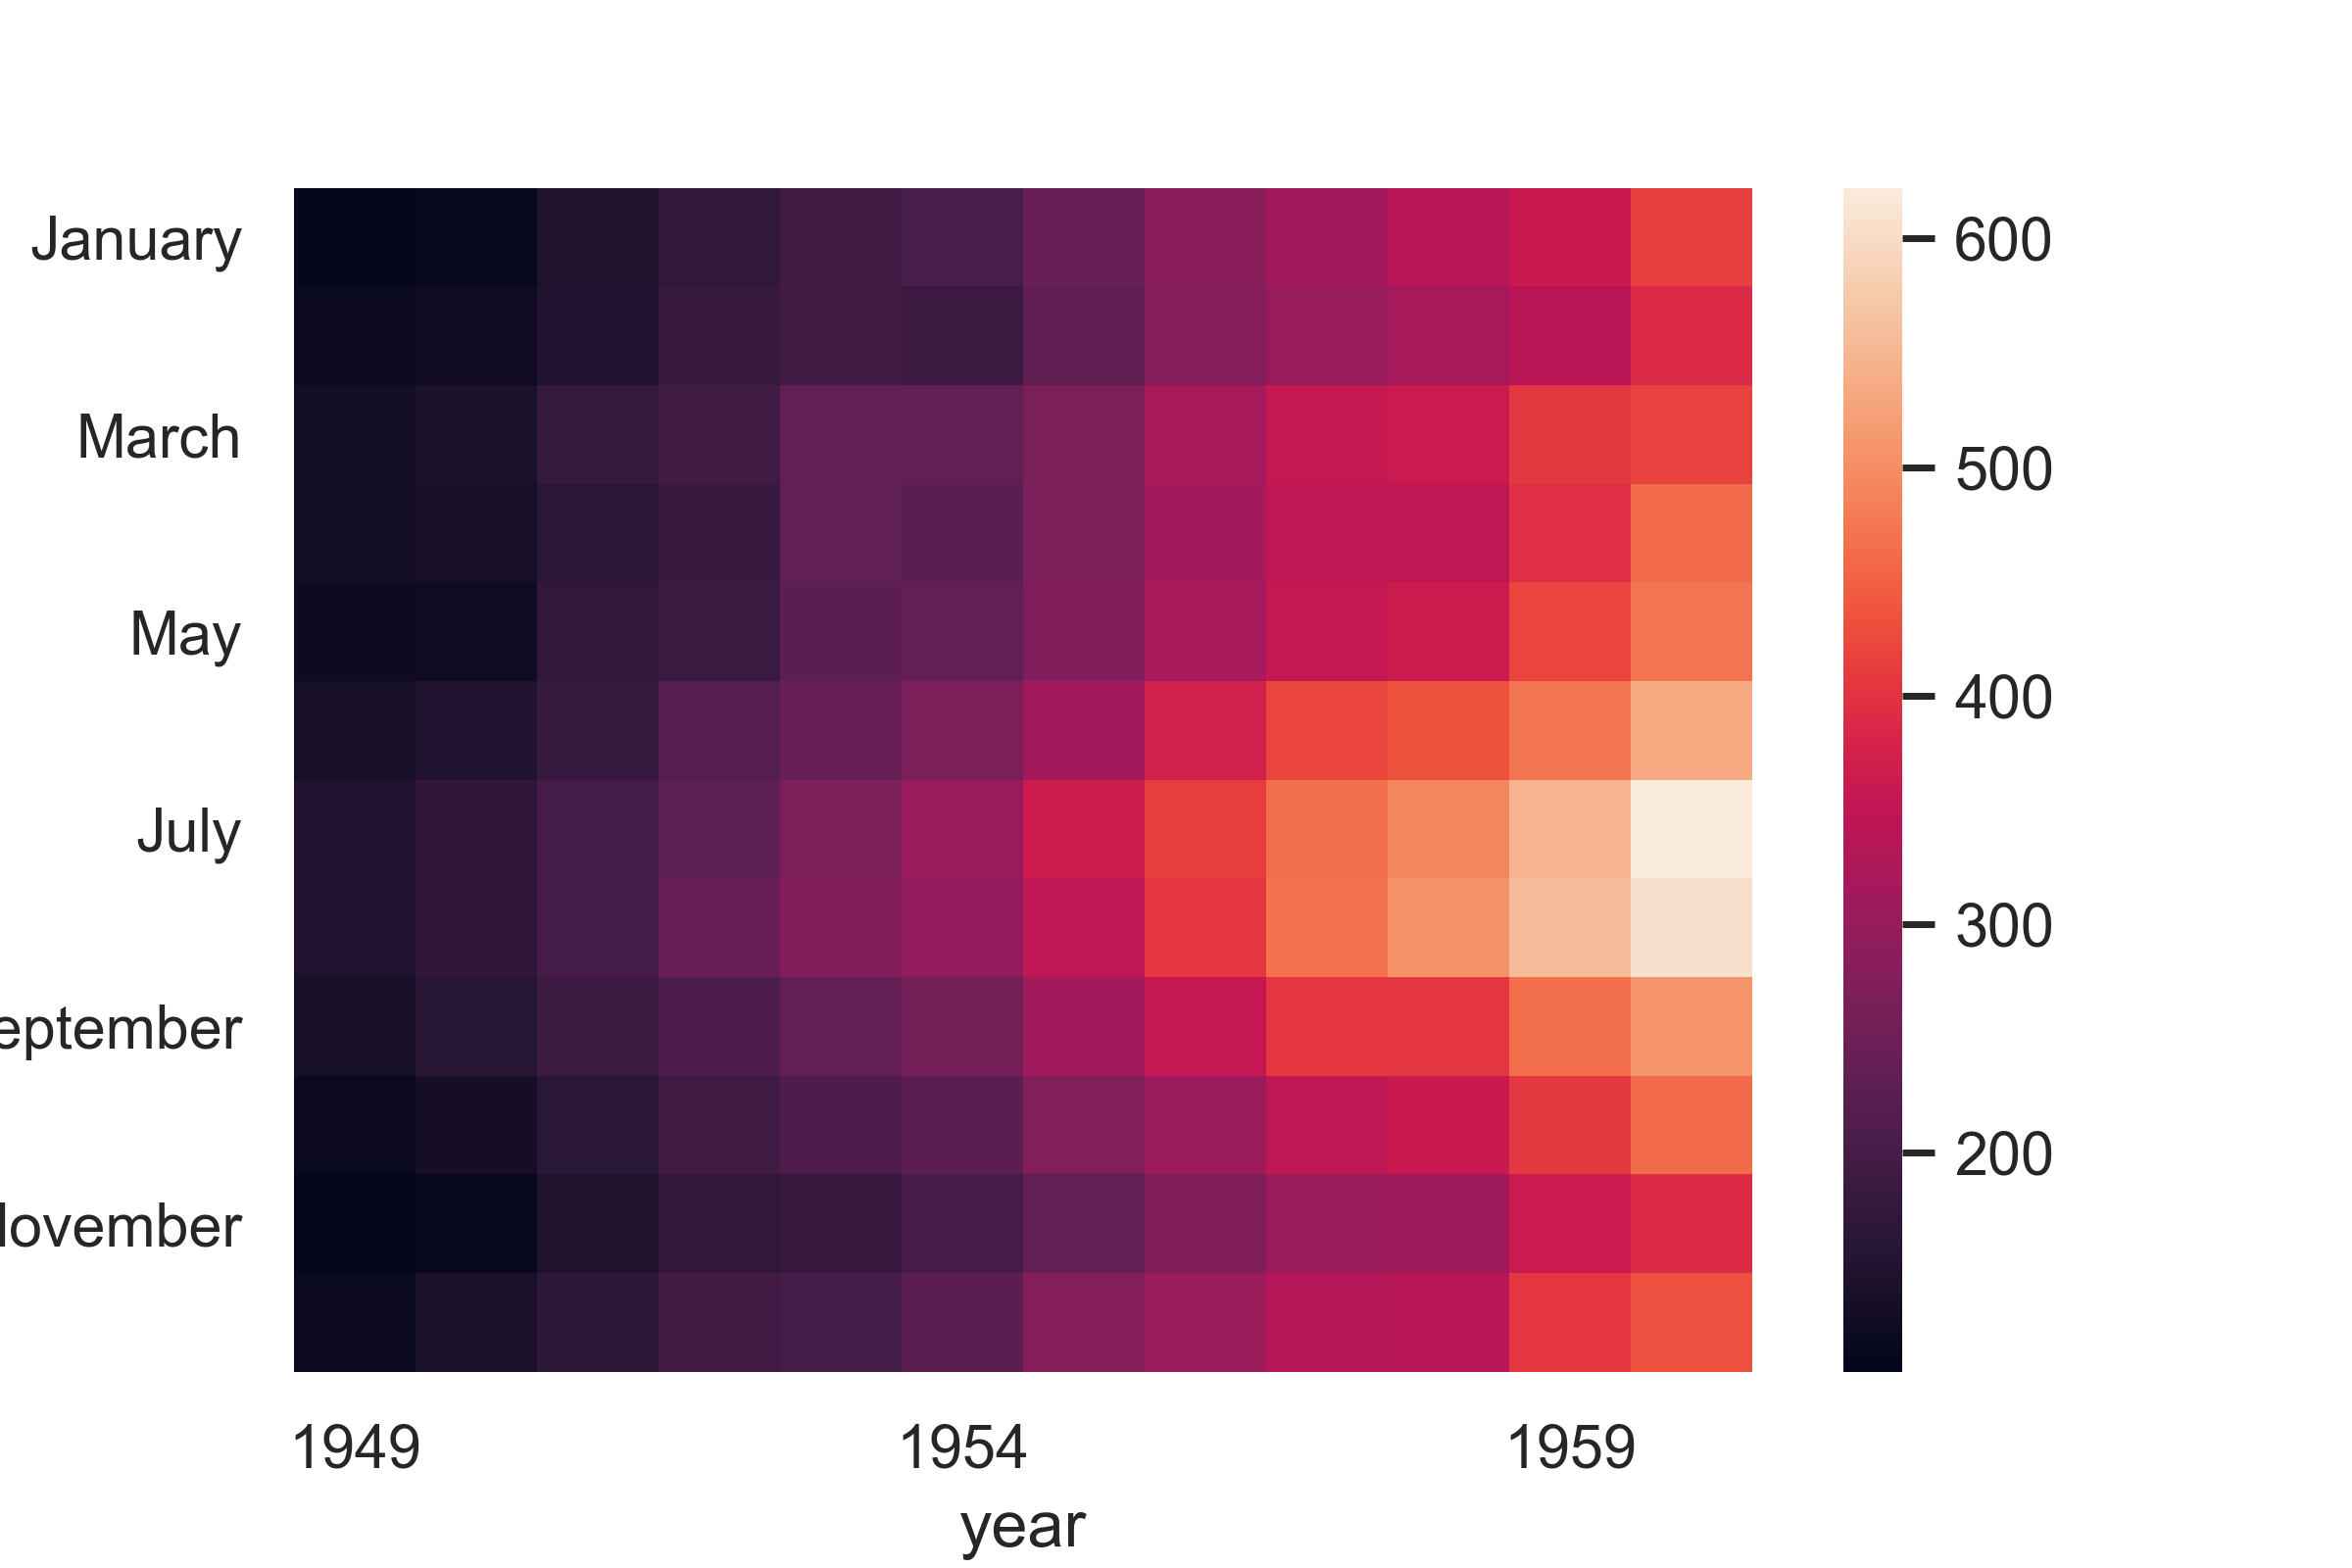
X軸,Y軸の設定 : xticklabels , yticklabels
xticklabels , yticklabelsに数値を指定すると間隔指定になる。
heatmap = sns.heatmap(flights,xticklabels=5, yticklabels=2)
Falseを指定すると、非表示に。
heatmap = sns.heatmap(flights,xticklabels=False, yticklabels=False)
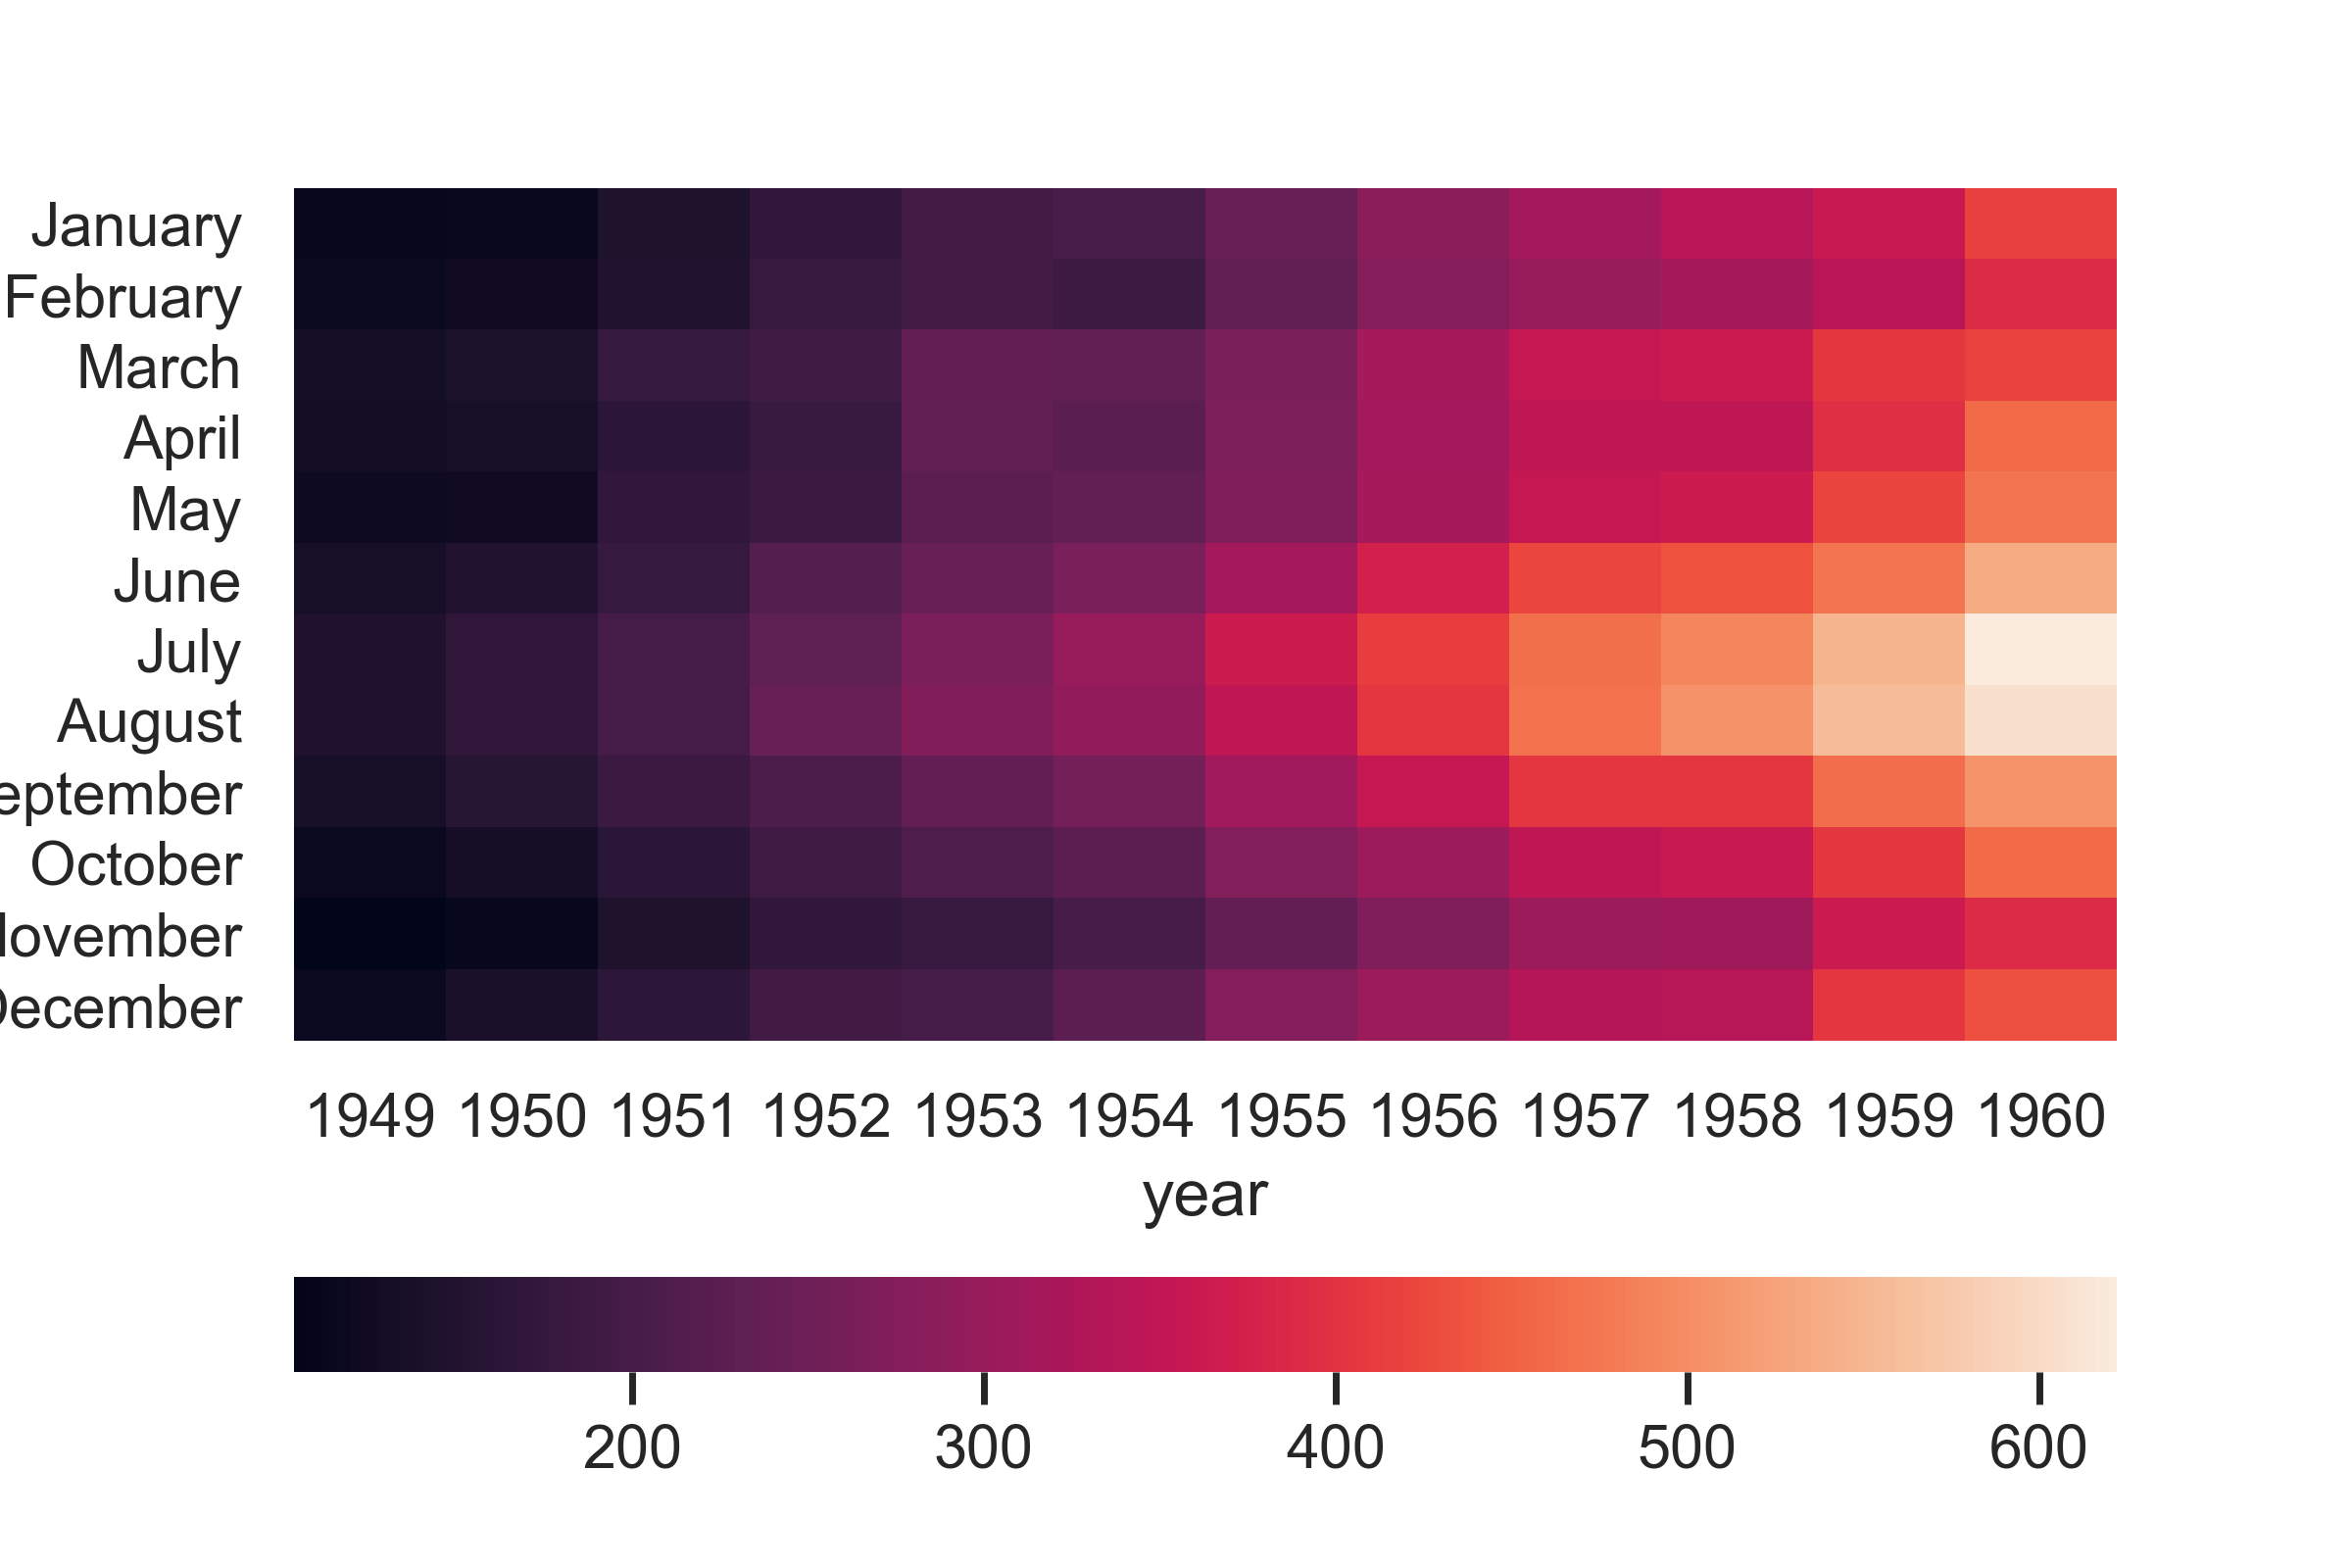
応用編:カラーバーを下に持ってくる。
高さの比が9:1の縦2つのサブプロットを取得し、
それぞれ、ax,cbar_axに指定してやるとヒートマップの下にカラーバーを持ってくることができる。
import matplotlib.pyplot as plt
grid_kws = {"height_ratios": (.9, .1), "hspace": .5}
f, (ax, cbar_ax) = plt.subplots(2, gridspec_kw=grid_kws)
heatmap = sns.heatmap(flights, ax=ax,
                      cbar_ax=cbar_ax,
                      cbar_kws={"orientation": "horizontal"}
                     )
おわりに
冬には温かい色調が良い。
