三菱UFJ国際投信eMAXISのデータをPythonで取得してコードを期初を100としたグラフを作る。
まずライブラリをインポート(使わないのもある)。
# invite my friends to the party...
import numpy as np
import seaborn as sns
sns.set()
import matplotlib.pyplot as plt
import pandas as pd
from datetime import datetime
三菱UFJ国際投信ウェブサイトからcsvを取得して保存。ウェブに何度もアクセスるのはマナー違反なので、取得したファイルを自分のPCに保存。
# 三菱UFJ国際投信ウェブサイトからcsvを取得して保存
import urllib.request

url_list = {'Japan Equity':'https://emaxis.jp/content/csv/fundCsv.php?fund_cd=252634',
            'Emerging Equity':'https://emaxis.jp/content/csv/fundCsv.php?fund_cd=252878',
            'Developed Equity':'https://emaxis.jp/content/csv/fundCsv.php?fund_cd=252653',
            'Japabn Bond':'https://emaxis.jp/content/csv/fundCsv.php?fund_cd=252648',
            'Emerging Bond':'https://emaxis.jp/content/csv/fundCsv.php?fund_cd=260448',
            'Developed Bond':'https://emaxis.jp/content/csv/fundCsv.php?fund_cd=252667',
            'Developed Reit':'https://emaxis.jp/content/csv/fundCsv.php?fund_cd=253674',
            'Japan Reit':'https://emaxis.jp/content/csv/fundCsv.php?fund_cd=253669',
           '8 assets': 'https://emaxis.jp/content/csv/fundCsv.php?fund_cd=252760'}

for key in url_list:
    url = url_list[key]
    title = "{0}.csv".format(key)
    urllib.request.urlretrieve(url,title)
全ファンドのトータル・リターン指数をひとつにまとめたファイルを作成。
(三菱UFJ国際投信のCSVファイルは、分配再投資ベース基準価額がはじめからあるので楽)
# 全ファンドのトータル・リターン指数をひとつにまとめたファイルを作成
assets = ['Japan Equity','Emerging Equity','Developed Equity','Japabn Bond','Emerging Bond'
          ,'Developed Bond','Developed Reit','Japan Reit', '8 assets']
df_all = pd.DataFrame()
for asset in assets:
    asset_file = "{0}.csv".format(asset)
    df = pd.read_csv(asset_file, skiprows = [0,1], names = ['date','nav_void', 'nav','div', 'aum'],
                    parse_dates = True, index_col = 0)

    df['tr'] = df['nav'] / df['nav'].shift(1)
    df[asset] = df['tr'].cumprod()
    df = df.loc[:,[asset, 'div']]

    df_all[asset] = df[asset]

df_all.to_csv('df_all.csv')
トータル・リターン指数をひとつにまとめたファイルを作っておけば、あとは色々使える。
例えば、期初を100とした累積リターン推移グラフは以下の通り。
df = pd.read_csv('df_all.csv')

df = df_all['2019-12-29':]
df_cum = (df / df.iloc[0,:])*100
df_cum.plot(figsize = (6,6),title = "Plot Chart (Start = 100)")
plt.savefig('emaxis_chart',bbox_inches="tight")
↓このようなグラフができる。
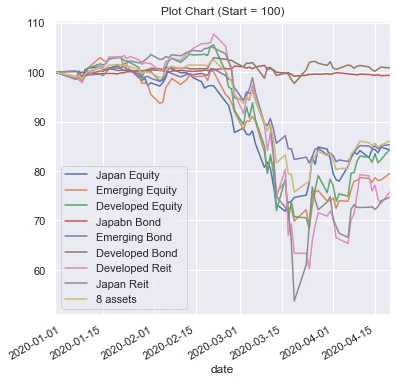
2020年3月以降、日本債券と先進国債券以外は大幅下落。下落した資産に投資するなら、eMAXIS Slim バランス(8資産均等型)が手っ取り早い(※投資は自己責任)。