株価の日足データをpythonで取得したい
ふと、株価データの解析をしてみたくなり、やり方を考えてみました。
株関連の前提知識がないので、本当はこんなことしなくても良いのかも知れません。
でもまあこれでも取得できたので、とりあえず公開します。
手法
以下の3つの行程を経て、データの取得を試みました。
1.pandas.read_html で、日足データを取得
変なサイトは使いたくなかったので、Yahoo Fainance からデータを読み取らせていただくことに。
pandas.read_html というのは、htmlの中から「これ、表っぽいなー」というものを抽出してくれます。なので戻り値は dataframe の入った list です。
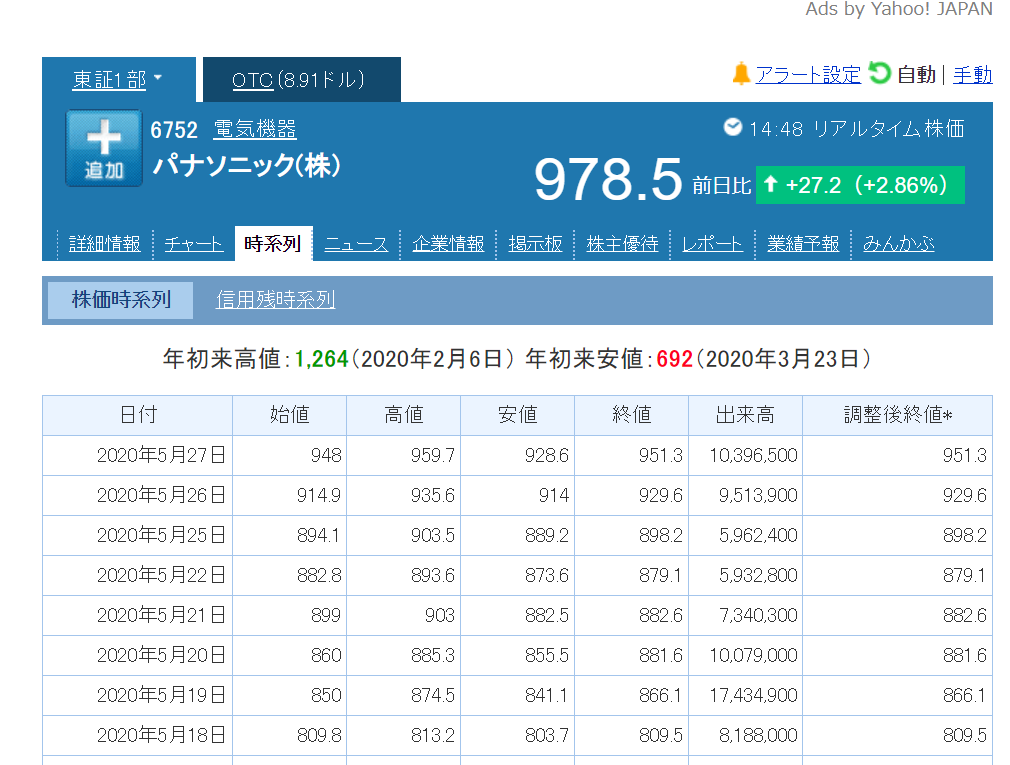
Yahoo Fainance は以下の写真のようなページで、明らかに表は1つなのですが、あくまでも表っぽいものを抽出するので上の「パナソニック(株) 978.5 前日比 ...」みたいなところも抽出します。
その解決策として、取得したい表に合わせてif文でふるいにかけました。
2.datetime関数 で、連続した日付を取得
望みの期間のデータを取得するには、その期間をurlで指定してあげないといけません。
Yahoo Fainance では、一度に20個のデータの表示が限界です。
欲しいデータが20個以下なら、与えられた日付をただurlに埋め込めば全データ取得出来るのですが、それ以上のデータ数が欲しいときにはうまく取得出来ません。
そこで、指定した期間の日付データリストを作成する関数を作って、間の期間でも指定できるようにしようと考えました。
from datetime import datetime
from datetime import timedelta

def daterange(start, end):
	# -----make list of "date"---------------------------
	for n in range((end - start).days):
		yield start + timedelta(n)
	#----------------------------------------------------

start = datetime.strptime(str(day_start), '%Y-%m-%d').date()
end   = datetime.strptime(str(day_end), '%Y-%m-%d').date()

list_days = [i for i in daterange(start, end)]
ここでの start と end はtatetime関数といい、日付専用の関数です。
足したり引いたりすることは出来ません。
datetime.html(n)
datetime.deltaは、datetime関数の日付の足し引きに使われます。
第一引数はdaysなので、ここではstartからendの日数分だけ順に1日ずつ足されてyieldされます。
yieldという関数を見慣れていない人もいるかもしれないので説明すると、yieldというのは戻り値を小分けにして返すことが出来る関数です。
ここでは大したメリットはありませんが、一度に大きなリストが返ってくるような関数だとたくさんのメモリを一度に消費してしまうことになるので、そういうときにyieldはメモリ消費の抑制に貢献してくれます。
グラフの可視化
普通に表示しても良かったのですが、暇つぶしにfft(高速フーリエ変換)したグラフも表示させてみました。
最後にコード
ついでにパナソニックとソニーと日系平均の銘柄コードも記載したので使ってみてください。
import pandas
import numpy as np
import matplotlib.pyplot as plt
import csv

from datetime import datetime
from datetime import timedelta


def get_stock_df(code, day_start, day_end):# (Stock Code, start y-m-d, end y-m-d)
	# -----colmn name------------------------------------
	# 日付、始値、高値、安値、終値、出来高、調整後終値
	#Date, Open, High, Low, Close, Volume, Adjusted Close
	#----------------------------------------------------
	print("<<< Start stock data acquisition >>>")
	print("code:{0}, from {1} to {2}".format(code, day_start, day_end))

	def get_stock_df_under20(code, day_start, day_end):# (Stock Code, start y-m-d, end y-m-d)
		# -----source: Yahoo Finance----------------------------
		# Up to 20 data can be displayed on the site at one time
		#-------------------------------------------------------

		sy,sm,sd = str(day_start).split('-')
		ey,em,ed = str(day_end).split('-')

		url="https://info.finance.yahoo.co.jp/history/?code={0}&sy={1}&sm={2}&sd={3}&ey={4}&em={5}&ed={6}&tm=d".format(code,sy,sm,sd,ey,em,ed)

		list_df = pandas.read_html(url,header=0)

		for i in range(len(list_df)):
			if list_df[i].columns[0] == "日付":
				df = list_df[i]

		return df.iloc[::-1]
		#-------------------------------------------------------


	def daterange(start, end):
		# -----make list of "date"---------------------------
		for n in range((end - start).days):
			yield start + timedelta(n)
		#----------------------------------------------------


	start = datetime.strptime(str(day_start), '%Y-%m-%d').date()
	end   = datetime.strptime(str(day_end), '%Y-%m-%d').date()

	list_days = [i for i in daterange(start, end)]

	pages = len(list_days) // 20
	mod = len(list_days) % 20

	if mod == 0:
		pages = pages -1
		mod = 20

	start = datetime.strptime(str(day_start), '%Y-%m-%d').date()
	end   = datetime.strptime(str(day_end), '%Y-%m-%d').date()

	df_main = get_stock_df_under20(code, list_days[0], list_days[mod-1])

	for p in range(pages):
		df = get_stock_df_under20(code, list_days[20*p + mod], list_days[20*(p+1) + mod-1])
		df_main = pandas.concat([df_main, df])

	print("<<< Completed >>> ({0}days)".format(len(df_main)))
	return df_main


def graphing(f, dt):

	# データのパラメータ
	N = len(f)           # サンプル数
	dt = 1        # サンプリング間隔
	t = np.arange(0, N*dt, dt) # 時間軸
	freq = np.linspace(0, 1.0/dt, N) # 周波数軸

	# 高速フーリエ変換
	F = np.fft.fft(f)

	# 振幅スペクトルを計算
	Amp = np.abs(F)

	# グラフ表示
	plt.figure(figsize=(14,6))
	plt.rcParams['font.family'] = 'Times New Roman'
	plt.rcParams['font.size'] = 17
	plt.subplot(121)
	plt.plot(t, f, label='f(n)')
	plt.xlabel("Time", fontsize=20)
	plt.ylabel("Signal", fontsize=20)
	plt.grid()
	leg = plt.legend(loc=1, fontsize=25)
	leg.get_frame().set_alpha(1)
	plt.subplot(122)
	plt.plot(freq, Amp, label='|F(k)|')
	plt.xlabel('Frequency', fontsize=20)
	plt.ylabel('Amplitude', fontsize=20)
	plt.ylim(0,1000)
	plt.grid()
	leg = plt.legend(loc=1, fontsize=25)
	leg.get_frame().set_alpha(1)
	plt.show()


nikkei = "998407.O"
panasonic = "6752.T"
sony = "6758.T"

# code info "https://info.finance.yahoo.co.jp/history/?code="


df = get_stock_df(panasonic,"2016-5-23","2019-5-23")
# graphing(df["終値"],1)
csv = df.to_csv('./panasonic.csv', encoding='utf_8_sig')

