ArcPy とは
ArcGISでPythonを使う方法は複数あります。(Python window, Python script tool, Python toolbox, Python addin, ArcGIS for Python via Jupyterなど) このうち、モデルビルダー(Model builder)のように既存のジオプロセシングツール(geoprocessing tool)を複数組み合わせられるだけでなく、条件分岐(conditional logic)を含んだ処理の自動化を可能にするのがスクリプトツール(Script tool)であり、Pythonがジオプロセシングツールにアクセスするためのクラス・関数を提供するモジュール(もしくはパッケージ)がArcPyです。スクリプトツールを使うことで、ジオプロセシングツールを自作することができます。
スクリプトツール(Script tool)の作り方
スクリプト ツールの作成
Setting script tool parameters
Alphabetical list of ArcPy functions (ESRI)
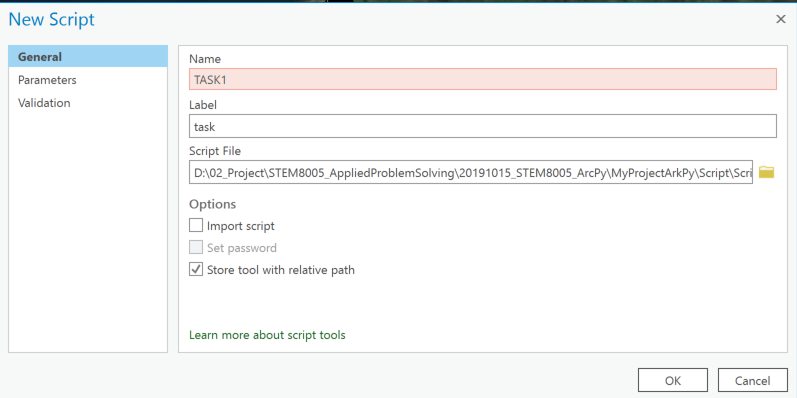
Pythonスクリプトを作成し、**[カタログペイン]>[ツールボックス]>[対象のツールボックスを右クリック]>[新規]>[スクリプト]からスクリプトファイルを指定します。新規スクリプト設定画面が表示されたら、[一般]>[スクリプトファイル]**で取り込みたいスクリプトファイルを指定します。

スクリプトでは以下のようにGetParameterAsText()関数を使って取得したいデータを変数に格納します。
# Get parameters
theBoundary = arcpy.GetParameterAsText(0)
theCont = arcpy.GetParameterAsText(1)
theSpot = arcpy.GetParameterAsText(2)
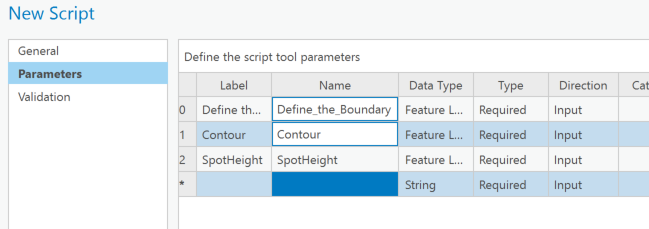
パラメータ設定で番号(Pythonなので0はじまり)に応じてパラメータを設定します。ラベルにパラメータ名を入力し、データタイプで、数値で入れるか、既存レイヤーを取得するかなどの設定ができます。

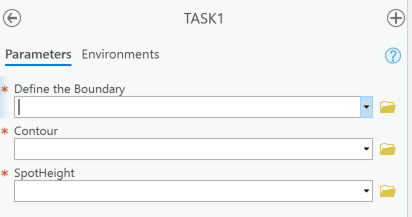
上図のように設定をすると、下図のようなジオプロセシングツールが作成されます。

洪水予測をスクリプトツールで自動化してみた
一連の地理情報解析を複数のスクリプトツールに落とし込むやり方を、実際に以下の洪水予測を参考にした事例で示したいと思います。Spatial Analyst Extensionを用いています。
Learn ArcGIS Lesson: 単位流量図を使用した洪水の予測
[要件]
- ArcGIS Pro
- Spatial Analyst Extension
[使っているデータおよび調査エリア]
ESRIの学習コースでは、アメリカ合衆国バーモント州Stoweにある一支流の集水域(Catchment)で解析を行っていますが、本プロセスではオーストラリア南オーストラリア州南部の一河川の集水域を対象としています。
作業一覧と自動化/マニュアル操作の峻別
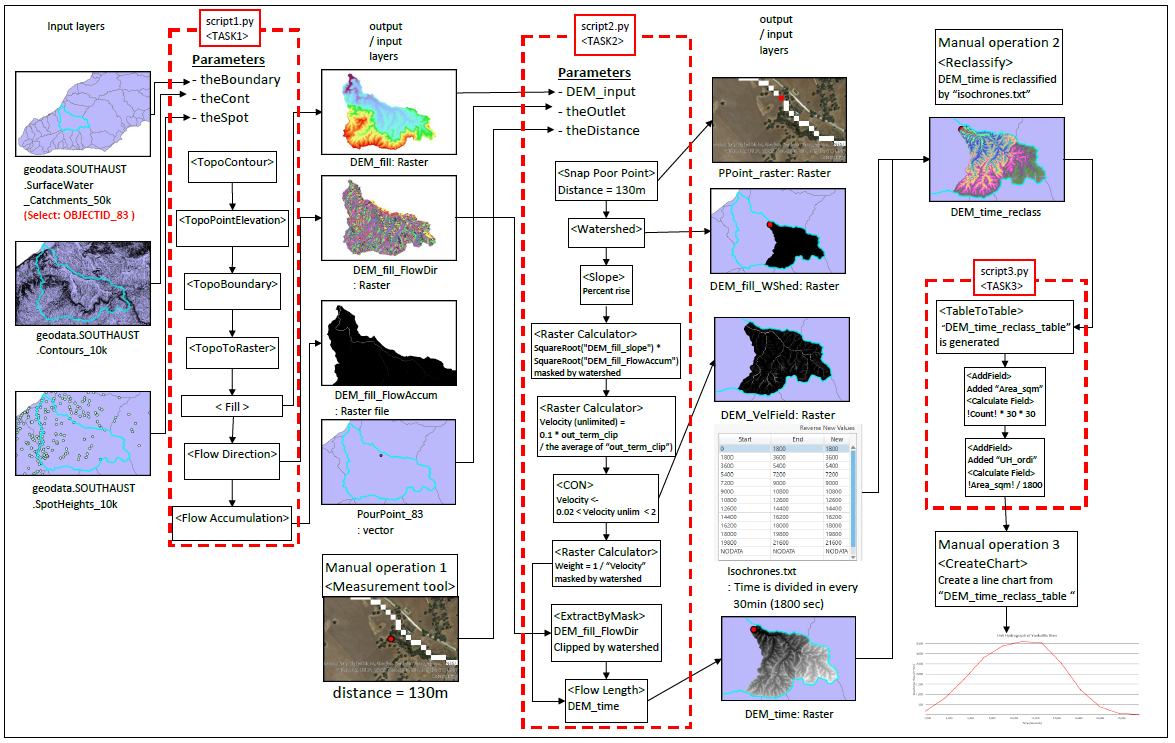
すべて自動化できれば本望ですが、どうしても手作業で入力しなければならないこと、ArcPyで自動化するよりは手でやってしまったほうが早かったり便利だったりすることはマニュアル操作せざるを得ません。今回は一連の作業を3つスクリプトツール(TASK1-3)に分け、合間と最終成果作成に手作業を追加しました。
TASK1(Script1.py)
- Parameter1: 調査対象域(theBoundary)を入力
- Parameter2: 等高線データ(theCont)を入力
- Parameter3: 地点標高データ(theSpot)を入力
- 地点標高データと等高線データから調査対象域のDEMを作成(TopoToRaster())
- フロー解析の邪魔となる窪地(シンク)を平滑化してDEM完成(Fill())
- 作成されたDEMから流向ラスターを作成(FlowDirection())
- 累積流量ラスターを作成(FlowAccumulation())
TASK2(Script2.py)
- 手作業:流出点を設定(Pour Point)
- Parameter1: TASK1で作成されたDEM(DEM_input)を入力
- Parameter2: 手作業で作成された流出点データ(theOutlet)を入力
- Parameter3: 流出点を河川にスナップする際の最大距離(theDistance)を指定
- 流出点を河川にスナップ(SnapPourPoint())
- 流出点に寄与する集水域ラスターを作成(Watershed())
- 斜度を算出したのち(Slope())、累積流量ラスターから流出速度をラスター計算機で算出
- Conを使用した条件評価(Con())を用いて、物理的にあり得ない(遅すぎたり早すぎたりする)ラスターを除外
- 水が流路を流れるのにかかる時間を評価し、同時線マップ(isochrone map)を作成
TASK3(Script3.py)
- 手作業:同時線マップ(isochrone map)を30分(1800秒)区切りでテーブル出力するよう指示するテーブル(isochrones.txt)を作成
- Parameter1: isochrones.txtを入力
- Parameter2: テーブル出力先のパスを指定
- 同時線マップを指示した時間刻み(isochrones.txt)でテーブルに変換(TableToTable_conversion())
- 出力したテーブルに面積フィールド(Area_sqm)を追加(AddField_management())し、ラスター計算機で面積を算出
- テーブルに単位流量(Unit Hydrograph Ordinate)フィールド(UH_ordi)を追加(AddField_management())し、ラスター計算機で1800秒当たりの流量を算出
- Parameter2に指定されたパスへテーブルを出力
最終成果作成
出力されたテーブルをもとに、CreateChart機能を用いて流出点における単位流量グラフを作成する
スクリプトツール作成時のコツ
冒頭で必要なモジュールをインポートする
# Import system modules
import arcpy
from arcpy import env
from arcpy.sa import *
各処理の冒頭と終わりにAddMessage()関数を使ってメッセージを表示させることで、今何の処理をしているのかわかるようにする
### Calculate the area of Raster according to each attribute
arcpy.AddMessage("If the resolution of the raster is not 30m, modify the python script")
fieldname = "Area_sqm"
expression = '(!Count! * 30 * 30 )'
arcpy.CalculateField_management(outReclassTable, fieldname, expression)
arcpy.AddMessage("The area of each classes calculated")
実際に用いたスクリプト
TASK1(Script1.py)
# -*- coding: utf-8 -*-
"""
@author: hiro-ishi
TASK1:Script 1
"""

# Import system modules
import arcpy
from arcpy import env
from arcpy.sa import *

# Check out any necessary licenses
arcpy.CheckOutExtension("Spatial")

# Get parameters
theBoundary = arcpy.GetParameterAsText(0)
theCont = arcpy.GetParameterAsText(1)
theSpot = arcpy.GetParameterAsText(2)

# Set env variables
env.overwriteOutput = True

# Set local variables
theBnd = "Boundary"
arcpy.CopyFeatures_management(theBoundary, theBnd)

# Create output variables for names
theClipCont = "Contours_clip"
theClipSpot = "Spotheight_clip"
theDEM = "DEM_fill"
theFDir = "DEM_fill_FlowDir"
theFAccum = "DEM_fill_FlowAccum"

# =============================================================================
# Create and fill a DEM by point data
# =============================================================================
### Clip out contours
arcpy.Clip_analysis(theCont,theBnd,theClipCont)
arcpy.Clip_analysis(theSpot,theBnd,theClipSpot)

# Set topo variables
inContours = TopoContour([[theClipCont, "ELEVATION"]])
inSpotHeight = TopoPointElevation ([[theClipSpot, "ELEVATION"]])
inBoundary = TopoBoundary([theBnd])
inFeatures = [inContours, inSpotHeight, inBoundary]

### Create DEM
arcpy.AddMessage("Creating DEM")
outTTR = TopoToRaster(inFeatures, cell_size = 30)

### Fill DEM and save
arcpy.AddMessage("Running fill")
outFill = Fill(outTTR)
outFill.save(theDEM)

### Add a filled DEM to the current map
aprx = arcpy.mp.ArcGISProject("CURRENT")
aprxMap = aprx.listMaps("Map")[0]
aprxMap.addDataFromPath(outFill)
arcpy.AddMessage("The filled DEM named " + theDEM + " was added to the map")
arcpy.AddMessage("Then, let's delineate the watershed")
TASK2(Script2.py)
# -*- coding: utf-8 -*-
"""
@author: hiro-ishi
TASK2: Script 2
"""

# Import system modules
import arcpy
from arcpy import env
from arcpy.sa import *

# Check out any necessary licenses
arcpy.CheckOutExtension("Spatial")

# Get parameters
DEM_input = arcpy.GetParameterAsText(0)
theOutlet = arcpy.GetParameterAsText(1)
theDistance = arcpy.GetParameterAsText(2)

# Set env variables
env.overwriteOutput = True

# Create output variables for names
theDEM = "DEM_fill"
theFDir = "DEM_fill_FlowDir"
theFAccum = "DEM_fill_FlowAccum"
thePPoint = "PPoint_raster"
theWShed = "DEM_fill_WShed"
theSlope = "DEM_fill_Slope"
sbAc = "DEM_fill_sbAc"
velUnlim = "DEM_VelField_unlim"
velField = "DEM_VelField"
theFDirClip = "DEM_fill_WShed_FlowDir"
theLength = "DEM_time"
isochrones = "DEM_time_isochrones"
isochrones_table = "DEM_time_isochrones_table"

# =============================================================================
# Delineate the watershed
# =============================================================================
### Snap the pour point to raster
arcpy.AddMessage("Let's delineate the watershed")
arcpy.AddMessage("Snapping Poor Point")
outSnapPour = SnapPourPoint(theOutlet, theFAccum, theDistance)
outSnapPour.save(thePPoint)
arcpy.AddMessage("Snapped Poor Point Raster generated")

### Add the Pour point raster to the current map
aprx = arcpy.mp.ArcGISProject("CURRENT")
aprxMap = aprx.listMaps("Map")[0]
aprxMap.addDataFromPath(outSnapPour)
arcpy.AddMessage("The snapped pour point (raster data) was added to the map")

### Deliineate the Watershed
arcpy.AddMessage("Delineating the watershed")
outWatershed = Watershed(theFDir, outSnapPour)
outWatershed.save(theWShed)

### Add the watershed to the current map
aprxMap.addDataFromPath(outWatershed)
arcpy.AddMessage("The watershed area was added to the map")
arcpy.AddMessage("You finished to delineate the watershed")

# =============================================================================
# Create a velocity field
# =============================================================================
### Create a Slope field
arcpy.AddMessage("Calculating slope")
outSlope = Slope(DEM_input, "Percent rise")
outSlope.save(theSlope)

### Raster calculation to acquire sbAc
arcpy.AddMessage("Creating a velocity field")
out_term = SquareRoot(theSlope) * SquareRoot(theFAccum)

### Extract by mask
out_term_clip = ExtractByMask(out_term, theWShed)
out_term_clip.save(sbAc)

### To acquire statistics of the mean slop-area
arcpy.AddMessage("Acquire a Mean Value")
sbAc_mean = arcpy.GetRasterProperties_management(out_term_clip, "MEAN")
arcpy.AddMessage("Mean Value: " + sbAc_mean[0])

### Create a velocity field
# If there is no "float()", the value 15.97.... comes as a string
velField = 0.1 * out_term_clip / float(sbAc_mean[0])
velField.save(velUnlim)

velLower = Con(velUnlim, velUnlim, 0.02, "Value >= 0.02")
velocity = Con(velLower, velLower, 2, "Value <= 2")

arcpy.AddMessage("Velocity Field was acquired!!")

# =============================================================================
# Create an isochrone map
# =============================================================================
### Raster calculator
arcpy.AddMessage("Acquiring weight raster")
outWeight = 1 / velocity

theFDir_clip = ExtractByMask(theFDir, theWShed)
theFDir_clip.save(theFDirClip)

### Create a Flow length field
arcpy.AddMessage("Acquiring flow length")
outFlowLength = FlowLength(theFDirClip, "downstream", outWeight)
outFlowLength.save(theLength)

### Add the flow length field to the current map
aprxMap.addDataFromPath(outFlowLength)
arcpy.AddMessage("The flowtime map named " + theLength + " was added to the map")

arcpy.AddMessage("Finish")
DEM_time_max = arcpy.GetRasterProperties_management(outFlowLength, "MAXIMUM")
arcpy.AddMessage("The time it takes water to flow to the outlet ranges from 0 seconds (rain that falls on the outlet itself) to " + DEM_time_max[0] + "seconds!!")
arcpy.AddMessage("Finally, let's reclassify the table to create a graph of a Hydrograph!! Let's go to the script3")
TASK3(Script3.py)
# -*- coding: utf-8 -*-
"""
@author: hiro-ishi
TASK3:Script3
"""

# Import system modules
import arcpy
from arcpy import env
from arcpy.sa import *

# Check out any necessary licenses
arcpy.CheckOutExtension("Spatial")

# Set env variables
env.overwriteOutput = True

# Get parameters
in_raster = arcpy.GetParameterAsText(0)
tableoutpath = arcpy.GetParameterAsText(1)

# Create output variables for names
isochrones = "DEM_time_reclass"
isochrones_table = "DEM_time_reclass_table"

# =============================================================================
# Create a unit hydrograph
# =============================================================================
### Convert a raster attribute into a table
outReclassTable = arcpy.TableToTable_conversion(in_raster, tableoutpath, isochrones_table)
arcpy.AddMessage( isochrones_table + ".dbf was saved to the folder")

### Add a Field
arcpy.AddField_management(outReclassTable, "Area_sqm", "DOUBLE", field_alias = "Area(Sq.Meters)")
arcpy.AddMessage("A field added")

### Calculate the area of Raster according to each attribute
arcpy.AddMessage("If the resolution of the raster is not 30m, modify the python script")
fieldname = "Area_sqm"
expression = '(!Count! * 30 * 30 )'
arcpy.CalculateField_management(outReclassTable, fieldname, expression)
arcpy.AddMessage("The area of each classes calculated")

### Add Field
arcpy.AddField_management(outReclassTable, "UH_ordi", "DOUBLE", field_alias = "UnitHydrographOrdinate")
arcpy.AddMessage("A field added")

### Calculate the area of Raster according to each attribute
fieldname = "UH_ordi"
expression = '(!Area_sqm! / 1800 )'
arcpy.CalculateField_management(outReclassTable, fieldname, expression)
arcpy.AddMessage("Unit Hydrograph Ordinate was calculated")

### Add the table to the current map
aprx = arcpy.mp.ArcGISProject("CURRENT")
aprxMap = aprx.listMaps("Map")[0]
aprxMap.addDataFromPath(outReclassTable)

arcpy.AddMessage("Then, please create a graph manually.")
