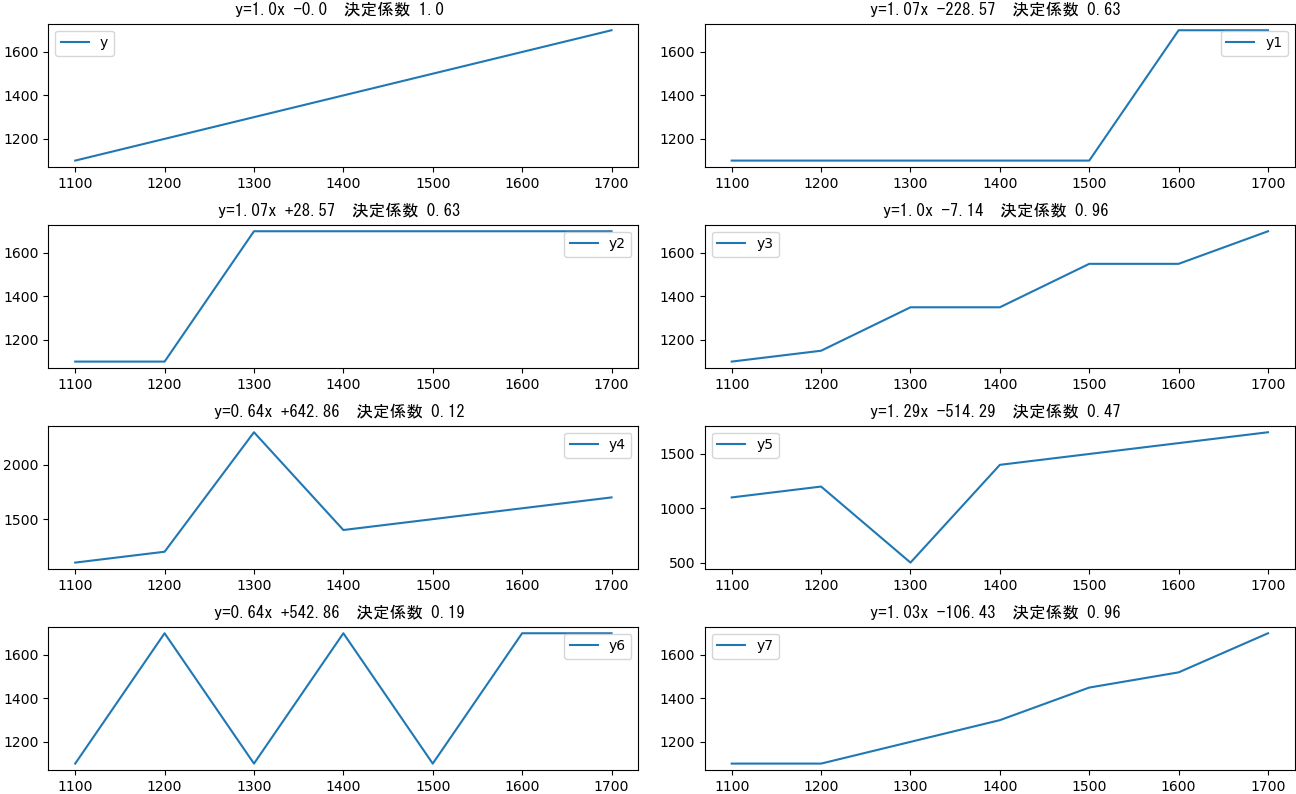
線形回帰分析は、与えあれたデータが最も近似する直線の式と、その式に与えられたデータがどれくらい近いかを算出してくれます。(雑な解釈ですが・・・)今回、以下のソース中のy - y7で示される曲線に対し線形回帰分析を行い、決定係数の違いを確認しました。yは、直線そのものですが、y1-y7は曲線になっています。
ソース
import pandas as pd
from sklearn.linear_model import LinearRegression

import matplotlib.pyplot as plt


# データ準備
dt={
    "x"  :[1100 , 1200 , 1300 , 1400 , 1500 , 1600 , 1700 ]  ,
    "y"  :[1100 , 1200 , 1300 , 1400 , 1500 , 1600 , 1700 ]  ,
    "y1" :[1100 , 1100 , 1100 , 1100 , 1100 , 1700 , 1700 ]  ,
    "y2" :[1100 , 1100 , 1700 , 1700 , 1700 , 1700 , 1700 ]  ,
    "y3" :[1100 , 1150 , 1350 , 1350 , 1550 , 1550 , 1700 ]  ,
    "y4" :[1100 , 1200 , 2300 , 1400 , 1500 , 1600 , 1700 ]  ,
    "y5" :[1100 , 1200 ,  500 , 1400 , 1500 , 1600 , 1700 ]  ,
    "y6" :[1100 , 1700 , 1100 , 1700 , 1100 , 1700 , 1700 ]  ,
    "y7" :[1100 , 1100 , 1200 , 1300 , 1450 , 1520 , 1700 ]  ,
    }

# 描画位置
pos={
    "y" :[0,0]  ,
    "y1":[0,1]  ,
    "y2":[1,0]  ,
    "y3":[1,1]  ,
    "y4":[2,0]  ,
    "y5":[2,1]  ,
    "y6":[3,0]  ,
    "y7":[3,1]  ,
}


yset=list(dt.keys())
yset.remove("x")
yset.sort()

x=pd.DataFrame(dt["x"])


# 描画関連初期化
len_yset=len(yset)
fig, ax = plt.subplots(int(len_yset/2),2  , figsize=(13,8),constrained_layout=True )  # Create a figure and an axes.

for y_val in yset :
    y=pd.DataFrame(dt[y_val])

    #線形回帰モデルの実行

    #model = LinearRegression(fit_intercept=False)     #線形回帰モデルの呼び出し(切片は計算に使用しない)
    model = LinearRegression()          #線形回帰モデルの呼び出し
    model.fit(x   , y)                  #モデルの訓練

    coef=round(model.coef_[0][0] ,2)              #回帰変数
    intercept=round(model.intercept_[0] ,2)       #回帰直線の切片
    score=round(model.score(x,y) ,2)              #決定係数


    #text出力
    print("{} : y={}x {:+}  決定係数 {} ".format(y_val , coef ,intercept ,score))

    #描画
    ax[pos[y_val][0] , pos[y_val][1] ].plot(dt["x"] , dt[y_val]  , label= y_val)
    ax[pos[y_val][0] , pos[y_val][1] ].set_title("y={}x {:+}  決定係数 {} ".format(coef ,intercept ,score) , fontname="MS Gothic")  # Add a title to the axes.
    ax[pos[y_val][0] , pos[y_val][1] ].legend()  # Add a legend.
plt.show()
結果
| y | 式 | 決定係数 |
|---|---|---|
| y | y=1.0x -0.0 | 1.0 |
| y1 | y=1.07x -228.57 | 0.63 |
| y2 | y=1.07x +28.57 | 0.63 |
| y3 | y=1.0x -7.14 | 0.96 |
| y4 | y=0.64x +642.86 | 0.12 |
| y5 | y=1.29x -514.29 | 0.47 |
| y6 | y=0.64x +542.86 | 0.19 |
| y7 | y=1.03x -106.43 | 0.96 |
直線のy=1、直線に近いもの(y3,y7)は決定係数が1に近いが、それ以外は、0.6以下となっている。やっぱ、「決定係数」と言うだけのことはある。
回帰分析についての、私なりの素人解釈になりましたが、間違い等ありましたら指摘していただけると助かります。
参考
LinearRegression クラスについてメモ
sklearn.linear_model.LinearRegression
