Unityゲーム画面にProfiler機能っぽいのを作る
概要
ゲーム内で計測したもしくはプロファイラから受け取った計測時間を波形としてゲーム画面に出力する
実際にやってみた結果、それっぽいのができました
画像の説明
1段目のグラフはCPU、BehaviourUpdate、LateUpdateなどのスクリプトの計測結果をミリ秒で出力しています
2段目のグラフは上記のスクリプトの計測以外のCPUの計測結果です。こちらの波形がProfilerのCPU項目の波形とほぼ一致します
3段目のグラフはProfiler.GetMonoHeapSizeLong()から受け取ったメモリ量をグラフにしています
実際に作成したものはこちらにあります
環境
- Unity2019.1とUnity2017.4で試しています
計測方法
- Unity2018で追加されたPlayerLoopを利用して、対象の処理の前後に計測部分を追加して
Time.realtimeSinceStartupを利用して時間をはかる方法参考 GitHub:MainLoopProfilingSample - Recorderを利用してProfilerから対象の処理時間を取得する方法 参考 【Unity】CPUプロファイラに表示されるの項目をスクリプトで取得する
以上、2通りの方法があります
2通りあるのですが、実際2つの方法に差異があるのかと思い、同じ項目を試してみました。
ScriptUpdateに関してはどちらも大体計測結果同じでした。
青線がRecoderによる値
赤線がPlayerLoopの値となります
Recorderを利用した計測
CustomSample
UnityDocumentation
一定区間の実行時間の計測に利用する
BeginのオーバーヘッドがProfiler.Beginよりも少ないそうです
// 独自の区間を計測する場合は、自分で名前を付ける
CustomSampler sampler1 = CustomSampler.Create("MyCustomSampler");
// 静的プロファイラを計測する場合はGetを使用する
CustomSampler sampler2 = CustomSampler.Get("BehaviourUpdate");

sampler1.Begin();
Progress(); // 計測したい処理
sampler1.End();

if(sampler1.isValid)
{
    // Recorderを取得して処理時間を取得する
    Debug.Log($"{sampler1.GetRecorder().elapsedNanoseconds} nsec");
    Debug.Log($"{sampler2.GetRecorder().elapsedNanoseconds} nsec");
}
Recorder
UnityDocumentation
CustomSamplerなどから取得でき、プロファイリングデータを記録す
Recorder recorder = Recording.Get("Update.ScriptRunBehaviourUpdate");
recorder.enabled = true;  // マニュアルにはこう書いてあるが、なくても動いてるがいちおう
long nsec = recorder.elapsedNanoseconds; // 計測時間がナノ秒で取得できる
計測項目
Recorderを利用してProfilerの計測結果を受け取る方式の場合は、静的プロファイラのラベルを指定することで取得が可能です
プロファイラのラベルとはプロファイラウィンドウのCPU項目にあるOverviewにある名前のことです
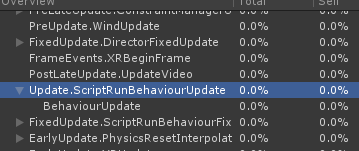
Unity2018以降ではこちらのスライドで紹介してあるPlayerLoopを利用して対象の処理ループの前後に計測用のループを追加して直接計測する方法
Unity2018以前のバージョンでは実機でのデータ取得の場合、Update.ScriptRunBehaviourUpdateではなく、その一つ下の階層のBehaviourUpdateで指定する必要がある
Editorでは通常通り撮れるのでわかりずらかった
CPU Unity2018 以降
- Update.ScriptRunBehaviourUpdate
- PreLateUpdate.ScriptRunBehaviourLateUpdate
- FixedUpdate.ScriptRunBehaviourFixedUpdate
- Update.ScriptRunDelayedDynamicFrameRate
CPU Unity2017
- BehaviourUpdate
- LateBehaviourUpdate
- FixedBehaviourUpdate
- CoroutinesDelayedCalls
その他 参考
- Animation
- PreLateUpdate.DirectorUpdateAnimationBegin
- PreLateUpdate.DirectorUpdateAnimationEnd
- Physices
- FixedUpdate.PhysicsFixedUpdate
- Rendering
- ostLateUpdate.FinishFrameRendering
ラベルの取得
現在、計測値が取得できるサンプラ名を取得できる
List<string> names = new List<string>();
int nameCount = Sampler.GetNames(names);
foreach(var name in names)
{
  Debug.Log(name);
}
計測したデータの保持
先入れ先出しデータとして、最初はQueueを利用試したが遅かったので
普通に、配列を使うことにしました
private float[] Data = new float[300];
public void Update(float data)
{
  for (int i = 0; i < Data.Length; i++)
  {
    if (i + 1 < Data.Length)
    {
      Data[i] = Data[i + 1];
    }
  }

  Data[Data.Length - 1] = data;
}
PlayerLoopを利用した計測方法
こちらのGitHubを参考にさせていただきました
詳しくはこちらを参照してください
MainLoopProfilingSample
描画方法
Unityでグラフを各方法として、
- Assetsを利用する
- LineRendererを利用する
- GLを利用する
できれば、Unity標準の機能だけでやりたい
- LineRendererでやってみた -> 線が汚かった
- GLでやってみた
グラフの描画
GLを利用してグラフを描画します
Unityの公式に従って描画の準備をします
事前準備
// GL描画用マテリアル設定
Shader shader = Shader.Find("Hidden/Internal-Colored");
_lineMaterial = new Material(shader) { hideFlags = HideFlags.HideAndDontSave };
_lineMaterial.SetInt("_SrcBlend", (int)UnityEngine.Rendering.BlendMode.SrcAlpha);
_lineMaterial.SetInt("_DstBlend", (int)UnityEngine.Rendering.BlendMode.OneMinusSrcAlpha);
_lineMaterial.SetInt("_Cull", (int)UnityEngine.Rendering.CullMode.Off);
_lineMaterial.SetInt("_ZWrite", 0);
グラフ描画
// グラフ描画
GL.PushMatrix();
{
  // Matrial Apply
  _lineMaterial.SetPass(0);

  // 補助線の描画
  GL.Begin(GL.LINES);
  {
    // 入力されたデータの最大値をもとに補助線の数を決定する
    cellHeight = rect.height * interval / maxValue;
    gridCount = (int)(maxValue / interval);
    var ans = maxValue % interval;
    if (!(ans < 0 || 0 < ans))
    {
      gridCount -= 1;
    }

    if (gridCount >= 10)
    {
      cellHeight = rect.height / 10f;
      gridCount = 10;
    }

    for (int i = 1; i <= gridCount; i++)
    {
      var line = collectPosY + rect.height - i * cellHeight;
      // 実際に線を描画する
      GL.Vertex3(collectPosX, line, 0);
      GL.Vertex3(collectPosX + rect.width, line, 0);
    }
  }
  GL.End();

  for (int i = 0; i < datas.Length; i++)
  {
    // データグラフの描画
    GL.Begin(GL.LINE_STRIP);
    {
      // グラフの色
      Color color = datas[i].Color;

      for (int j = 0; j < datas[i].Data.Length; j++)
      {
        GL.Color(color);
        GL.Vertex3(
          collectPosX + rect.width / (datas[i].Data.Length - 1) * j,
          collectPosY + rect.height * (1 - datas[i].Data[j] / maxValue),
          0);
      }
    }
    GL.End();
  }
}
GL.PopMatrix();
欠点
- OnGUIを使っているのでGCが起きる