https://github.com/kaepa3/imaging
とセミ連動中
今日のお題
- ヒストグラムの出力
テキストの方はついに「コードは空白になっています」とか言ってます。
タイトルからすると、そう言ったコードがあるのがウリの本じゃないのかと思いつつ
やってきます。
ヒストグラムの出力
とりあえず、グラフは以下のを参考にする。
http://takedajs.hatenablog.jp/entry/2016/04/03/094529
この辺
	"github.com/gonum/plot"
	"github.com/gonum/plot/plotter"
	"github.com/gonum/plot/plotutil"
を使うということでgo get
$ go get github.com/gonum/plot
bezierがないそうなので、追加
$ go get github.com/biogo/graphics/bezier
ソースコード
func (ef *effect) Histogram() {
	//	グラフの準備
	p, _ := plot.New()
	p.Title.Text = "histogram"
	p.X.Label.Text = "X"
	p.Y.Label.Text = "Y"
	//プロットの準備
	// 先に入れ物を作る
	const ColorSize = math.MaxUint8 + 1
	var dataSet [RGBAMax][ColorSize]uint16

	ef.imageLoop(ef.inputImage.Bounds(), func(x, y int) color.RGBA64 {
		//画素をそれぞれ数える
		r, g, b, a := ef.inputImage.At(x, y).RGBA()
		dataSet[IndexR][getIndex(r)]++
		dataSet[IndexG][getIndex(g)]++
		dataSet[IndexB][getIndex(b)]++
		dataSet[IndexA][getIndex(a)]++
		return color.RGBA64{0, 0, 0, 0}
	})
	// 各値グラフのプロット
	for key, v := range dataSet {
		if key == IndexA {
			continue
		}
		var line plotter.XYer
		plots := make(plotter.XYs, ColorSize)
		line = plots
		for i := 0; i < len(v); i++ {
			plots[i].X = float64(i)
			plots[i].Y = float64(v[i])
		}
		graph, _, _ := plotter.NewLinePoints(line)
		graph.Color = plotutil.Color(key)
		p.Add(graph)
		p.Legend.Add("line:"+strconv.Itoa(key), graph)

	}
	p.Save(5*vg.Inch, 5*vg.Inch, "sampleimage/line_sample.png")
	return
}
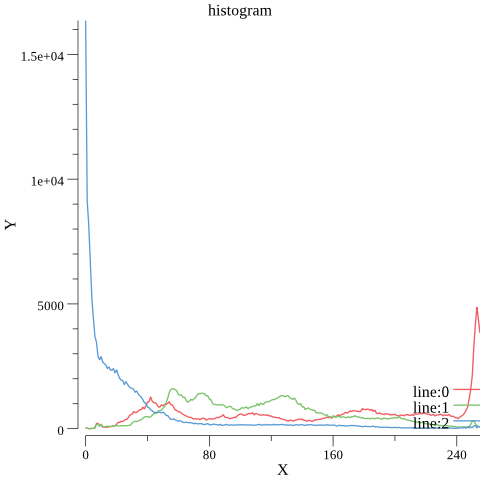
画像の構成要素をカウントしてプロットしているだけですね。
plotのライブラリ見ているとimage.Imageを返せそうだけど、対応はそのうち。
もしくは学習用だしやらない。し、それなら関数分けたい。
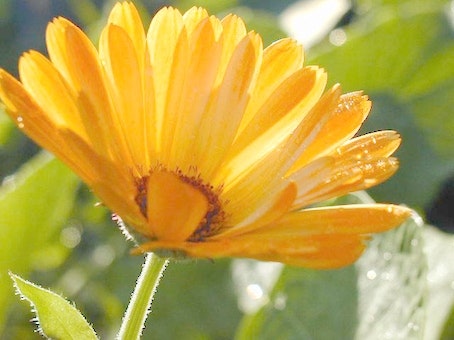
出力画像
線形濃度変換
ヒストグラムで255階調だと100〜200までしか使ってない。そう言った場合に基準の100を0として、200を255としたらコントラストがはっきりするんでないの?っていう話だと思う。
$ Z' = Z_{max} \times \bigr(\frac{Z-a}{b-a}\bigl)$
数式眺めると今のZの値はaからbの何分の1でしょうか?という話ですね。
文字より数式眺めた方が良いですな。
ソースコード
aとbの値は今回固定としています。
func (ef *effect) LinearDensity() image.Image {
	con := func(val uint32) uint16 {
		var levelA uint16 = 0x10
		var levelB uint16 = 0xFF00

		v := math.MaxUint16 * (float64((uint16(val) - levelA)) / float64((levelB - levelA)))
		if v > math.MaxUint16 {
			v = math.MaxUint16
		} else if v < 0 {
			v = 0
		}
		return uint16(v)
	}
	return ef.imageLoop(ef.inputImage.Bounds(), func(x, y int) color.RGBA64 {
		r, g, _, a := ef.inputImage.At(x, y).RGBA()
		return color.RGBA64{con(r), con(g), con(g), uint16(a)}
	})
}
特出すべきは先の数式と比較してa以下の値、b以上の画素が含まれた場合のif文が追加されています。aが10としても8とかの数値がある可能性があるので、その対策ですね。
あと、float64にしないと桁落ちの誤差で出力が死にます。なるほどなという感じです。
出力画像
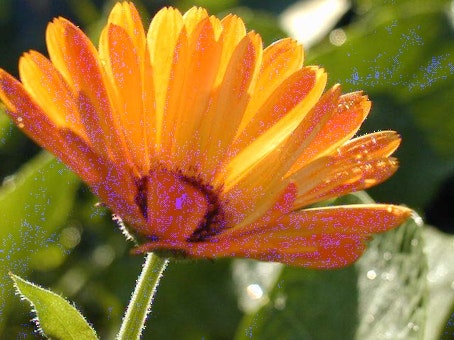
さっきのヒストグラムから青の要素がないのにフィルタしてるからノイズが乗ると。
実用を考えたらRGBそれぞれの値に対して設定値(aとb)が必要になるんでしょうな。
非線形な濃度変換
明るさだそうな。
$ Z' = Z_{max} \times \bigr(\frac{Z}{Z_{max}}\bigl)^γ$
γの値が1より大きいと暗くなって、それより小さければ明るくなると。
明るくする場合は元画像のrの値が2なら4にするみたいな感じだと思う。
全部ヒストグラム見ながら作業しろって話なんだろうけど、面倒だからまた今度。
ソースコード
conの内容変えるだけなので、そこだけ抽出
	con := func(val uint32) uint16 {
		gamma := 0.5
		v := math.MaxUint16 * math.Pow(float64(val)/float64(math.MaxUint16), gamma)
		if v > math.MaxUint16 {
			v = math.MaxUint16
		} else if v < 0 {
			v = 0
		}
		return uint16(v)
	}
出力結果
コントラスト改善
Zmax/2より大きい場合は以下の式で与えられ
$ Z' = \frac{Z_{max}}{2} \times \sqrt{\frac{2Z - Z_{max}}{Z_{max}}} $
小さい時は
$ Z' = Z_{max} \times \bigr(\frac{Z}{Z_{max}}\bigl)^2$
とする。
ソースコード
con := func(val uint32) uint16 {
	maxUint := float64(math.MaxUint16)
	var v uint16
	if val > math.MaxUint16/2 {
		v = uint16((maxUint / 2.0) * (1.0 + math.Sqrt((2.0*float64(val)-maxUint)/maxUint)))
	} else {
		// 非線形濃度変換
		v = unlinerCon(val, 2)
	}
	if v > math.MaxUint16 {
		v = math.MaxUint16
	} else if v < 0 {
		v = 0
	}
	return uint16(v)
}
出力結果
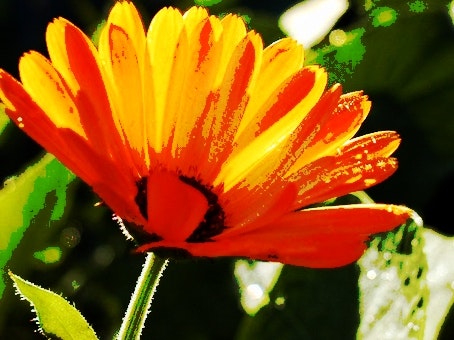
この辺をスライダーとかでできるものを作らんと、今後だるいのかもしれない。
けどサンプルとニアリーだから良いという方向
ヒストグラムの平坦化
ここに関しては式をあてにするのが正解だった数式は以下にあります。
http://ipr20.cs.ehime-u.ac.jp/column/gazo_syori/chapter2.html
ではソースコード
// ヒストグラム平均化
func (ef *effect) AverageHistogram() image.Image {
	rect := ef.inputImage.Bounds()
	//ヒストグラムの取得
	_, _, _, hisL := ef.makeHistogramData()
	//lookupTBLの作成
	luTbl := createLookupTable(hisL, rect)
	//描画
	var buf effect
	buf.inputImage = ef.imageLoop(rect, func(x, y int) color.RGBA64 {
		r, g, b, a := ef.inputImage.At(x, y).RGBA()
		return color.RGBA64{luTbl[r], luTbl[g], luTbl[b], uint16(a)}
	})
	//	画像の作成
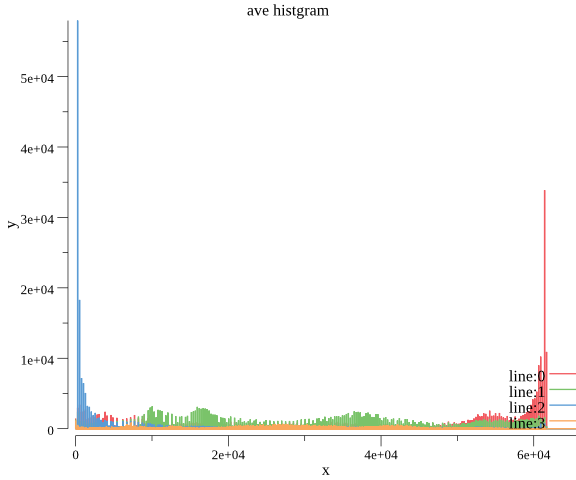
	buf.Histogram("ave histgram", "x", "y", "sampleimage/hist_ave.png")
	return buf.inputImage
}
変換テーブル作成
func createLookupTable(his [ColorWidth]uint16, rect image.Rectangle) (table [ColorWidth]uint16) {
	var sum, val uint16
	//平均画素数
	average := uint16(((rect.Size(). * rect.Size().Y) / ColorWidth) + 1)
	//平均値の計算
	for i, v := range his {
		sum += v
		val += sum / average
		sum %= average
		table[i] = val
	}
	return
}
ポイントは以下としている
- (NTSC 系加重平均法)のヒストグラムから変換テーブルを作る
- 変換テーブル(lookupTBL)は最初に書いた数式
くらい。
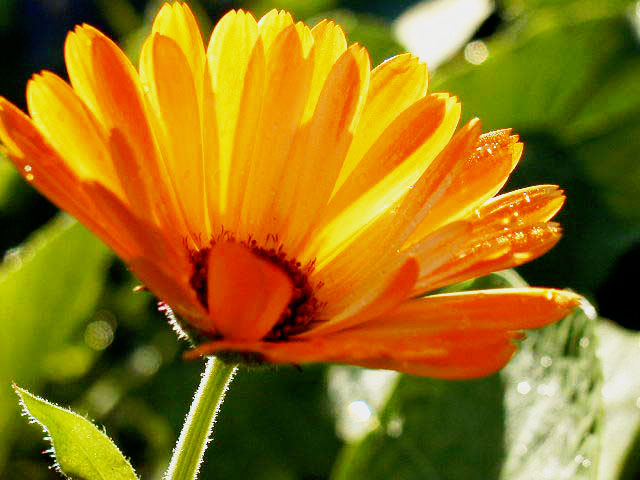
出力画像
まぁ、見やすくなってるから概ねよかろう
さらっと、ヒストグラムも改造し出してるし、
次章に入る前にきっちりリファクタリングですね。
