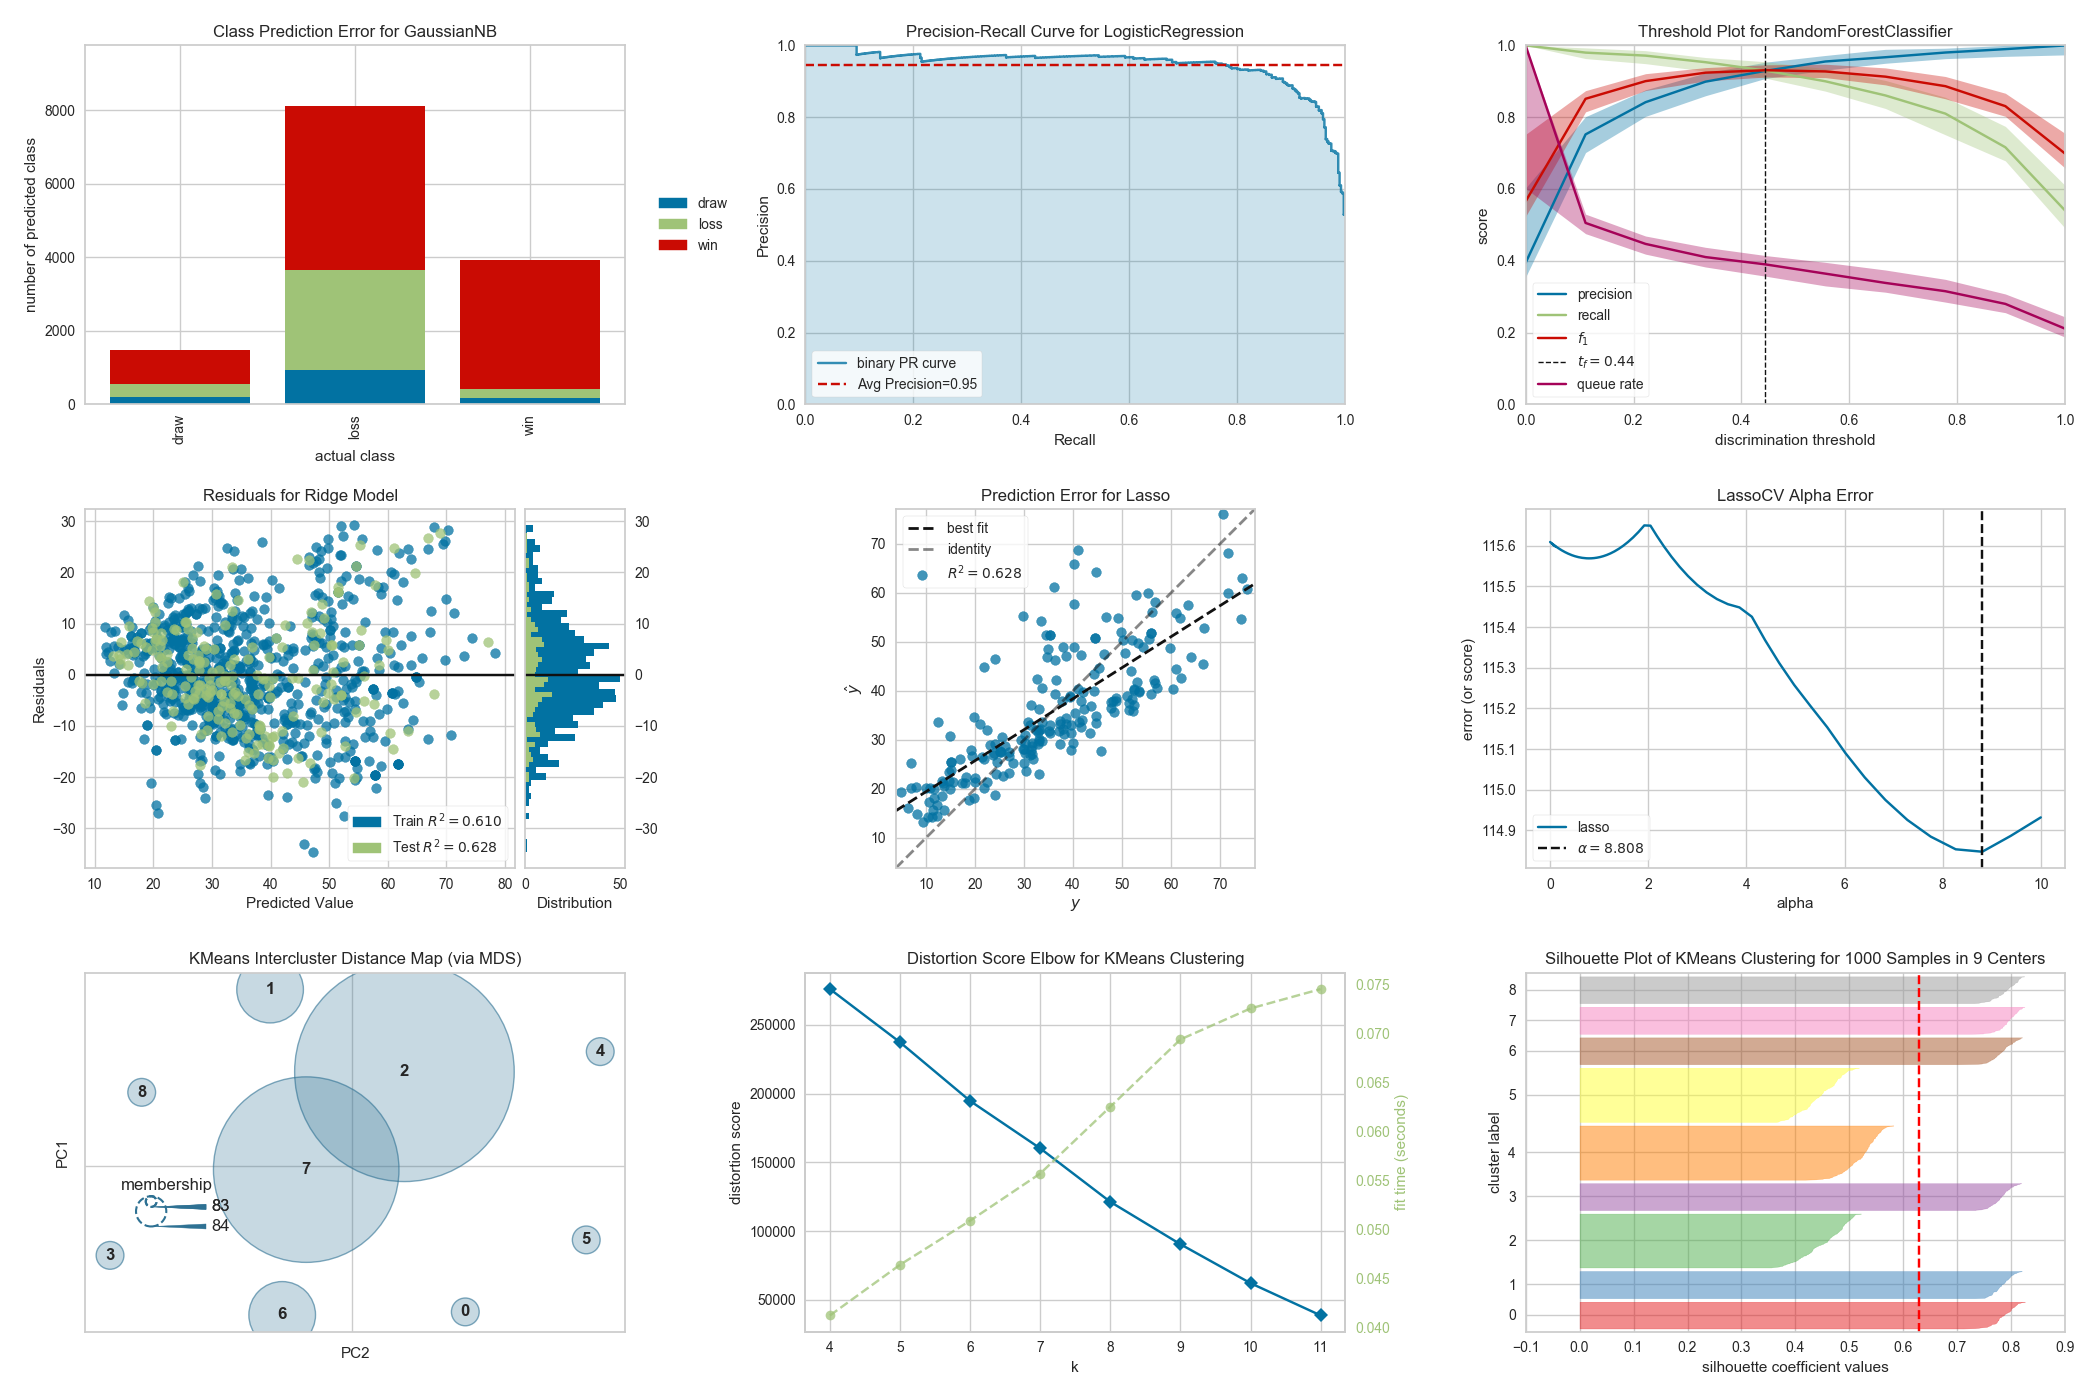
2021/10/10:学習前モデルを可視化させていたので学習後に修正、ハイパーパラメータを一部変更、2値分類問題のYellowbrick可視化例(グラフのみ)追加
はじめに
機械学習は、いろんな切り口でパフォーマンスが見たくなります。
可視化を試行錯誤するも、納得いく姿にコードを組み立てるのは大変・・・と思っていた矢先、「Yellowbrick」という機械学習のパフォーマンスを可視化するライブラリがあることを知りました。
実行してみると、コードが少なくとても簡単で、可視化されるグラフも美しい。
これはとてもいいです。
この記事は、「Yellowbrick」の実行録となっています。ご興味を持たれた方はぜひどうぞ。
実行条件など
・Google colabで実行
・ボストン住宅価格のデータセットで実行
・機械学習手法は決定木。デシジョンツリーはdtreevizで、機械学習の各種パフォーマンスは「Yellowbrick」で描かせます
※手元データを読込んで実行する場合も記載していますので、簡単にできるはずです。
ボストン住宅価格のデータセットについて
以下サイト(Kaggle)の「Boston.csv」を使わせていただいた。
データ数:506, 項目数:14のデータセットで、住宅価格を示す「MEDV」という項目と、住宅価格に関連するであろう項目が「CRIM:犯罪率」「RM:部屋数」「B:町の黒人割合」「RAD:高速のアクセス性」・・・等、13項目で構成されたデータとなっています。
これだけ項目があると、データ傾向を掴むだけでも、なかなか骨が折れるだろうと想像できますね。
ボストン住宅価格データの項目と内容
|項目|内容|
|:-----------|:------------------|
|CRIM|町ごとの一人当たり犯罪率|
|ZN|25,000平方フィート以上の住宅地の割合|
|INDUS|町ごとの非小売業の面積の割合|
|CHAS|チャールズ川のダミー変数(川に接している場合は1、そうでない場合は0)|
|NOX|窒素酸化物濃度(1,000万分の1)|
|RM|1住戸あたりの平均部屋数|
|AGE|1940年以前に建てられた持ち家の割合|
|DIS|ボストンの5つの雇用中心地までの距離の加重平均|
|RAD|高速道路(放射状)へのアクセス性を示す指標|
|TAX|10,000ドルあたりの固定資産税の税率|
|PTRATIO|町ごとの生徒数と教師数の比率|
|B|町ごとの黒人の割合|
|LSTAT|人口の下層階級の比率|
|MEDV|住宅価格の中央値(1000㌦単位)|
ライブラリのインストールおよびインポート
pip install graphviz
pip install dtreeviz
pip install -U yellowbrick
%matplotlib inline
import pandas as pd
import numpy as np
import matplotlib.pyplot as plt
from scipy.stats import norm
from sklearn import tree
from dtreeviz.trees import *
import graphviz
import yellowbrick
from yellowbrick.model_selection import ValidationCurve
from yellowbrick.model_selection import LearningCurve
from yellowbrick.model_selection import FeatureImportances
from yellowbrick.regressor import ResidualsPlot
from yellowbrick.regressor import PredictionError
import warnings
warnings.filterwarnings('ignore')
ファイル読込み
from google.colab import files
uploaded = files.upload()

df = pd.read_csv(target)
※kaggleサイトからダウンロードしたboston.csvは、1列目がindexコラムとなっています。私は読み込む前に削除しました。
FEATURES = df.columns[:-1]
TARGET = df.columns[-1]

X = df.loc[:, FEATURES]
y = df.loc[:, TARGET]
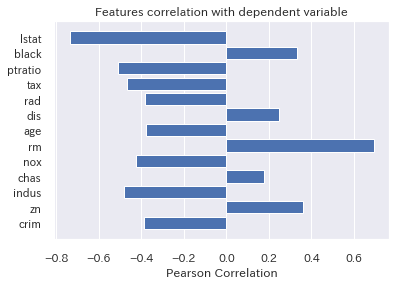
from yellowbrick.target import FeatureCorrelation
visualizer = FeatureCorrelation(labels=X.columns)
visualizer.fit(X, y)
visualizer.poof();
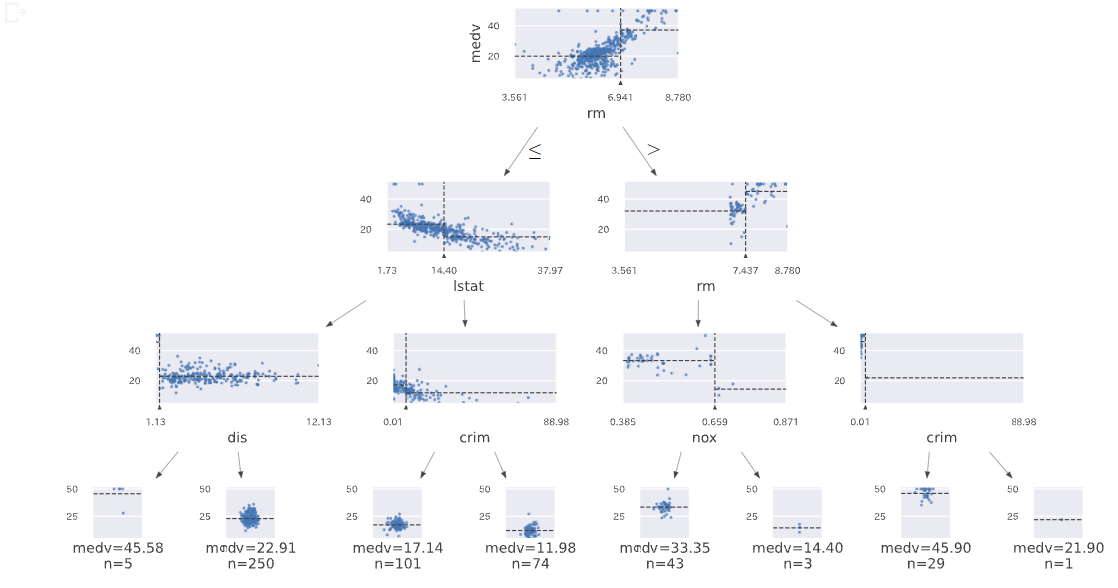
デシジョンツリー
dtree = tree.DecisionTreeRegressor(max_depth=3)
dtree.fit(X,y)

viz = dtreeviz(dtree,X,y,
               target_name = TARGET,
               feature_names = FEATURES,
               #orientation='LR',
               #X = [3,3,5,3]
              )

viz
モデル学習
from sklearn.model_selection import train_test_split
X_train, X_test, y_train, y_test = train_test_split(
    X, y, test_size = 0.20,
    random_state = 1)

from sklearn.tree import DecisionTreeRegressor
from sklearn.model_selection import GridSearchCV

dtr = DecisionTreeRegressor(random_state=0)

gs_dtr = GridSearchCV(dtr,
                      param_grid = {'max_depth': [2,3,4,5],
                      'min_samples_leaf':[1, 2, 3, 4, 5, 6, 7, 8, 9, 10],
                      'max_leaf_nodes':[None,10,20,30,40,50,60,70,80,90]},
                      cv = 10)

gs_dtr.fit(X_train, y_train)

y_train_pred = gs_dtr.predict(X_train)
y_test_pred = gs_dtr.predict(X_test)

gs_dtr.best_estimator_
モデル評価
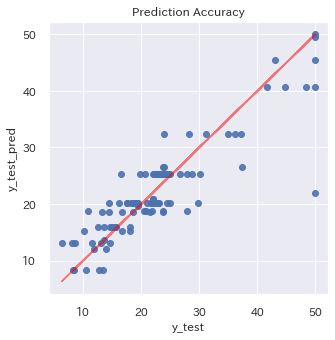
予測プロット
**Yellowbrick使用前**
まずは**Yellowbrick** 使用する前に行った予測値プロットのグラフ化です。
plt.figure(figsize = (5,5))
plt.title('Prediction Accuracy')
ax = plt.subplot(111)
ax.scatter(y_test, y_test_pred,alpha=0.9)
ax.set_xlabel('y_test')
ax.set_ylabel('y_test_pred')
ax.plot(y_test,y_test,color='red',alpha =0.5)
plt.show()
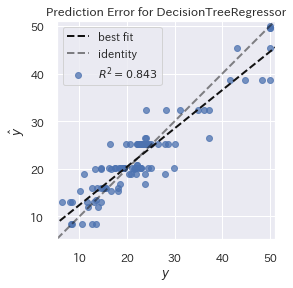
Yellowbrick ならとてもシンプルなコードで済みます。グラフもR²も表示される等いい感じです。
visualizer = PredictionError(gs_dtr.best_estimator_)
visualizer.fit(X_train, y_train)
visualizer.score(X_test, y_test)
visualizer.poof();
特徴量重要度
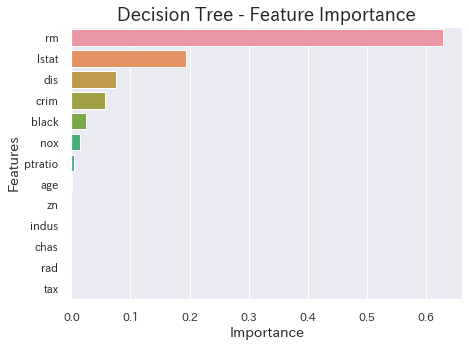
**Yellowbrick使用前**
fea_clf_imp = pd.DataFrame({'imp': dtree.feature_importances_, 'col': FEATURES})
fea_clf_imp = fea_clf_imp.sort_values(by='imp', ascending=False)

plt.figure(figsize=(7,5))
sns.barplot('imp','col',data=fea_clf_imp,orient='h')
plt.title('Decision Tree - Feature Importance',fontsize=18)
plt.ylabel('Features',fontsize=14)
plt.xlabel('Importance',fontsize=14)

plt.show()
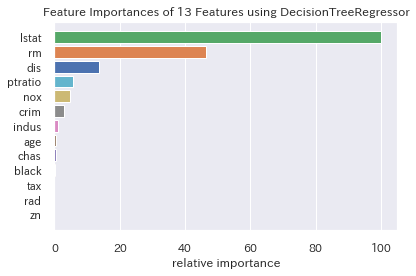
特徴量重要度のグラフ化も、**Yellowbrick**の場合、とてもシンプルなコードで済みます。
visualizer = FeatureImportances(gs_dtr.best_estimator_)
visualizer.fit(X_train, y_train)
visualizer.poof();
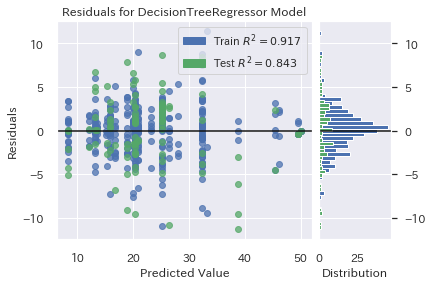
残差プロット
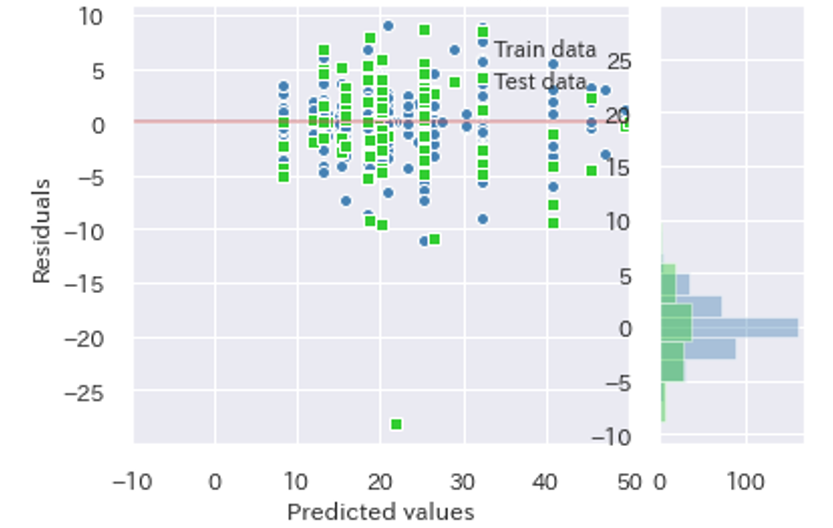
**Yellowbrick使用前**
fig = plt.figure(linewidth=1.5)
grid = plt.GridSpec(1, 4)
ax1 = fig.add_subplot(grid[0, 0:3])
ax2 = fig.add_subplot(grid[0, 0:3])
ax3 = fig.add_subplot(grid[0, 0:3])
ax4 = fig.add_subplot(grid[0, 3])
ax5 = fig.add_subplot(grid[0, 3])

ax1.set_xlabel('Predicted values')
ax1.set_ylabel('Residuals')
ax1.set_xlim([-10, 50])
ax1.scatter(y_train_pred,  y_train_pred - y_train,
            c='steelblue', marker='o', edgecolor='white',
            label='Train data')
ax2.scatter(y_test_pred,  y_test_pred - y_test,
            c='limegreen', marker='s', edgecolor='white',
            label='Test data')
ax1.legend(loc='upper right', borderaxespad=1, frameon=False)

# ax4.set_facecolor('whitesmoke')
ax3.hlines(y=0, xmin=-10, xmax=50, color='r', lw=1.5, alpha=0.5)
ax4.hist((y_train-y_train_pred), orientation="horizontal",color='steelblue',alpha=0.40)
ax5.hist((y_test-y_test_pred), orientation="horizontal",color='limegreen',alpha=0.40)
plt.show()
Yellowbrick 使用前のコードを見たあとにこれをみると、「これだけでいいの?」と言いたくなるほどコードはシンプルです。
visualizer = ResidualsPlot(gs_dtr.best_estimator_)
visualizer.fit(X_train, y_train)
visualizer.score(X_test, y_test)
visualizer.poof();
学習曲線
最後に学習曲線です。
**Yellowbrick使用前**
for i in range(1, 21):
tree = DecisionTreeRegressor(random_state=1, max_depth=i)
tree.fit(X_train, y_train)
score = tree.score(X_test, y_test)
scores.append(tree.score(X_test, y_test))
sns.set_context('talk')
sns.set_palette('dark')
sns.set_style('ticks')
plt.plot(range(1, 21), scores)
plt.ylim(0.5,1.0) #y軸範囲指定
plt.xlabel("Depth of Tree")
plt.ylabel("R²")
plt.title("Decision Tree Regressor R²")
plt.show()
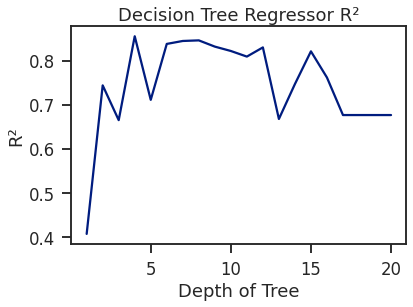
</div></details>
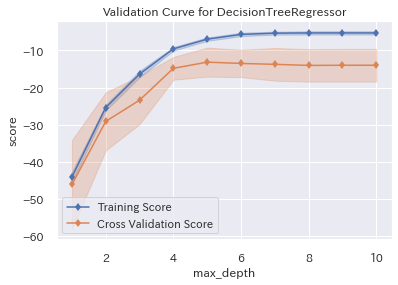
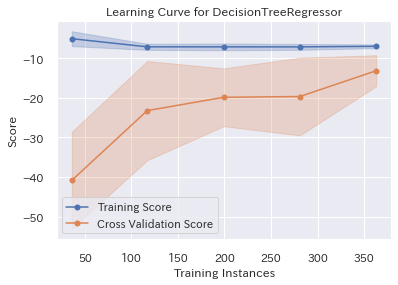
学習曲線も**[Yellowbrick](https://www.scikit-yb.org/en/latest/)**なら、簡単かつきれいです。
以下、2種類で描いてみました。
グラフは、交差検証(CV)の誤差の幅まで表示してくれるので、とても分かりやすいです。
```:木の深さでMSE(平均二乗誤差)はどうなる?
visualizer = ValidationCurve(
gs_dtr.best_estimator_, param_name="max_depth",
param_range=np.arange(1, 11), cv=10, scoring='neg_mean_squared_error'
)
visualizer.fit(X_train, y_train)
visualizer.poof();
visualizer = LearningCurve(
    gs_dtr.best_estimator_, cv=10, scoring='neg_mean_squared_error'
)
visualizer.fit(X_train, y_train)
visualizer.poof();
おまけ
**2値分類問題のYellowbrick可視化例(グラフのみ)**
最後に
Yellowbrick、もっと早く存在に気がついてりゃよかったと思いました。
とてもシンプルなコードで、とても美しく機械学習のパフォーマンスが可視化できます。
おすすめです。
参考サイト
https://linuxtut.com/en/ea678dbdbe518f4bf405/
https://www.scikit-yb.org/en/latest/
https://qiita.com/dyamaguc/items/20e5c3f433d79009e940
評価指標について
以下では評価指標をとても分かりやすく説明されていますので、ぜひどうぞ。
