はじめに
先日、Prophetによる時系列データ分析:異常検知編 の記事を書きました。
「時系列変数と目的変数だけ」、「教師なし」という手軽さは他にはないと思っていましたが、Pycaretでもできるようです。
以下は、
異常検知にPycaretが適用された記事です。
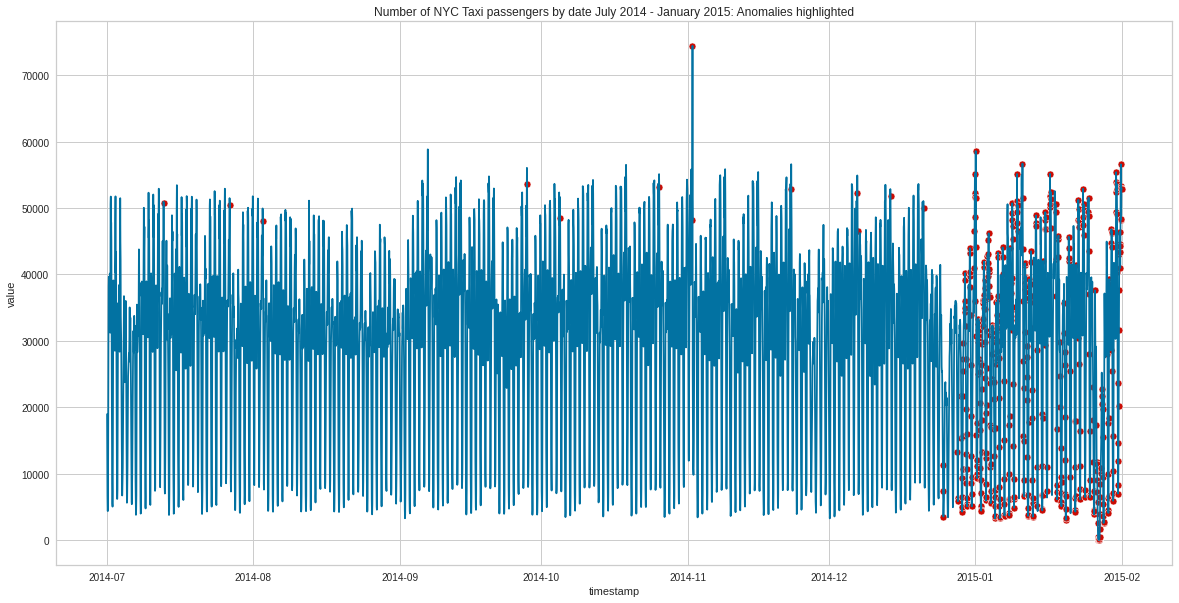
適用されたデータは、NYCにおける2014年7月から2015年1月までの30分間隔のタクシー利用者数です。
利用者数の推移グラフの挙動だけでは、どのデータが通常外か?はわからないのですが、学習の結果、2014年の終わりから2015年の初めにかけ、膨大な数の異常検知が見られたとあります。(以下参照)
この膨大な異常検知がみられた時期、NYCは激しい吹雪に見舞われたそうです。
Pycaretのモデルは、吹雪により引き起こされたタクシー乗客者行動の珍しいパターンをとてもよく検出したということになりますので、すごいです。
早速、試してみたくなりました。
NYCタクシー利用者のデータは30分間隔であるのに対し、手元にあるデータはある製品の月次間隔の返品データなので、データ間隔は荒く、データ数も少ないですが、一度トライしてみることにしました。
実行条件など
- Google colabで実行
- 手元にある月次返品データ(当記事の末尾にデータ有)で実行
ds y Dateです 返品数です
このライブラリの使い方について
- 月次の時系列データ(例:「年月」と「出荷数」等)で先の予測や異常検知を行うためのライブラリです。※ 週次や日時、1時間毎のデータもコード変更で扱えます
- PyCaret の教師なし異常検知モジュールを利用しています。Isolation Forestによる異常検知と、任意に選択したモデルによる異常検知(※abod / cluster / cof / histogram / knn / lof / svm / pca / mcd / sod / sos をフォームから選択可)を実行します。
前準備
- csvデータは以下の形式(例:年月と返品)としてください。
- 1列目を『年月』、2列目を『目的変数』としてください。 ※データは1,2列のみとしてください。
- [注意] csvデータは文字コードを「UTF-8」としてください。
年月 返品 →自動変換→ timestamp value 2019/1 4 →自動変換→ 2019-1-1 4 2019/2 12 →自動変換→ 2019-2-1 12 2019/3 6 →自動変換→ 2019-3-1 6 … … →自動変換→ … … 2021/12 1 →自動変換→ 2021-12-1 1
実行手順
- 「1.初期設定」にて「グラフテーマ」と「時間間隔設定」を選択する(※初期値はMS(月次)としています。週次や日時データの場合、コードを若干変更する必要があります。)
- メニューバーの「ランタイム」から「すべてのセルを実行」をクリック。
- ライブラリインストール完了後、「3.データ読込み」にて、[ファイル選択]ボタンをクリックし、分析したい文書(csvファイル)を指定する。
- 他の異常検知モデル(アルゴリズム)を実行する場合は、「7.異常検知のモデル選択と実行」の「Model選択」(Dropdownメニュー)にて任意のモデルを選択する。(※選択変更後は「Model選択」以下のセルを再実行してください。
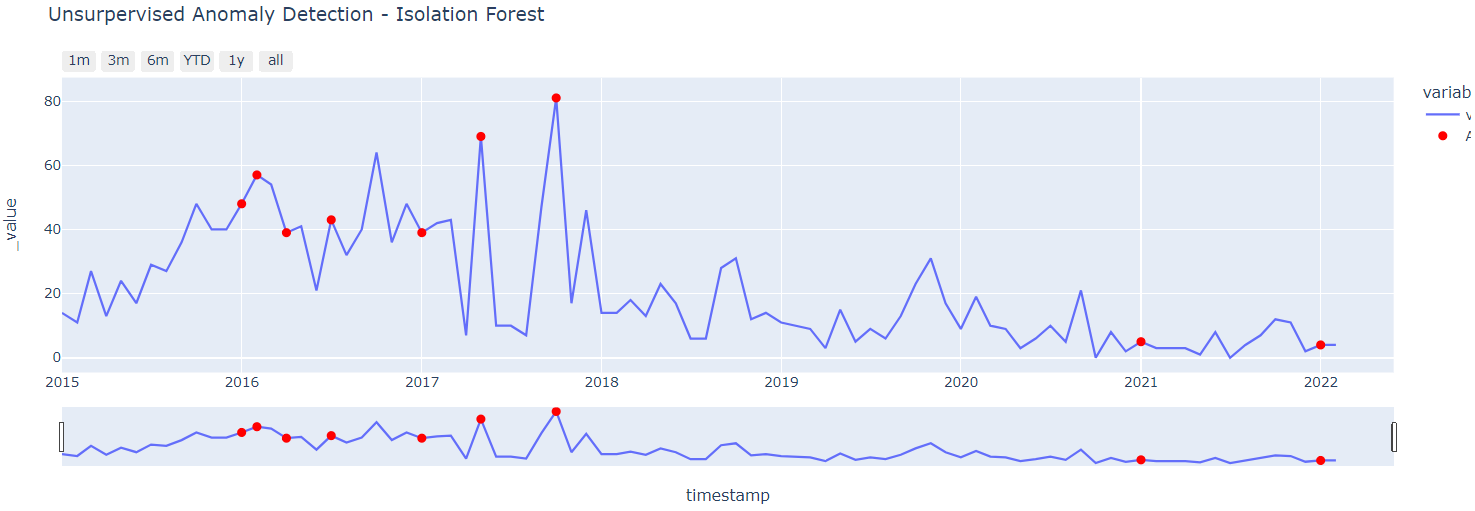
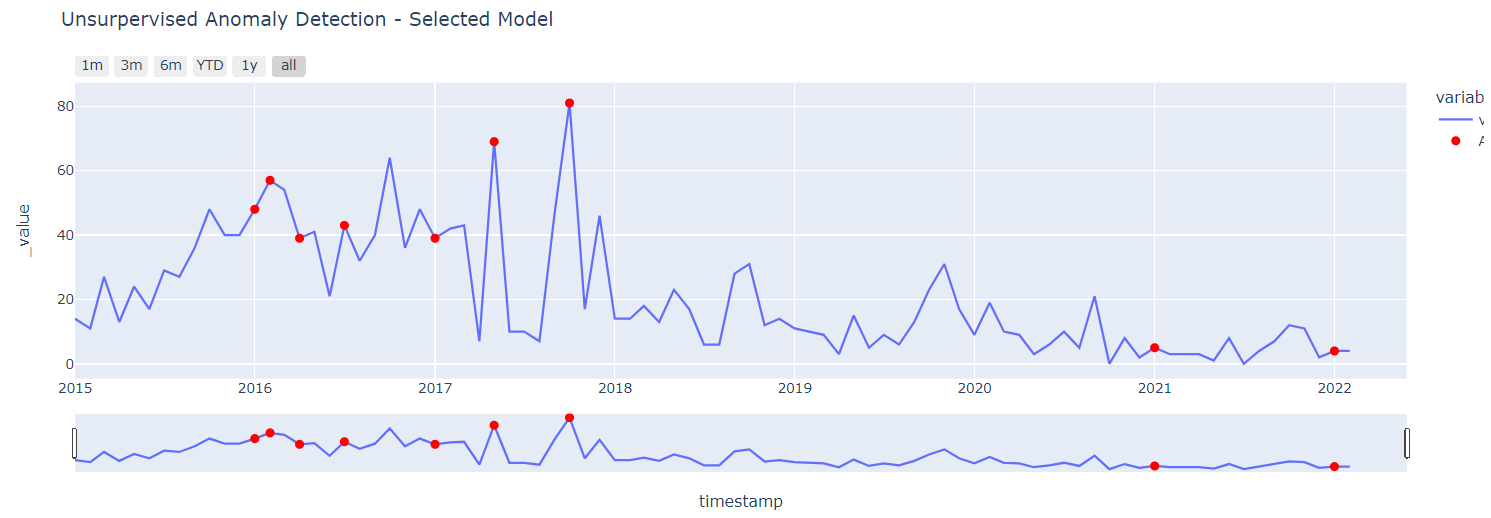
- グラフ上のプロット(赤)が異常検知と認識された点です。
- [注意] 一度実行した後にモデルを変更する場合は、すべてのセルを再実行してください。
1.初期設定
#@title グラフテーマ: ggplot2, seaborn, simple_white, plotly, plotly_white, plotly_dark, presentation, xgridoff, ygridoff, gridon, none]

template = 'plotly' #@param ['ggplot2', 'seaborn', 'simple_white', 'plotly', 'plotly_white', 'plotly_dark', 'presentation', 'xgridoff', 'ygridoff', 'gridon', 'none'] {allow-input: true}
#@title 時間間隔設定: AS:年(年初) / A:年(年末) / MS:月(月初) / M:月(月末) / W:週(日曜) / D:日(0時) / H:時(0分) / T:分(0秒) / S:秒

Time_interval = 'MS' #@param ["AS","A","MS","M","W","D","H","T","S"] {allow-input: true}
2.ライブラリインストール&インポート
pip install pycaret
#ライブラリインポート
import plotly.express as px
import plotly.io as pio
pio.renderers.default = "colab"
import pandas as pd
3.データ読込み
#@title csvファイル(UTF-8)を指定してください
from google.colab import files
#print('csvファイル(UTF-8)を指定してください')
uploaded = files.upload()

※ライブラリのインストールとインポートが完了すると、[ ファイル選択 ]がうながされるので、クリックし、ファイルを指定。(キャプチャ画像はファイル読込み後の画面イメージ)
前処理
#@title データフレーム格納とDatetime設定
if len(uploaded.keys()) != 1:
    print("アップロードは1ファイルにのみ限ります")
else:
    target = list(uploaded.keys())[0]

data = pd.read_csv(target)
data.columns = ['timestamp','value']

data['timestamp'] = pd.to_datetime(data['timestamp'])
data.head()
timestamp value 0 2015-01-01 14 1 2015-02-01 11 2 2015-03-01 27 3 2015-04-01 13 4 2015-05-01 24
4.データのグラフ表示
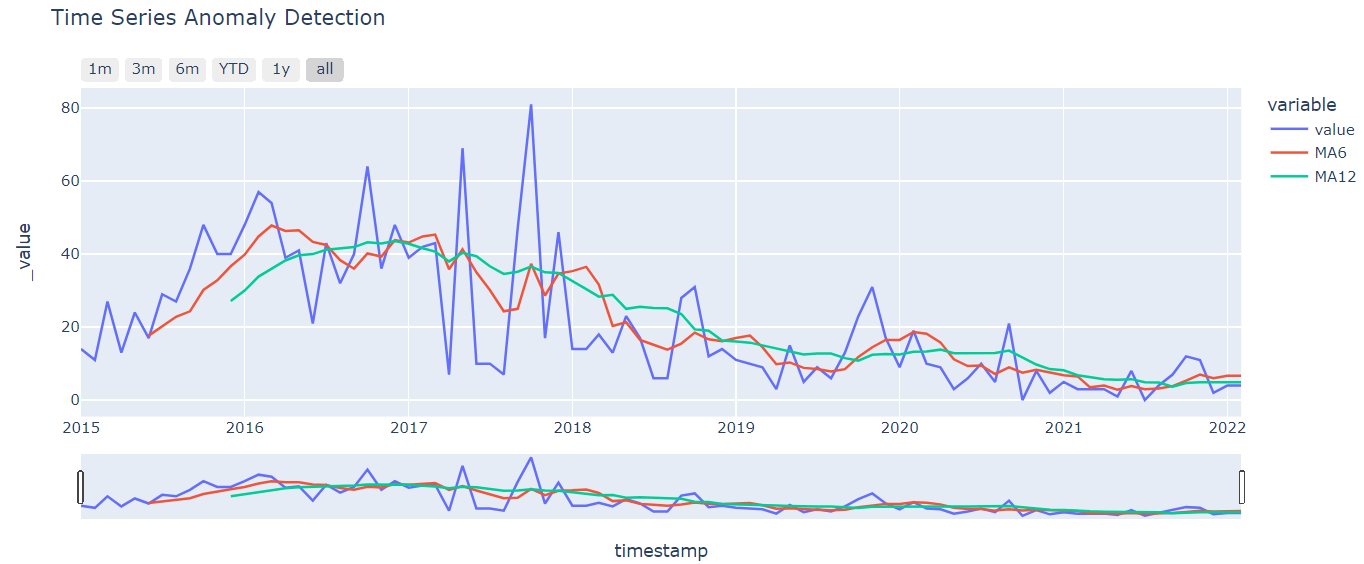
※移動平均は 6が月(MA6)、12か月(MA12)としています。変更する場合はコード変更が必要です。
#@title グラフ表示(移動平均 + rangeslider設定含む)
# create moving-averages
data['MA6'] = data['value'].rolling(6).mean()
data['MA12'] = data['value'].rolling(12).mean()
# plot
import plotly.express as px
fig = px.line(data, x="timestamp", y=['value', 'MA6', 'MA12'], title='Time Series Anomaly Detection',
              #template = 'plotly_dark'
              template = template
              )
#fig.update_xaxes(rangeslider_visible=True)
fig.update_xaxes(
    rangeslider_visible=True,
    rangeselector=dict(
        buttons=list([
          dict(count=1, label="1m", step="month", stepmode="backward"),
          dict(count=3, label="3m", step="month", stepmode="backward"),
          dict(count=6, label="6m", step="month", stepmode="backward"),
          dict(count=1, label="YTD", step="year", stepmode="todate"),
          dict(count=1, label="1y", step="year", stepmode="backward"),
          dict(step="all")
        ])
    )
)
fig.show()
- グラフ上の確認したい点にカーソルを近づけると時期や値が表示されます。
- グラフ下のスライドによって表示範囲を任意に変更できます。
- グラフ左上のボタンで、[1m]直近1ヵ月、[3m]直近3ヵ月、[6m]直近6か月、[YTD]今年、[1y]直近1年、[all]全表示 の切替が可能です。
5.Pycaret実装
#@title Date要素生成(※月次データ以外の場合はコード内の [注記] 確認のこと)
# drop moving-average columns
data.drop(['MA6', 'MA12'], axis=1, inplace=True)
# set timestamp to index
data.set_index('timestamp', drop=True, inplace=True)

# resample timeseries to (hourly,monthly,yearly…etc)
data = data.resample(Time_interval).sum()

'''
 [注記]
 Datetime(timestampカラム)から
 day, day_name(曜日) ,day_of_year ,quarter, week_of_year ,hour ,is_weekday
 を生成する。
 月次データを前提としているため、コメントアウト(#)している項目が多いが、
 週次、日時データを扱う場合は、適宜、コメントアウトを外してください。

'''
# creature features from date
#data['day'] = [i.day for i in data.index]
#data['day_name'] = [i.day_name() for i in data.index]
data['day_of_year'] = [i.dayofyear for i in data.index]
data['quarter'] = [i.quarter for i in data.index]
data['week_of_year'] = [i.weekofyear for i in data.index]
#data['hour'] = [i.hour for i in data.index]
#data['is_weekday'] = [i.isoweekday() for i in data.index]
data.head()
timestamp value day_of_year quarter week_of_year 2015-01-01 14 1 1 1 2015-02-01 11 32 1 5 2015-03-01 27 60 1 9 2015-04-01 13 91 2 14 2015-05-01 24 121 2 18
#@title Pycaretセットアップ - セットアップが完了したらEnterキーを押してください
# init setup
from pycaret.anomaly import *
s = setup(data, session_id = 123)
#@title 利用可能モデルの表示
# check list of available models
models()
ID Name Reference abod Angle-base Outlier Detection pyod.models.abod.ABOD cluster Clustering-Based Local Outlier pyod.models.cblof.CBLOF cof Connectivity-Based Local Outlier pyod.models.cof.COF iforest Isolation Forest pyod.models.iforest.IForest histogram Histogram-based Outlier Detection pyod.models.hbos.HBOS knn K-Nearest Neighbors Detector pyod.models.knn.KNN lof Local Outlier Factor pyod.models.lof.LOF svm One-class SVM detector pyod.models.ocsvm.OCSVM pca Principal Component Analysis pyod.models.pca.PCA mcd Minimum Covariance Determinant pyod.models.mcd.MCD sod Subspace Outlier Detection pyod.models.sod.SOD sos Stochastic Outlier Selection pyod.models.sos.SOS
6.Pycaret実行 - Isoration Forest
#@title Isoration Forestによる学習
# train model
iforest = create_model('iforest', fraction = 0.1)
iforest_results = assign_model(iforest)
iforest_results.head()
timestamp value day_of_year quarter week_of_year Anomaly Anomaly_Score 2015-01-01 14 1 1 1 0 -0.066863 2015-02-01 11 32 1 5 0 -0.125465 2015-03-01 27 60 1 9 0 -0.086232 2015-04-01 13 91 2 14 0 -0.081770 2015-05-01 24 121 2 18 0 -0.107713
#@title Isoration Forestによる異常検知データ表示:先頭5データのみ
# check anomalies
iforest_results[iforest_results['Anomaly'] == 1].head()
timestamp value day_of_year quarter week_of_year Anomaly Anomaly_Score 2016-01-01 48 1 1 53 1 0.039575 2016-02-01 57 32 1 5 1 0.003787 2016-04-01 39 92 2 13 1 0.003659 2016-07-01 43 183 3 26 1 0.004296 2017-01-01 39 1 1 52 1 0.022689
#@title Isoration Forestによる異常検知のグラフ表示
import plotly.graph_objects as go
# plot value on y-axis and date on x-axis
fig = px.line(iforest_results, x=iforest_results.index, y=['value'], title='Unsurpervised Anomaly Detection - Isolation Forest', template = template)
fig.update_xaxes(
    rangeslider_visible=True,
    rangeselector=dict(
        buttons=list([
          dict(count=1, label="1m", step="month", stepmode="backward"),
          dict(count=3, label="3m", step="month", stepmode="backward"),
          dict(count=6, label="6m", step="month", stepmode="backward"),
          dict(count=1, label="YTD", step="year", stepmode="todate"),
          dict(count=1, label="1y", step="year", stepmode="backward"),
          dict(step="all")
        ])
    )
)
# create list of outlier_dates
outlier_dates = iforest_results[iforest_results['Anomaly'] == 1].index
# obtain y value of anomalies to plot
y_values = [iforest_results.loc[i]['value'] for i in outlier_dates]
fig.add_trace(go.Scatter(x=outlier_dates, y=y_values, mode = 'markers',
                name = 'Anomaly',
                marker=dict(color='red',size=8)))

fig.show()
- グラフ上の確認したい点にカーソルを近づけると時期や値が表示されます。
- グラフ下のスライドによって表示範囲を任意に変更できます。
- グラフ左上のボタンで、[1m]直近1ヵ月、[3m]直近3ヵ月、[6m]直近6か月、[YTD]今年、[1y]直近1年、[all]全表示 の切替が可能です。
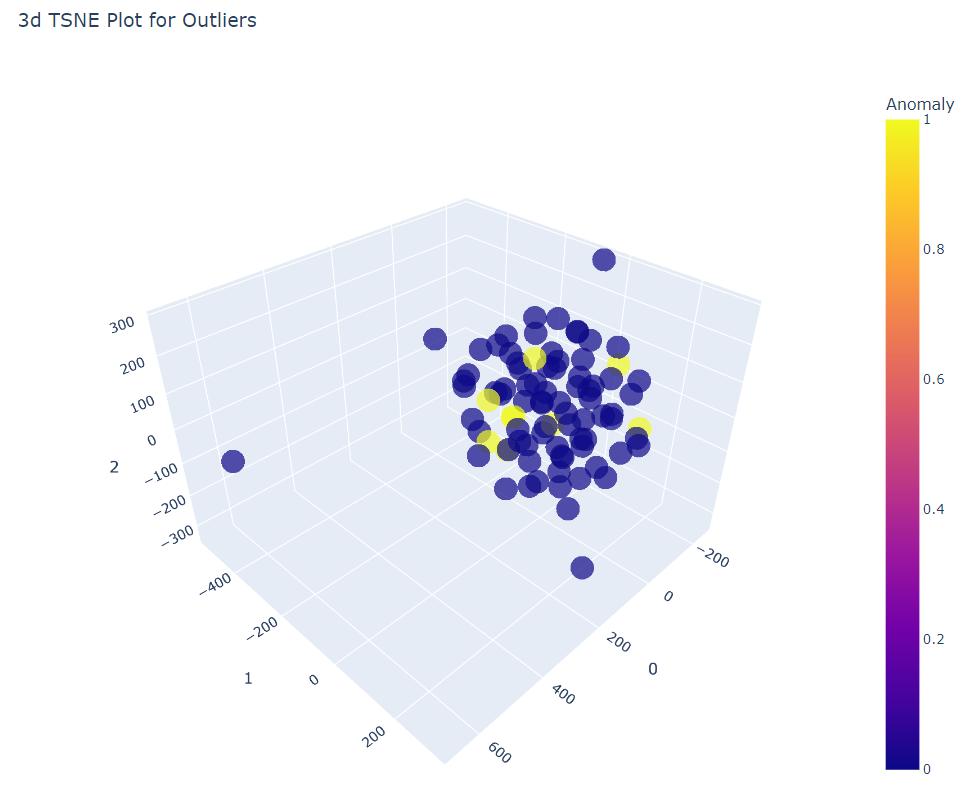
#@title TSNEプロット
plot_model(iforest)
7.異常検知のモデル選択と実行
#@title Model選択:abod /cluster /cof /histogram /knn /lof /svm /pca /mcd /sod /sos
Select_Model = 'svm' #@param ["abod","cluster","cof","histogram","knn","lof","svm","pca","mcd","sod","sos"] {allow-input: true}
#@title 選択したModelによる学習(表示する場合は#外す)
# train model
AD_Pycaret = create_model(Select_Model, fraction = 0.1)
AD_Pycaret_results = assign_model(iforest)
#AD_Pycaret_results.head()
#@title 選択モデルによる異常検知データ表示:先頭5データのみ(※表示する場合は#外す)
# check anomalies
#AD_Pycaret_results[iforest_results['Anomaly'] == 1].head()
#@title 選択モデルによる異常検知のグラフ表示
import plotly.graph_objects as go
# plot value on y-axis and date on x-axis
fig = px.line(AD_Pycaret_results, x=AD_Pycaret_results.index, y=['value'], title='Unsurpervised Anomaly Detection - Selected Model', template = template)
fig.update_xaxes(
    rangeslider_visible=True,
    rangeselector=dict(
        buttons=list([
          dict(count=1, label="1m", step="month", stepmode="backward"),
          dict(count=3, label="3m", step="month", stepmode="backward"),
          dict(count=6, label="6m", step="month", stepmode="backward"),
          dict(count=1, label="YTD", step="year", stepmode="todate"),
          dict(count=1, label="1y", step="year", stepmode="backward"),
          dict(step="all")
        ])
    )
)
# create list of outlier_dates
outlier_dates = AD_Pycaret_results[AD_Pycaret_results['Anomaly'] == 1].index
# obtain y value of anomalies to plot
y_values = [AD_Pycaret_results.loc[i]['value'] for i in outlier_dates]
fig.add_trace(go.Scatter(x=outlier_dates, y=y_values, mode = 'markers',
                name = 'Anomaly',
                marker=dict(color='red',size=8)))

fig.show()
print("※ Select_Modelは "+"["+Select_Model+"]")
- グラフ上の確認したい点にカーソルを近づけると時期や値が表示されます。
- グラフ下のスライドによって表示範囲を任意に変更できます。
- グラフ左上のボタンで、[1m]直近1ヵ月、[3m]直近3ヵ月、[6m]直近6か月、[YTD]今年、[1y]直近1年、[all]全表示 の切替が可能です。
最後に
- 「時系列変数」をdatetime型に変え、これから取り出した月,日,曜日,週,1年の何日目…等を変数として利用し、学習… 時系列変数と目的変数だけあれば適用できるのはありがたい。
- 数多くのモデル(アルゴリズム)が選択できるのはいい。Pycaretならでは。
- 今回適用した月次データは、まぁそこそこか。より時間間隔が短いデータほど効果を発揮するはずだから、(とてもお手軽でもあるので)ぜひ利用したい。
参考サイト
使用したデータ
ds y
2015/1/1 0:00 14
2015/2/1 0:00 11
2015/3/1 0:00 27
2015/4/1 0:00 13
2015/5/1 0:00 24
2015/6/1 0:00 17
2015/7/1 0:00 29
2015/8/1 0:00 27
2015/9/1 0:00 36
2015/10/1 0:00 48
2015/11/1 0:00 40
2015/12/1 0:00 40
2016/1/1 0:00 48
2016/2/1 0:00 57
2016/3/1 0:00 54
2016/4/1 0:00 39
2016/5/1 0:00 41
2016/6/1 0:00 21
2016/7/1 0:00 43
2016/8/1 0:00 32
2016/9/1 0:00 40
2016/10/1 0:00 64
2016/11/1 0:00 36
2016/12/1 0:00 48
2017/1/1 0:00 39
2017/2/1 0:00 42
2017/3/1 0:00 43
2017/4/1 0:00 7
2017/5/1 0:00 69
2017/6/1 0:00 10
2017/7/1 0:00 10
2017/8/1 0:00 7
2017/9/1 0:00 47
2017/10/1 0:00 81
2017/11/1 0:00 17
2017/12/1 0:00 46
2018/1/1 0:00 14
2018/2/1 0:00 14
2018/3/1 0:00 18
2018/4/1 0:00 13
2018/5/1 0:00 23
2018/6/1 0:00 17
2018/7/1 0:00 6
2018/8/1 0:00 6
2018/9/1 0:00 28
2018/10/1 0:00 31
2018/11/1 0:00 12
2018/12/1 0:00 14
2019/1/1 0:00 11
2019/2/1 0:00 10
2019/3/1 0:00 9
2019/4/1 0:00 3
2019/5/1 0:00 15
2019/6/1 0:00 5
2019/7/1 0:00 9
2019/8/1 0:00 6
2019/9/1 0:00 13
2019/10/1 0:00 23
2019/11/1 0:00 31
2019/12/1 0:00 17
2020/1/1 0:00 9
2020/2/1 0:00 19
2020/3/1 0:00 10
2020/4/1 0:00 9
2020/5/1 0:00 3
2020/6/1 0:00 6
2020/7/1 0:00 10
2020/8/1 0:00 5
2020/9/1 0:00 21
2020/10/1 0:00 0
2020/11/1 0:00 8
2020/12/1 0:00 2
2021/1/1 0:00 5
2021/2/1 0:00 3
2021/3/1 0:00 3
2021/4/1 0:00 3
2021/5/1 0:00 1
2021/6/1 0:00 8
2021/7/1 0:00 0
2021/8/1 0:00 4
2021/9/1 0:00 7
2021/10/1 0:00 12
2021/11/1 0:00 11
2021/12/1 0:00 2
2022/1/1 0:00 4
2022/2/1 0:00 4

