2022/10/03 ベストモデルの精度可視化を追加(分類タスクは混同行列、回帰タスクは精度グラフを表示)
2022/10/02 テストデータの予測結果表示を追加

はじめに
lazypredictは、簡単なコードだけで多くの機械学習モデルを構築し比較することが可能なPythonライブラリです。
とにかく爆速です。
この記事では、GoogleColabで分類・回帰のタスクを切り替えられるようにし、分類・回帰に応じたコードを実行し、機械学習モデルの比較結果を表示させました。
実行条件など
-Google colabで実行
-任意のデータセットとsklearn等のデータセットを読み出せるようにしています。
実行
ライブラリのインストール
Python
#@title **Install Library**
!pip install lazypredict
Python
#@title Import
import pandas as pd
import numpy as np
import warnings
warnings.filterwarnings('ignore')
データセットとデータセットタイプ(分類か回帰)選択のフォームセット
Python
#@title **Select_Dataset** { run: "auto" }
dataset = 'Breast_cancer :binary' #@param ['Boston_housing :regression', 'Diabetes :regression', 'Breast_cancer :binary','Titanic :binary', 'Loan_prediction :binary', 'Upload']

#@title **Classification**(分類)or **Regression**(回帰)
dataset_type = 'Classification' #@param ["Classification", "Regression"]
GoogleColabのセルは以下のフォーム表示になります。

データセット読み込み→データセットのインフォと先頭5行表示
Python
#@title **Load Dataset**
if dataset =='Upload':
  from google.colab import files
  uploaded = files.upload()#Upload
  target = list(uploaded.keys())[0]
  df = pd.read_csv(target)

elif dataset == "Diabetes :regression":
  from sklearn.datasets import load_diabetes
  dataset = load_diabetes()
  df = pd.DataFrame(dataset.data, columns=dataset.feature_names)
  df["target"] = dataset.target

elif dataset == "Breast_cancer :binary":
  from sklearn.datasets import load_breast_cancer
  dataset = load_breast_cancer()
  df = pd.DataFrame(dataset.data, columns=dataset.feature_names)
  df["target"] = dataset.target

elif dataset == "Titanic :binary":
  data_url = "https://raw.githubusercontent.com/datasciencedojo/datasets/master/titanic.csv"
  df = pd.read_csv(data_url)
  X = df.drop(['Survived'], axis=1) # 目的変数を除いたデータ
  y = df['Survived'] # 目的変数
  df = pd.concat([X, y], axis=1)

elif dataset == "Loan_prediction :binary":
  data_url = "https://github.com/shrikant-temburwar/Loan-Prediction-Dataset/raw/master/train.csv"
  df = pd.read_csv(data_url)

else:
  from sklearn.datasets import load_boston
  dataset = load_boston()
  df = pd.DataFrame(dataset.data, columns=dataset.feature_names)
  df["target"] = dataset.target

#X = pd.DataFrame(dataset.data, columns=dataset.feature_names)
#y = pd.Series(dataset.target, name='target')

source = df.copy()

FEATURES = df.columns[:-1]
TARGET = df.columns[-1]
X = df.loc[:, FEATURES]
y = df.loc[:, TARGET]

df.info()
df.head()
以下は、BostonHousingデータセット(回帰)で実行した結果です。

lazypredictセッティングフォームセットと学習
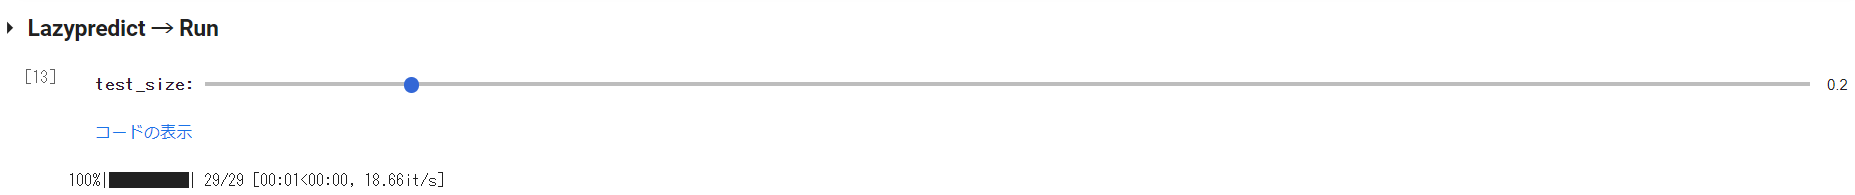
test_size(テストデータ分割比)をスライドバーで切り替えられるようにしています。
Python
#@title **Lazypredict → Run**

test_size = 0.2 #@param {type:"slider", min:0.1, max:0.9, step:0.1}

from lazypredict.Supervised import (
    LazyClassifier,
    LazyRegressor,
)
from sklearn.model_selection import train_test_split

if dataset_type =='Classification':
  X_train, X_test, y_train, y_test = train_test_split(X, y, test_size=test_size, random_state=42, stratify=y)

else:
  X_train, X_test, y_train, y_test = train_test_split(X, y, test_size=test_size, random_state=42)


# Fit Lazypredict
if dataset_type =='Classification':
  clf = LazyClassifier(
      ignore_warnings=True, random_state=1121218, verbose=False,predictions=True
      )
  models, predictions = clf.fit(X_train, X_test, y_train, y_test)
else:
  reg = LazyRegressor(
      ignore_warnings=True, random_state=1121218, verbose=False,predictions=True
      )
  models, predictions = reg.fit(X_train, X_test, y_train, y_test)
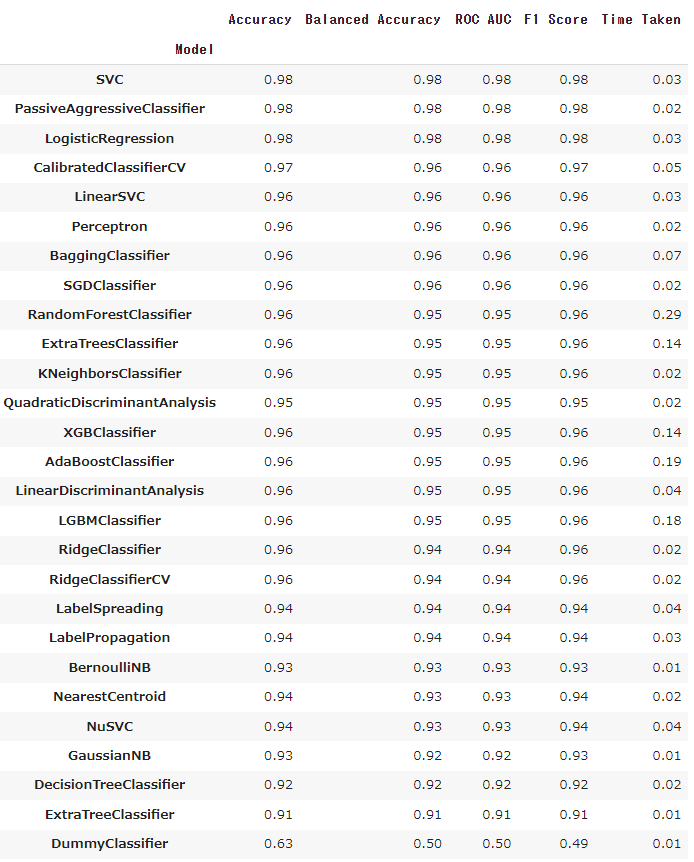
モデル比較の結果表示
Python
#@title **Predictions result**
display(models)
print('-------------------------------------------------------------'
display(predictions)
以下は、BreastCancerデータセット(分類)で実行した結果です。
Python
#@title **Predictions result**

Display_predictions = False #@param {type:"boolean"}

if Display_predictions == True:
  #pd.set_option('display.max_rows', None)
  #pd.set_option('display.max_columns', None)
  display(predictions)
以下はテストデータの予測結果です。

ベストモデルの精度可視化
分類タスクは混同行列、回帰タスクは精度グラフを表示します。
Python
#@title Precision of Best model

y_test = y_test.reset_index()
df =pd.concat([y_test, predictions],axis=1)

if dataset_type =='Classification':
  display(models[0:1])
  print('\n')
  from sklearn.metrics import confusion_matrix
  matrix = confusion_matrix(df['target'], df[models.index[0]])
  sns.heatmap(matrix.T, square=True,annot=True)
  plt.xlabel('True labels')
  plt.ylabel('Predicted labels')
  plt.show()

else:
  display(models[0:1])
  print('\n')
  plt.figure(figsize = (5,5))
  plt.title('Prediction Accuracy')
  ax = plt.subplot(111)
  ax.scatter(df['target'], df[models.index[0]],alpha=0.9)
  ax.set_xlabel('True labels')
  ax.set_ylabel('Predicted labels')
  ax.plot(df['target'],df['target'],color='red',alpha =0.5)
  plt.show()
以下は、BostonHousingデータセット(回帰)で実行した結果です。

以下は、BreastCancerデータセット(分類)で実行した結果です。

最後に
とにかく速いです。
データセットに適した機械学習モデルと精度が、大袈裟ではなく、瞬時に知ることができます。
ハイパーパラメータ調整は実行しませんので、さらに詰める場合は別途となりますが、最低限はこれで十分かも。
参考