macOS Big Sur(11.0.1) 2020-11-16
テキストファイルは以下のリンクのa_voronoi1.txtです.
https://drive.google.com/drive/folders/1UHYNa4viiTBpVcYJBPablOWM5Dyhvqyg?usp=sharing
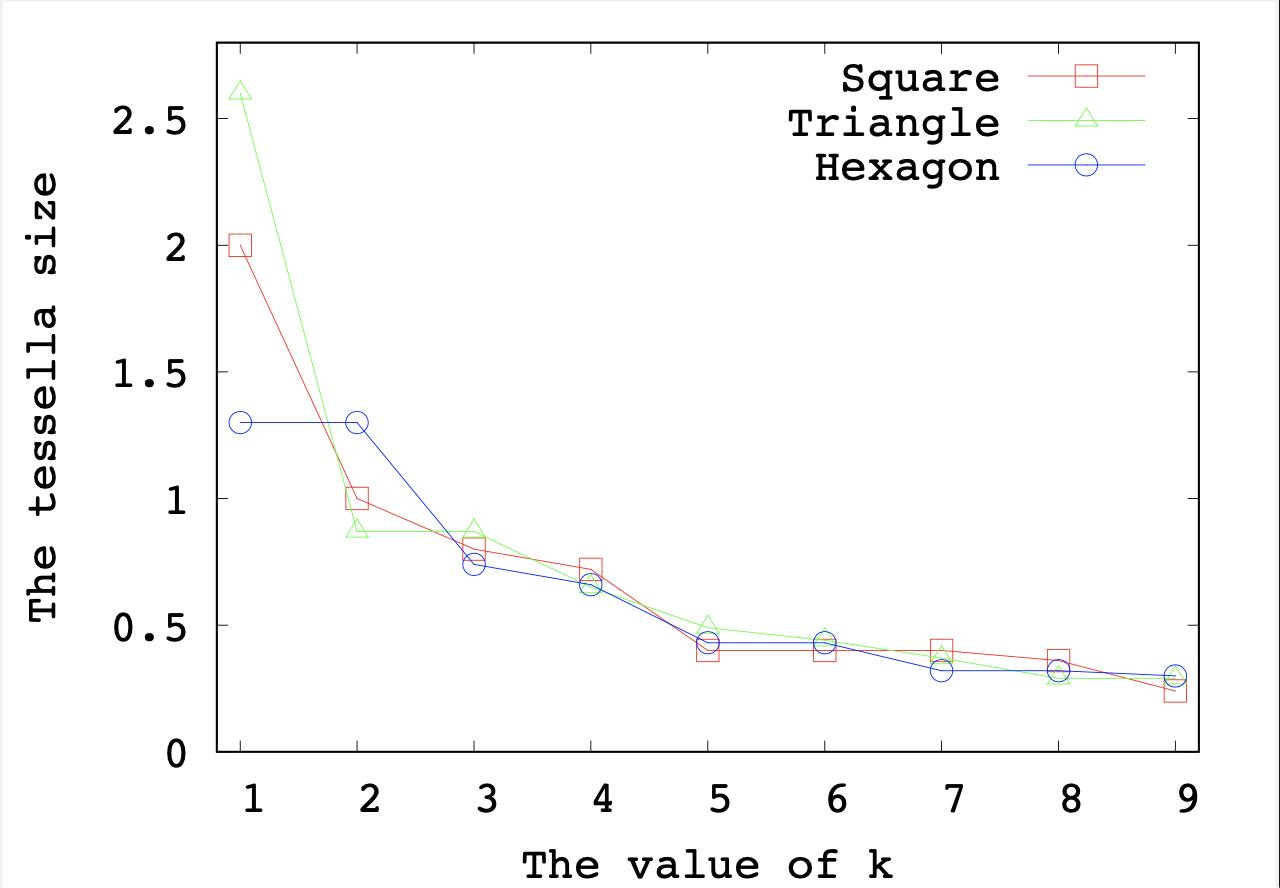
作る目標の図は以下です.
書類にa_voronoi1.txtを保存したなら,ターミナルを開いて
cd Documents
と打ちます.(Change Directory)
現在位置は
ls
で確かめます.(LiSt)
a_voronoi1.txtがある場所で
gnuplot
と打ちます.
gnuplotをダウンロードしている前提です.
plot "a_voronoi1.txt"
すると,以下の図が立ち上がります.
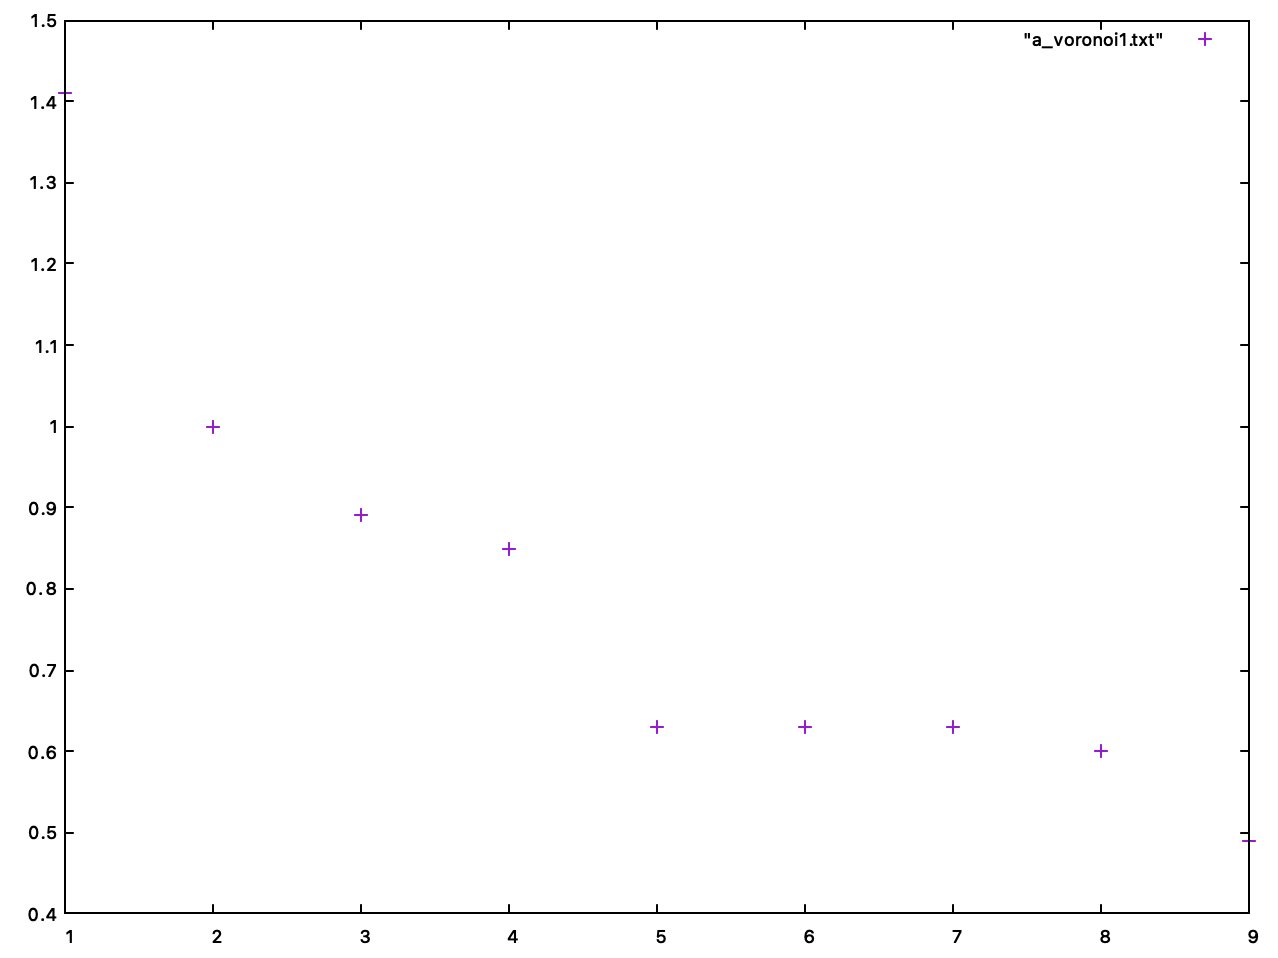
次に,画像を保存します.gnuplot上で以下を各行打ちます.
set terminal postscript eps
set output "a_voronoi1.eps"
plot "a_voronoi1.txt"
set output
何をしたのかの補足です.
画像データを保存するためにPostScript形式を利用します.gnuplotでは,postscriptというターミナルで利用できます.
PostScript形式のファイル拡張子は通常epsです.
参考: http://dsl4.eee.u-ryukyu.ac.jp/DOCS/gnuplot/node63.html
以下,画像にラベルを貼ったり,表示の仕方を変えます.
毎回同じことを記述するのは大変なのでスクリプトを作ります.
vi a_voronoi1.plt
でplotスクリプトを作成し,中身を以下のようにします.
set xlabel 'The value of k'
set ylabel 'The tessella size'

set terminal postscript eps
set output "a_voronoi1.eps"
plot "a_voronoi1.txt"
set output
gnuplotを開き,
load "a_voronoi1.plt"
で作ったスクリプトが実行されます.
a_voronoi1.epsを開くと,x軸,y軸のラベルがついています.
以後,このスクリプトを編集すればいいです.
ここで,a_voronoi1.txtからでは,1つのデータしか表示されないことがわかります.
目標の図には3つのデータが表示されているので,3つの図を重ねることにします.
上のリンクのsquare.txtを使います.
set xrange [0.8 : 9.2]
set yrange [0 : 2.8]
set xlabel 'The value of k'
set ylabel 'The tessella size'
set terminal postscript eps color enhanced "Courier" 25
set output "square.eps"
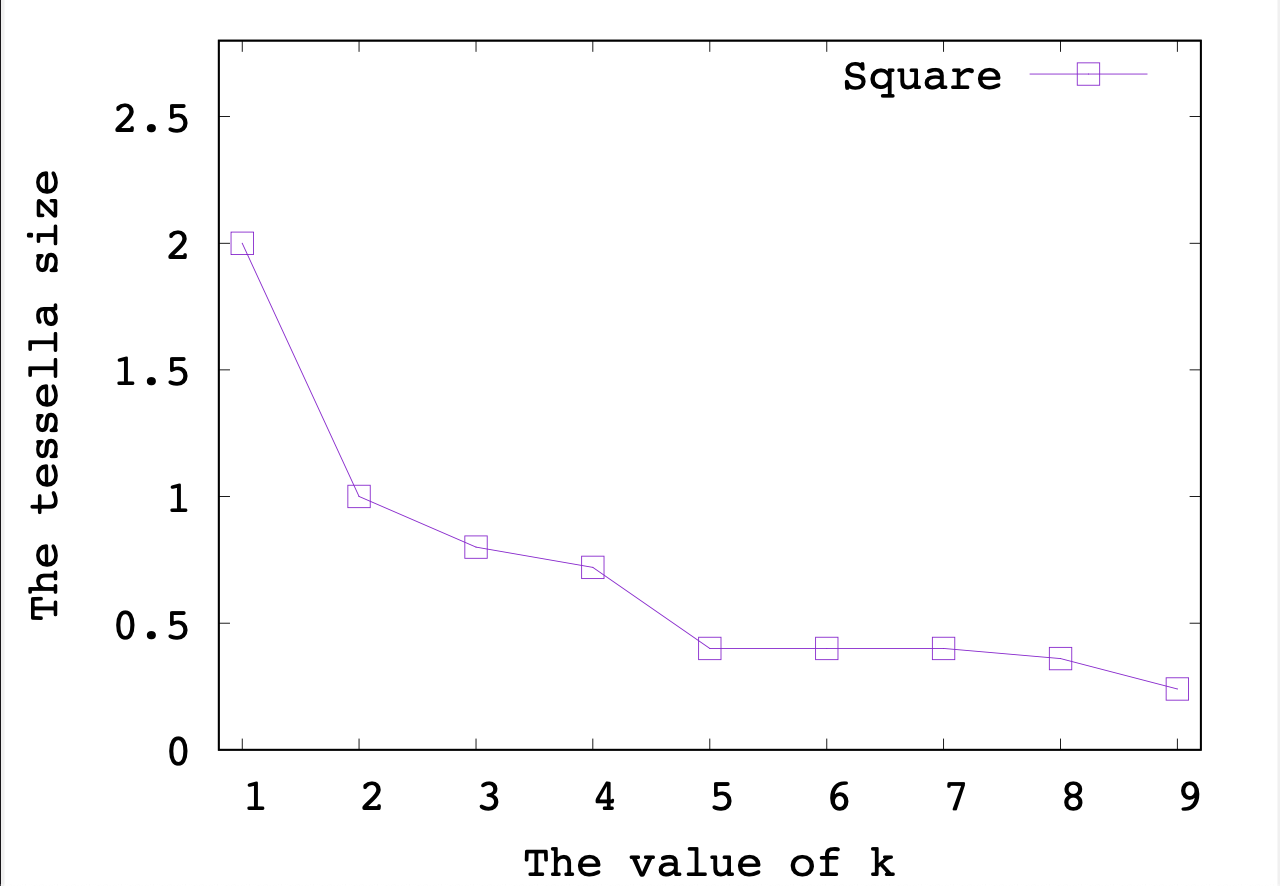
plot "square.txt" with linespoints pointtype 4 pointsize 2 title 'Square'
set output
フォントをCourier,フォントサイズを25ポイントにしています.
参考: https://ss.scphys.kyoto-u.ac.jp/person/yonezawa/contents/program/gnuplot/paper1.html
with linespointsでデータ点を点で表示し, あいだを線で結びます.
pointtypeで点の種類を変え(4で下図のような種類),pointsizeで点の大きさを変えます.
参考: http://dsl4.eee.u-ryukyu.ac.jp/DOCS/gnuplot/node156.html
square.epsが作られ,以下の図になっています.
さて,同様にtriangle.txt, hexagon.txtを持ってきて,square.pltを以下のように変更します.
set xrange [0.8 : 9.2]
set yrange [0 : 2.8]
set xlabel 'The value of k'
set ylabel 'The tessella size'

set terminal postscript eps color enhanced "Courier" 25
set colorsequence classic
set output "square.eps"
plot "square.txt" with linespoints pointtype 4 pointsize 2 title 'Square',\
"triangle.txt" with linespoints pointtype 8 pointsize 2 title 'Triangle',\
"hexagon.txt" with linespoints pointtype 6 pointsize 2 title 'Hexagon'
set output
バックスラッシュを入れることで,改行して入力できます.
set colorsequence classicで線の色を赤,緑,青にしています.
参考: https://ss.scphys.kyoto-u.ac.jp/person/yonezawa/contents/program/gnuplot/version5.html
square.epsが目標の図のようになります.