概要
Pythonの可視化ライブラリであるDashとStreamlitを触ってみたので簡単に感想などをまとめたいと思います。
DashとStreamlitについて
Dash
DashとはPythonのWebフレームワークで、PythonのWebフレームワークとしてよく知られているFlaskやDjangoと同じ部類です。
一般的なPythonのWebフレームワークとの違いとして、Dashは可視化に特化しており、Flask/Plotly/Reactをベースにして作られているWebフレームワークです。
Streamlit
StreamlitとはPythonのWebフレームワークです。
Dash同様に可視化に特化しており、React/Bootstrapをベースにして作られているWebフレームワークです。
Dashとの違いとしてはDashはPlotlyのみをサポートしてますが、Streamlitは
- Matplotlib
- Altair
- Graphviz
- Bokeh
等の可視化ライブラリもサポートしています。
トレンド
Dashは2015年、Streamlitは2018年に初回リリースがされています。
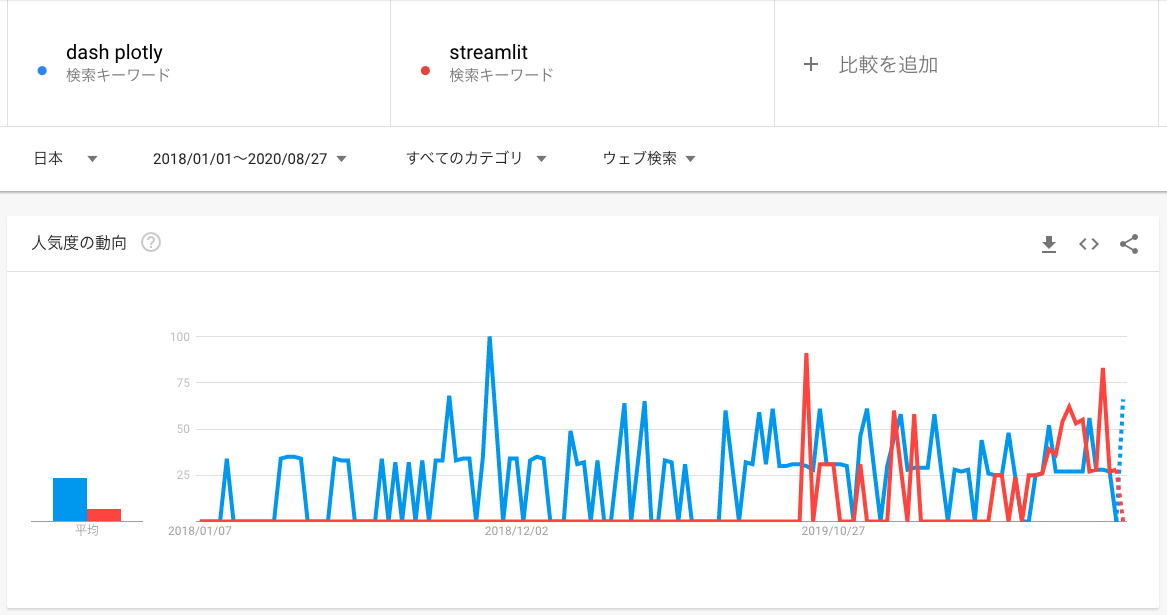
Googleトレンドを見ると日本ではStreamlitが検索されるようになったのは最近で、2019年9月あたりからです。
DashもStreamlitもPythonの可視化用のWebフレームワークという事で用途が限られる分トレンドの絶対数は大きくなく、直近ではDashとStreamlitの検索数の差もそこまで大きくはないように感じます。

https://trends.google.co.jp/trends/explore?date=2018-01-01%202020-08-27&geo=JP&q=dash%20plotly,streamlit
DashとStreamlitを触ってみた
環境
| バージョン | |
|---|---|
| Mac | 10.15.3 |
| Docker | 19.03.8 |
| docker-compose | 1.25.4 |
| Python | 3.7.3 |
可視化するデータ
今回は2019シーズンのB1リーグのアリーナ集客数と勝敗のデータを使って可視化しました。
元データ:https://www.bleague.jp/attendance/?tab=1&year=2019&club=&event=2&setuFrom=1
Dockerの準備
Dockerを使ってDashとStreamlitを動かしたのでDockerfileとdocker-compose.ymlを作成しておきます。
FROM python:3
USER root

RUN apt-get update
RUN apt-get install -y vim less
RUN apt-get install -y zsh less
RUN pip install --upgrade pip
RUN pip install --upgrade setuptools

# dash
RUN pip install dash==1.14.0
RUN pip install pandas

# streamlit
RUN pip install streamlit

ENV LANG ja_JP.UTF-8
ENV LANGUAGE ja_JP:ja
ENV LC_ALL ja_JP.UTF-8

EXPOSE 8001
CMD ["bash"]
version: '3'
services:
  python-visualization:
    restart: always
    build: .
    container_name: 'python-visualization'
    ports:
      - "8001:8001"
    working_dir: '/root/'
    tty: true
    volumes:
      - ./src:/root/src/
      - ~/.zshrc:/root/.zshrc
※使ったソースコードはこちらも置いてあります。
https://github.com/hikarut/Python-Visualization
Dash
インストール
Dockerを使って必要なパッケージをインストールします。
pip install dash==1.14.0
pip install pandas
アプリケーションファイルの作成
今回は以下のようなファイルを作成しています。ほとんどこちらにあるチュートリアルのままです。
https://dash.plotly.com/layout
# -*- coding: utf-8 -*-

# Run this app with `python app.py` and
# visit http://127.0.0.1:8050/ in your web browser.

import dash
import dash_core_components as dcc
import dash_html_components as html
from dash.dependencies import Input, Output
import plotly.express as px
import pandas as pd

external_stylesheets = ['https://codepen.io/chriddyp/pen/bWLwgP.css']

app = dash.Dash(__name__, external_stylesheets=external_stylesheets)

b1_data = pd.read_csv('src/data/b1_2019.csv')

color="home_victory", barmode="group")

app.layout = html.Div(children=[
    html.H1(children='Hello Dash B-league'),

    html.Div(children='''
        Dash: A web application framework for Python.
    '''),
    dcc.Dropdown(
        id = 'dropdown-for-example',
        options = [{'label': i, 'value': i} for i in b1_data.arena.unique()],
        value = b1_data.arena.min()
    ),
    dcc.Graph(
        id='example-graph'
    )
])

@app.callback(
    Output('example-graph', 'figure'),
    [Input('dropdown-for-example', 'value')])

def update_figure(selected):
    filtered_df = b1_data[b1_data.arena == selected]

    fig = px.bar(filtered_df, x="home_team", y="attendance", color="home_victory", barmode="group")

    fig.update_layout(transition_duration=500)

    return fig

if __name__ == '__main__':
    app.run_server(host='0.0.0.0', port=8001, debug=True)
※細かいですが、Dockerに割り当てられているデフォルトのhostが0.0.0.0なので、Dashを起動させる際のhostもそちらを指定します。
※また今回portも8001を開けているのでそちらを指定します。
起動
Dockerを使っているので、ビルドと起動を行います
$ docker-compose up -d --build
$ docker-compose exec python-visualization zsh -c "python src/dash/app.py"
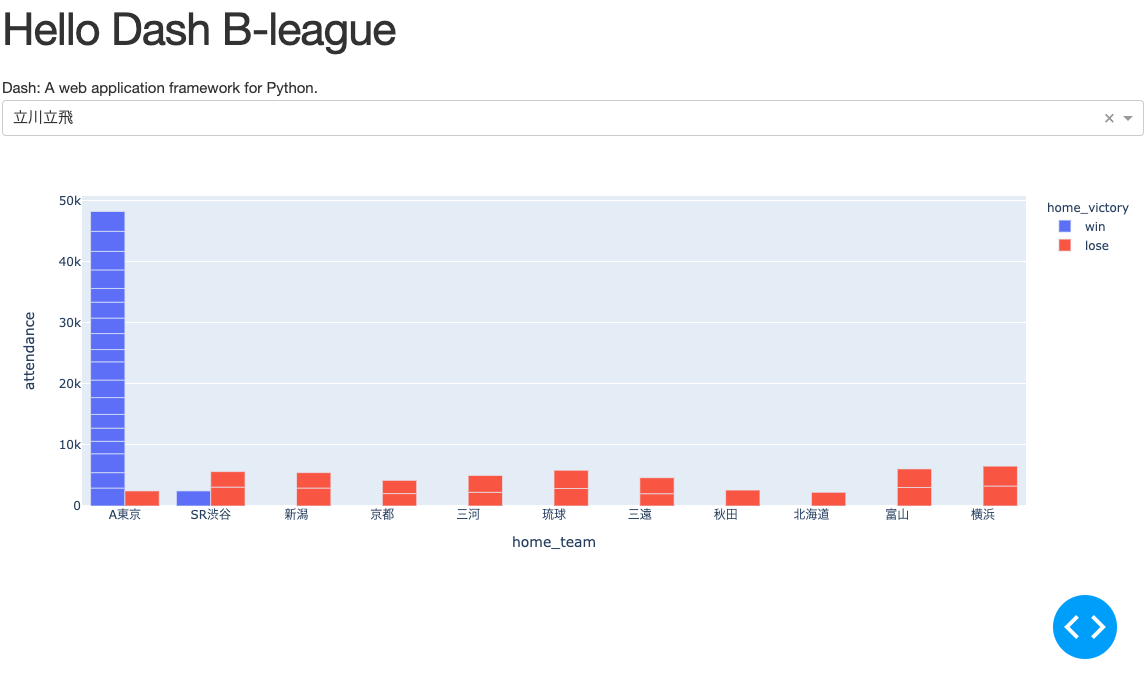
起動画面
上記を起動すると以下のような画面が立ち上がります。
アリーナを選択するとチームごとの勝敗と集客数が表示されるようなグラフになっています。

Streamlit
インストール
Dockerを使って必要なパッケージをインストールします。
pip install streamlit
アプリケーションファイルの作成
今回は以下のようなファイルを作成しています。こちらは以下参考にしています。
参考:[Python]簡単に可視化アプリケーションが作れる"Streamlit"をテスト書きした
import streamlit as st
import plotly.express as px
import plotly.io as pio
import pandas as pd

# data
b1_data = pd.read_csv('../data/b1_2019.csv')

st.title('Bleagu Data')

# sidemenu
st.sidebar.markdown(
    "# Sidebar"
)

template = st.sidebar.selectbox(
    "Template", list(pio.templates.keys())
)

arena = st.sidebar.selectbox(
    "Arena", list(b1_data.arena.unique())
)

filtered_df = b1_data[b1_data.arena == arena]
st.write(
    px.bar(filtered_df, x="home_team", y="attendance", color="home_victory", barmode="group", template=template)
)
Streamlitの場合はportとhostの指定を設定ファイルに書いているので、以下作成しておきます。
[server]
port=8001

[browser]
serverAddress="0.0.0.0"
起動
Dockerを使っているので、ビルドと起動を行います。
$ docker-compose up -d --build
$ dc exec python-visualization zsh -c "cd src/streamlit && streamlit run app.py"
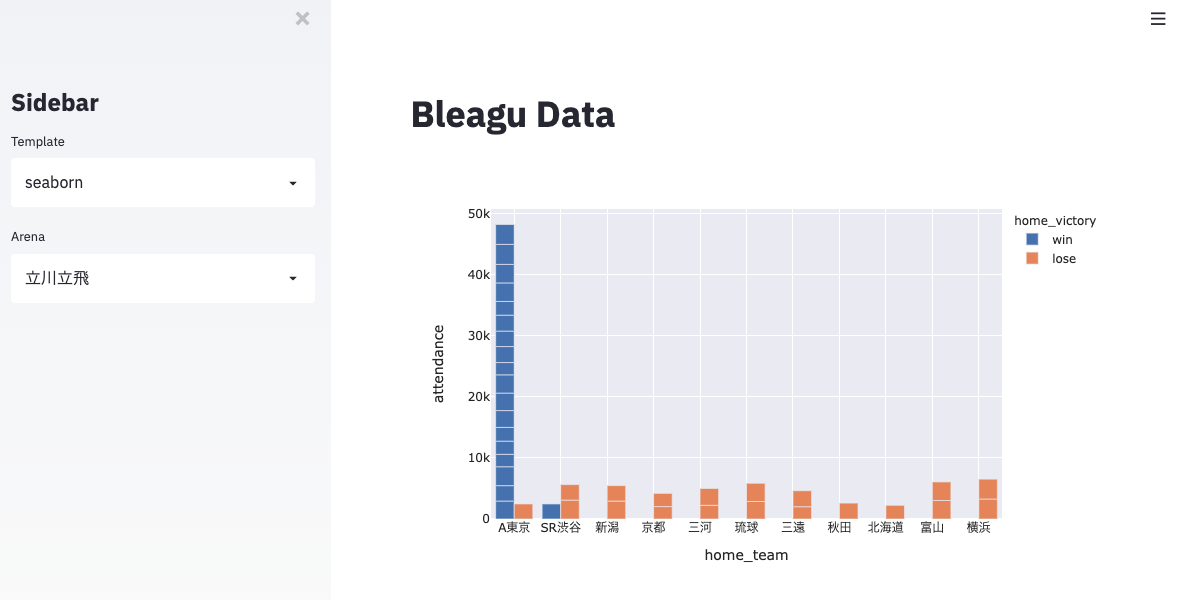
起動画面
上記を起動すると以下のような画面が立ち上がります。
Dashの時と同様にアリーナを選択するとチームごとの勝敗と集客数が表示されるようなグラフになっています。

DashとStreamlitの違いまとめと感想
| Dash | Streamlit | |
|---|---|---|
| 使いやすさ | 使いやすい | 使いやすい |
| コード量 | 多い | 少ない |
| デザイン性(※主観) | 昔ながらの普通のダッシュボード | 少しモダンな印象 |
| 見た目の拡張性 | 高い | 低い |
簡単な可視化であればどちらもさくっと作れるので、全体的な使いやすさに関しては同じくらいの印象です。
見た目の拡張性でいうとStreamlitは基本的なレイアウトが決まっているためあまり拡張できないですが、
Dashに関してはHTMLが書ける分自由度も高い印象です。
なので全体的なコード量としてもDashの方が少し多くなり、Streamlitはシンプルに書ける印象です。
個人的には全体的な見た目やコード量の少なさからStreamlitの方が良さそうな気がしました。