Beginning
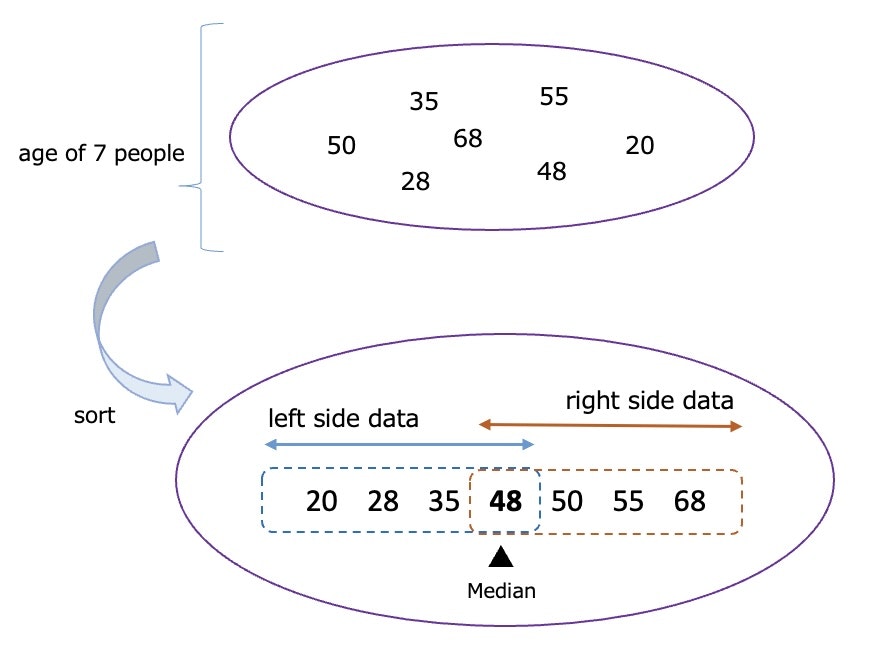
There are 7 people of different ages.
let's find the age that is in the middle with SQL
find the age in the middle・・(o゚Д゚o)?
【how to find】
Simply say・・・
① Create source data
② Create the left side data
③ Create the right side data
④ Find overlapping age
⇒ the overlapping age is median
If you look the sorted data
it's easy to imagine
▼ Image of median & taking out
check working with PostgreSQL
Table & Data
CREATE TABLE ages (
  id CHAR(3) PRIMARY KEY -- id
  ,age INTEGER -- age
);

INSERT INTO ages VALUES('A01',	20);
INSERT INTO ages VALUES('A02',	28);
INSERT INTO ages VALUES('B04',	35);
INSERT INTO ages VALUES('B07',	48);
INSERT INTO ages VALUES('C03',	50);
INSERT INTO ages VALUES('C06',	55);
INSERT INTO ages VALUES('C08',	68);
▼ Output
| id | age |
|---|---|
| A01 | 20 |
| A02 | 28 |
| B04 | 35 |
| B07 | 48 |
| C03 | 50 |
| C06 | 55 |
| C08 | 68 |
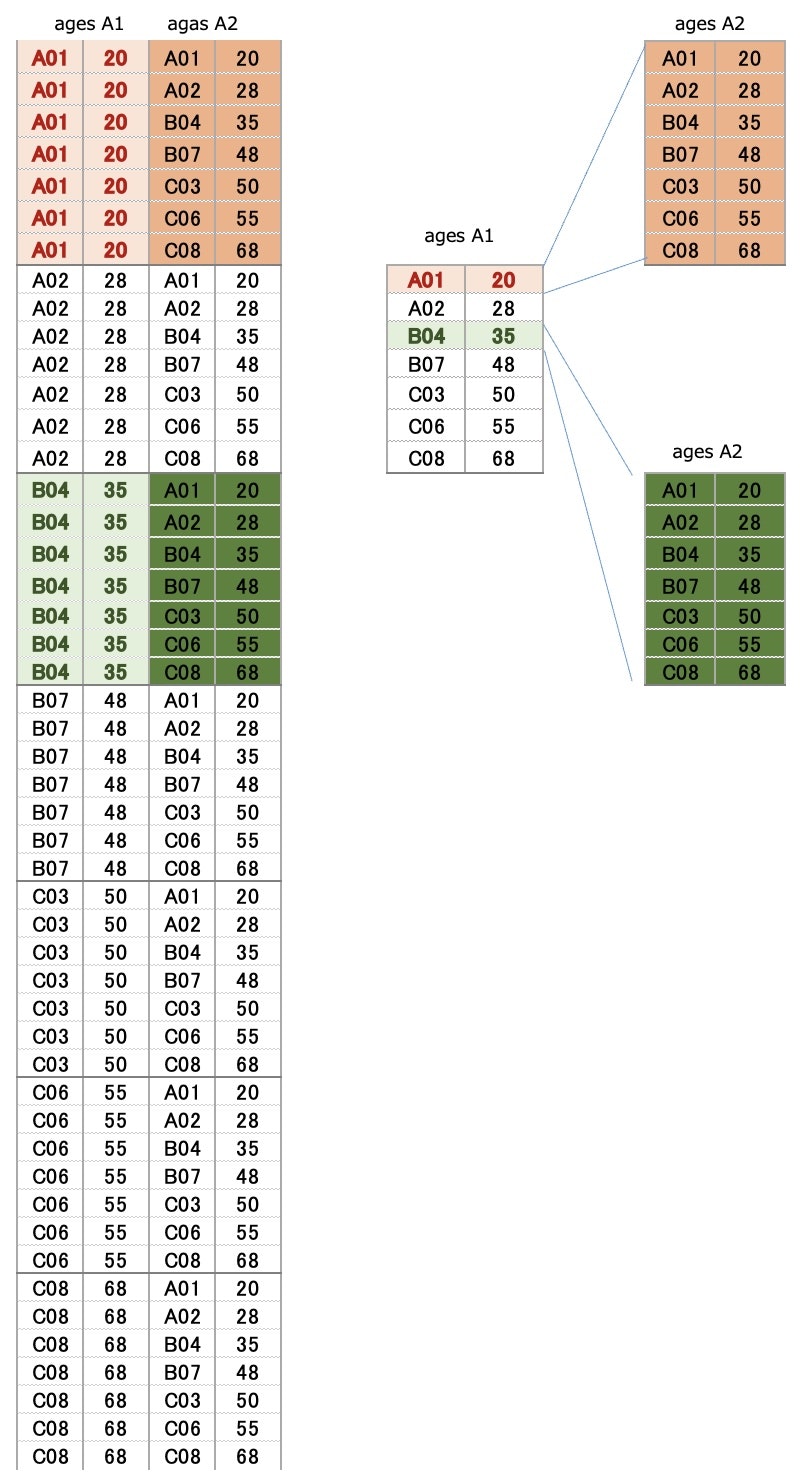
Create Source Data
-- Cross Join the ages table
SELECT A1.*, A2.*
FROM ages A1, ages A2
CROSS JOIN the ages table
⇒ Make all combinations
⇒ ages table has7 rows
⇒ 7 x 7 = 49(rows)
Check the below image to see
how to join the tables
▼ Output(left side of image)
Edit The Source Data
SELECT A1.age, ARRAY_AGG(A2.age)
FROM ages A1, ages A2
GROUP BY A1.age
▼ Output
| A1.age | ARRAY_AGG(A2.age) |
|---|---|
| 20 | { 20,28,35,48,50,55,68 } |
| 28 | { 20,28,35,48,50,55,68 } |
| 35 | { 20,28,35,48,50,55,68 } |
| 48 | { 20,28,35,48,50,55,68 } |
| 50 | { 20,28,35,48,50,55,68 } |
| 55 | { 20,28,35,48,50,55,68 } |
| 68 | { 20,28,35,48,50,55,68 } |
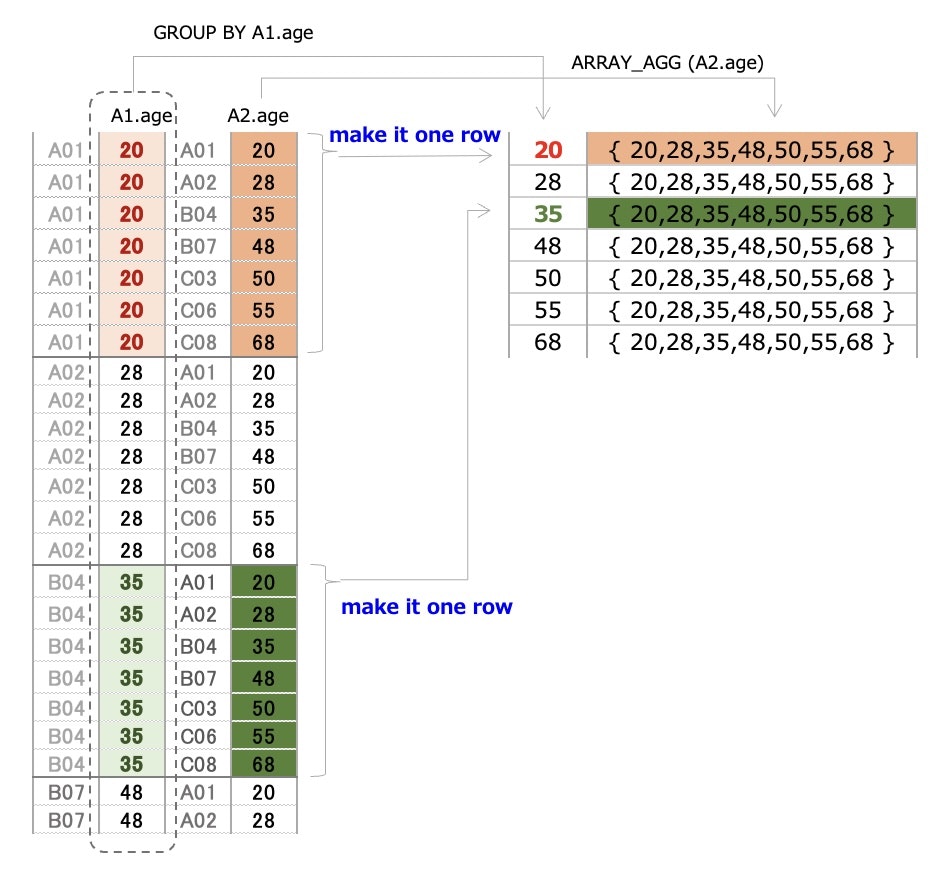
What is GROUP BY A1.age doing?
Look at (id = A01)
⓵ There are 6 rows that are all 20
⇒ make it unique (one row)
⓶ There are 6 rows that are different A1.age
⇒ 20,28,35,48,50,55,68
⇒ make it "one row"
⇒ create an array with ARRAY_AGG()
⓶ is important data
Actually this isn't necessary
but I've added it just to check SQL's behavior
▼ a image of aggregation
Create 『left side data』 | Pre-process
SELECT
  A1.age
 ,ARRAY_AGG(A2.age) AS ary
 -- 『right side data』has the opposite inequality sign
 ,ARRAY_AGG(CASE WHEN A2.age >= A1.age THEN 1 ELSE 0 END) AS flg_1
 ,SUM(CASE WHEN A2.age >= A1.age THEN 1 ELSE 0 END) AS cnt_1
FROM ages A1, ages A2
GROUP BY A1.age
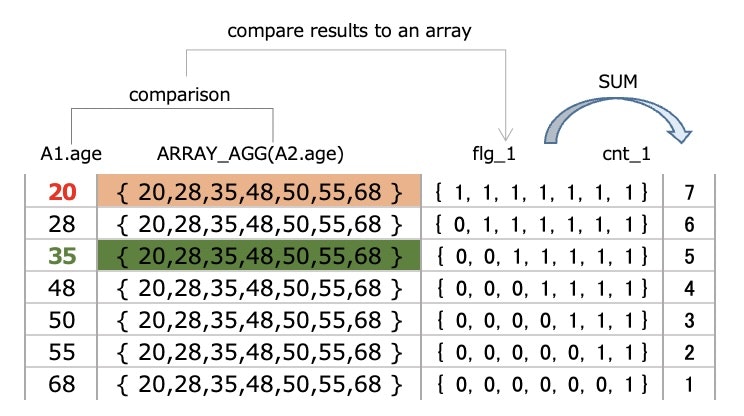
Since GROUP BY aggregates the data into one row,
it can be possible to compare
A1.age and A2.age(20,28,35,48,50,55,68)
⇒ Summarize the comparison results in flg_1
⇒ The SUM of the comparison results is cnt_1
▼ Output
| A1.age | ARRAY_AGG(A2.age) | flg_1 | cnt_1 |
|---|---|---|---|
| 20 | { 20,28,35,48,50,55,68 } | { 1, 1, 1, 1, 1, 1, 1 } | 7 |
| 28 | { 20,28,35,48,50,55,68 } | { 0, 1, 1, 1, 1, 1, 1 } | 6 |
| 35 | { 20,28,35,48,50,55,68 } | { 0, 0, 1, 1, 1, 1, 1 } | 5 |
| 48 | { 20,28,35,48,50,55,68 } | { 0, 0, 0, 1, 1, 1, 1 } | 4 |
| 50 | { 20,28,35,48,50,55,68 } | { 0, 0, 0, 0, 1, 1, 1 } | 3 |
| 55 | { 20,28,35,48,50,55,68 } | { 0, 0, 0, 0, 0, 1, 1 } | 2 |
| 68 | { 20,28,35,48,50,55,68 } | { 0, 0, 0, 0, 0, 0, 1 } | 1 |
let's see more detail of
the comparison behavior (´◉ω◉`)
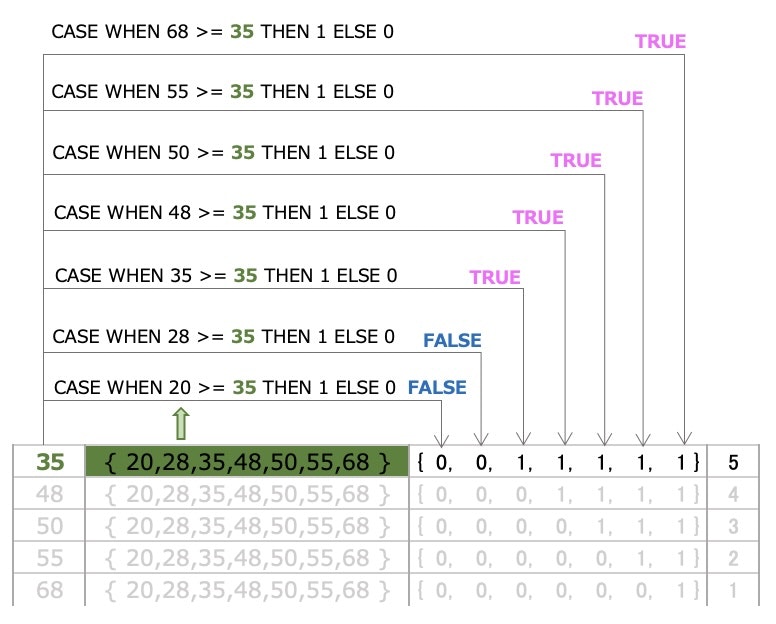
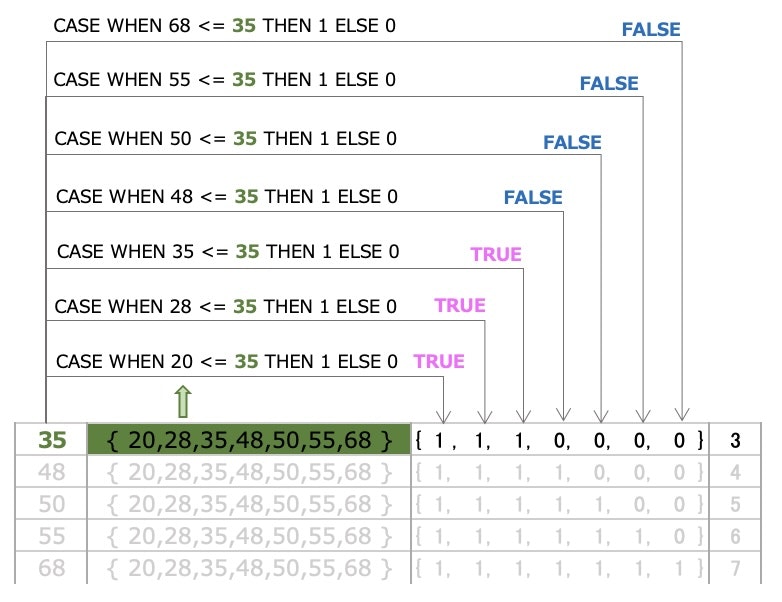
Compare A1.age and A2.age
【check A1.age is 35】
◾️CASE statement
CASE WHEN A2.age >= A1.age THEN 1 ELSE 0 END
⇒ {20,28,35,48,50,55,68} >= 35
⇒ the A2.age that is greater than or equal to 35
◾️ARRAY_AGG(CASE WHEN ・・・)
⇒ Return value is TRUE -> 1
⇒ Return value is FALSE -> 0
⇒ Return values into one row
⇒ { 0, 0, 1, 1, 1, 1, 1 } (use array)
⇒ flg_1
◾️SUM(CASE WHEN ・・・)
⇒ ( 0 + 0 + 1 + 1 + 1 + 1 + 1 )
⇒ sum all 『0 & 1』
⇒ 5
⇒ cnt_1
▼ Compare A1.age(35) and A2.age
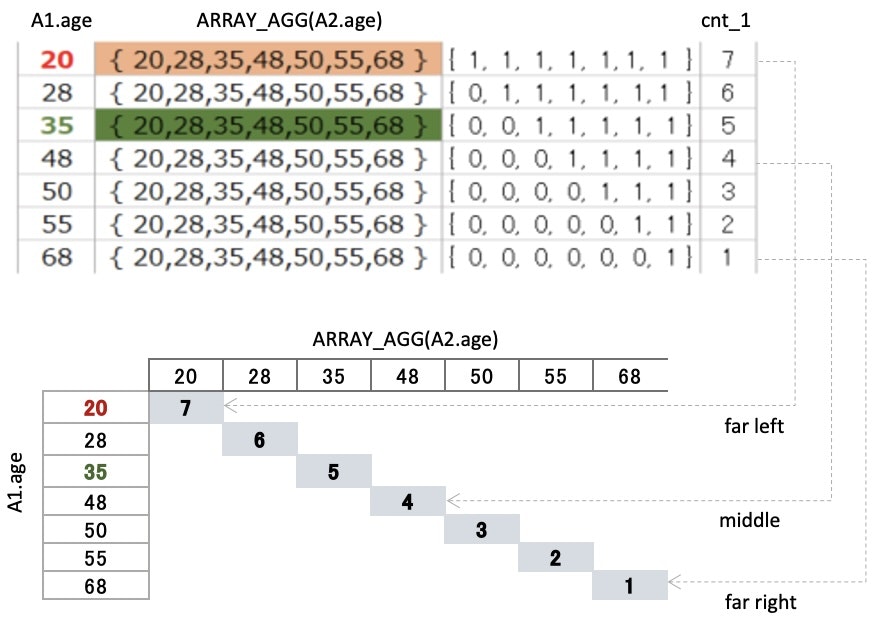
cnt_1 represents positions
cnt_1 is the sum of all the comparison results(0 or 1)
that come from the CASE statement
This number will be the key
to find the median (overlapping number)
〜〜 (・_・?)
we call A2.age(20,28,35,48,50,55,68)
as set A, here
◾️ A1.age is 20
Compare 20 and set A
All return values from case statement are TRUE
⇒ there are seven『1』
other words・・
there are 7 numbers that are grater than or equal to 20
20 is the smallest number, so it comes to the far left
〜〜〜〜〜〜〜〜〜〜〜〜〜〜〜〜
◾️ A1.age is 48
Compare 48 and set A
Case statement return TRUE
when A2.age are 48,50,55 and 68
⇒ there are four『1』
other words・・
there are 4 numbers that are grater than or equal to 48
the position of『48』is in the middle
〜〜〜〜〜〜〜〜〜〜〜〜〜〜〜〜
◾️ A1.age is 68
Compare 68 and set A
Case statement return TRUE
when A2.age is only 68
⇒ there is one『1』
other words・・
there is only 1 number that are grater than or equal to 68
68 is the largest number, so it comes to the far right
▼ cnt_1(number) represents positions
Choose 『left side data』
SELECT
  A1.age
-- ,ARRAY_AGG(A2.age) AS ary
-- ,ARRAY_AGG(CASE WHEN A2.age >= A1.age THEN 1 ELSE 0 END) AS flg_1
 ,SUM(CASE WHEN A2.age >= A1.age THEN 1 ELSE 0 END) AS cnt_1
 ,COUNT(A1.age)/2.0 AS middle
FROM ages A1, ages A2
GROUP BY
  A1.age
HAVING
  SUM(CASE WHEN A2.age >= A1.age THEN 1 ELSE 0 END) >= COUNT(A1.age)/2.0
▼ Output
| A1.age | cnt_1 | middle |
|---|---|---|
| 20 | 7 | 3.5 |
| 28 | 6 | 3.5 |
| 35 | 5 | 3.5 |
| 48 | 4 | 3.5 |
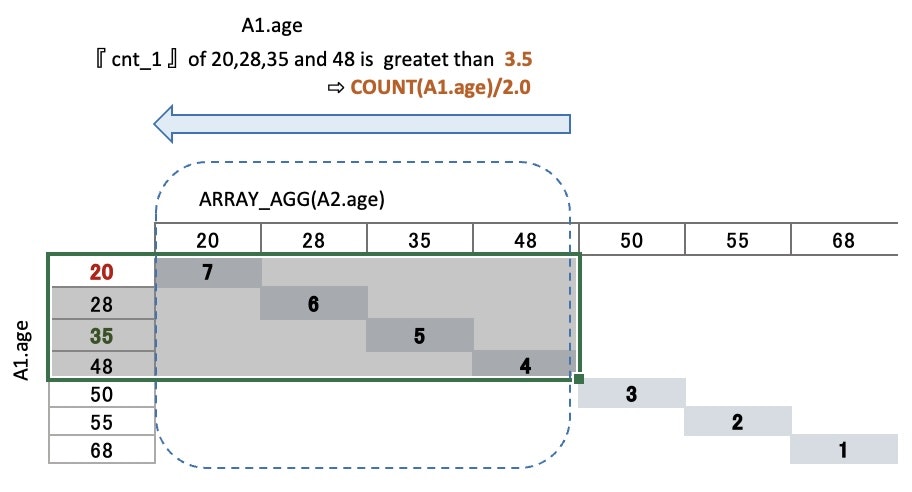
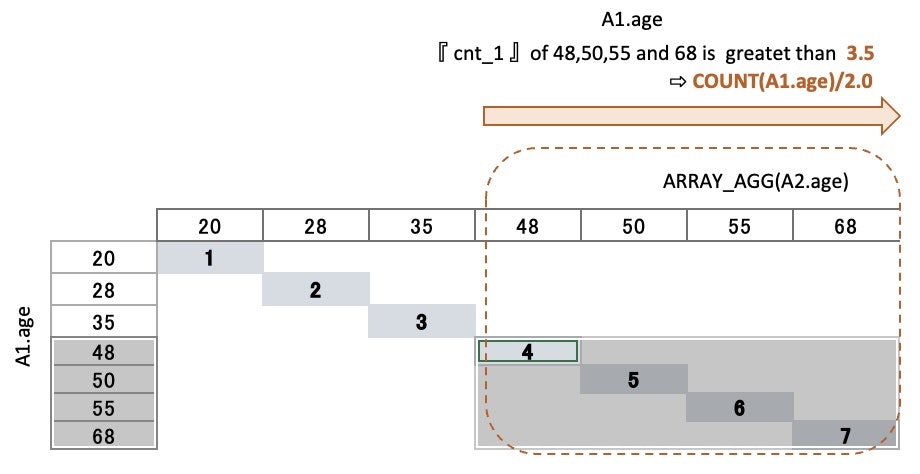
Choose『left side data』with HAVING
⇒ numbers that are greater than the midpoint
What is the midpoint?
The location(1~7) is determined by cnt_1
⇒ The middle number of 7 is 3.5
⇒ COUNT(A1.age)/2.0
⇒ we call 3.5 is the midpoint here
Choose the numbers where ・・
cnt_1 is greater than or equal to the midpoint(3.5)
⇒ 『left side data』are left
20 28 35 48 50 55 68
▼ Choose『left side data』
choose『right side data』in the same way ・・
next
Create 『right side data』 | Pre-process
SELECT
  A1.age
 ,ARRAY_AGG(A2.age) AS ary
 -- 『left side data』has the opposite inequality sign
 ,ARRAY_AGG(CASE WHEN A2.age <= A1.age THEN 1 ELSE 0 END) AS flg_2
 ,SUM(CASE WHEN A2.age <= A1.age THEN 1 ELSE 0 END) AS cnt_2
FROM ages A1, ages A2
GROUP BY A1.age
▼ Output(top image)
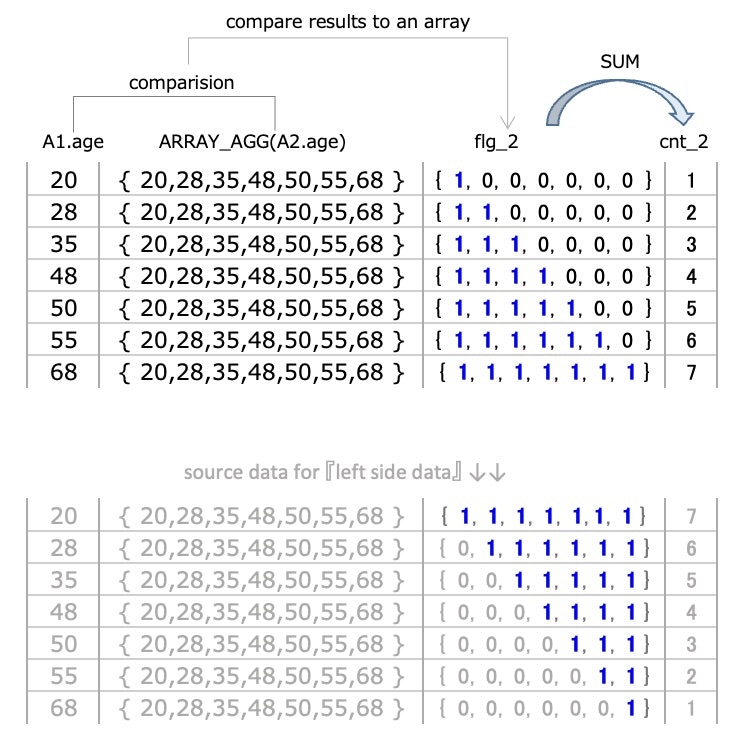
The way of choosing『right side data』is almost
the same as the『left side data』
except the inequality sign is opposite
so skip details
The results of comparison A1.age and A2.age are symmetric
⇒ check the order of 『1』
it's kind of understandable (。-_-。)
Compare A1.age and A2.age, again
【check A1.age is 35】
We did the same comparison before ・・
because of the opposite inequality sign
the results(TRUE or FALSE) are different
▼ Output
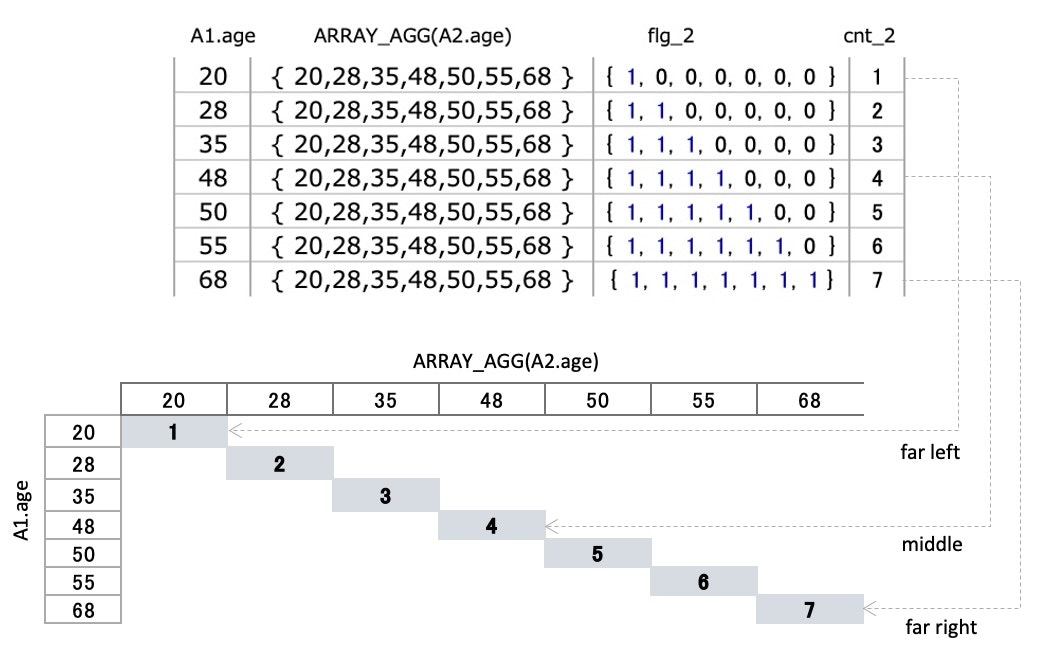
cnt_2 represents positions
Like『left side data』・・
determine the position of the seven numbers using cnt_2
⇒ cnt_2 is the SUM of comparison results
we use cnt_2 to choose the numbers
that are greater than or equal to the midpoint(3.5)
▼ cnt_2 represents positions
Choose 『right side data』
SELECT
  A1.age
-- ,ARRAY_AGG(A2.age) AS ary
-- ,ARRAY_AGG(CASE WHEN A2.age <= A1.age THEN 1 ELSE 0 END) AS flg_2
 ,SUM(CASE WHEN A2.age <= A1.age THEN 1 ELSE 0 END) AS cnt_2
 ,COUNT(A1.age)/2.0 AS middle
FROM ages A1, ages A2
GROUP BY
  A1.age
HAVING
  SUM(CASE WHEN A2.age <= A1.age THEN 1 ELSE 0 END) >= COUNT(A1.age)/2.0
▼ Output
| A1.age | cnt_2 | middle |
|---|---|---|
| 48 | 4 | 3.5 |
| 50 | 5 | 3.5 |
| 55 | 6 | 3.5 |
| 68 | 7 | 3.5 |
Choose 『right side data』with HAVING
Add a condition
⇒ HAVING cnt_2 >= 3.5
Choose the numbers that are grater than or equal to the midpoint(3.5)
⇒ 『right side data』are left
20 28 35 48 50 55 68
▼ Choose 『right side data』
The goal is in sight (´д`;)
Retrive the overlapping number of『left side data』
and『right side data』in the end
Answer SQL
SELECT A1.age
FROM ages A1, ages A2
GROUP BY A1.age
HAVING
  -- choose『left side data』
  SUM(CASE WHEN A2.age >= A1.age THEN 1 ELSE 0 END) >= COUNT(A1.age)/2.0
  AND
  -- choose『right side data』
  SUM(CASE WHEN A2.age <= A1.age THEN 1 ELSE 0 END) >= COUNT(A1.age)/2.0
▼ Output
| A1.age |
|---|
| 48 |
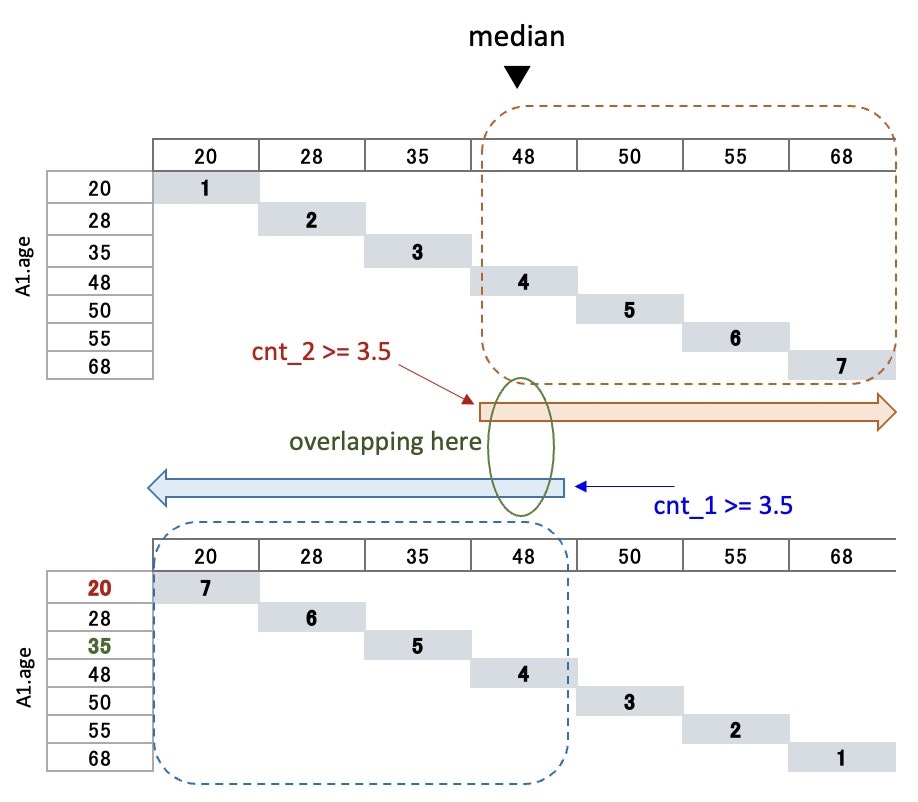
The important thing here is・・
the conditions for retriving『left side data』
and『left side data』have=
↓
cnt_1 >= the midpoint (3.5)
cnt_2 <= the midpoint (3.5)The
=sign creates overlapping parts
▼ The overlapping part
【cautionary points】
This query works
if the number of data is odd
if the number is even
this does not work
Table & Data | Even Data
DELETE FROM ages;

INSERT INTO ages VALUES('A01',	20);
INSERT INTO ages VALUES('A02',	28);
INSERT INTO ages VALUES('B04',	35);
INSERT INTO ages VALUES('B07',	48);
INSERT INTO ages VALUES('C03',	50);
INSERT INTO ages VALUES('C06',	55);
-- INSERT INTO ages VALUES('C08',	68);
Delete one row and change it to 6 rows in total
Execute Answer SQL
SELECT
  A1.age
  ,COUNT(A1.age)/2.0 AS middle -- the midpoint
FROM ages A1, ages A2
GROUP BY A1.age
HAVING
  -- choose『left side data』
  SUM(CASE WHEN A2.age >= A1.age THEN 1 ELSE 0 END) >= COUNT(A1.age)/2.0
  AND
  -- choose『right side data』
  SUM(CASE WHEN A2.age <= A1.age THEN 1 ELSE 0 END) >= COUNT(A1.age)/2.0
▼ Output
| A1.age | middle |
|---|---|
| 35 | 3.0 |
| 48 | 3.0 |
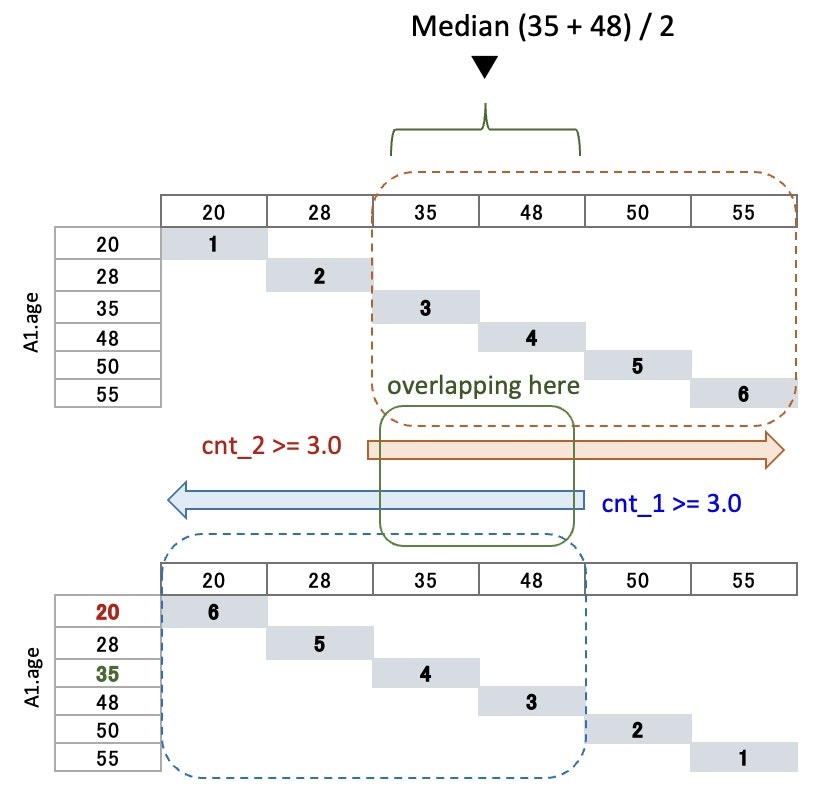
Add the midpoint in SELECT clause
then execute the query
⇒ The output is two rows
⇒ check the below image
Getting out『left side data』and『right side data』
that are grater than the midpoint,
there are two overlap numbers
so the median should be (35+48)/2
⇒ average
▼ two overlap numbers
Modify the Andwer SQL
SELECT AVG(b1.age) AS age
FROM (
  SELECT A1.age
  FROM ages A1, ages A2
  GROUP BY A1.age
  HAVING
    -- choose『left side data』
    SUM(CASE WHEN A2.age >= A1.age THEN 1 ELSE 0 END) >= COUNT(A1.age)/2.0
    AND
    -- choose『right side data』
    SUM(CASE WHEN A2.age <= A1.age THEN 1 ELSE 0 END) >= COUNT(A1.age)/2.0
) AS b1
▼ Output
| A1.age |
|---|
| 41.5 |
Changed Answer SQL to a subquery
to retrive the average value
This will allow you to find the median
for both even and odd numbers
That's all ヾ( ˆoˆ )/