所得税の算出方法をプログラム化してみた
フリーランスの税金を調べるついでにコードで遊んでいました。
ずっと勉強しているとアウトプットしたい欲にかられます。
特に使い道はないです。
法改正されてて情報が古くなる可能性はあります。
算出方法について
オフィシャルを参考に
国税庁No.2260 所得税の税率
所得税の算定基礎となる所得金額=収入-必要経費-各種控除
これに金額に応じた税率が適用されて、さらに控除額が引かれたものが所得税になります。
さらに令和19年までは、ここから復興特別所得税として2.1%が追加で課税されます。
実装
まずは定番のものをインポートします。
作成後にグラフで確認するので、そのためのフォーマットも追加します。
import numpy as np
import pandas as pd
import matplotlib.pyplot as plt
from matplotlib.ticker import ScalarFormatter, PercentFormatter
関数部分
所得から経費を差し引いた数値を入力すれば所得税が返ってきます。
他に必要な情報
p:税率
bin:税率の境界値
deduction:控除額
SpecialTax:復興特別所得税の税率
ここらへんは変更に備えて定型化したい。
def CalcTax(income):

  p = [0.05, 0.10, 0.20, 0.23 ,0.33 , 0.40, 0.45]
  bin = [i*10000 for i in [0, 195, 330, 695, 900, 1800, 4000, np.inf]]
  deduction = [0, 97500, 427500, 636000, 1536000, 2796000, 4976000]
  SpecialTax = 0.021
  step = len(p)

  ans = 0
  i = 0
  while i <= step:
    if (income >= bin[i]) and (income < bin[i+1]):
      ans = (income*p[i] - deduction[i]) * (1 + SpecialTax)
      break
    i+=1

  return ans
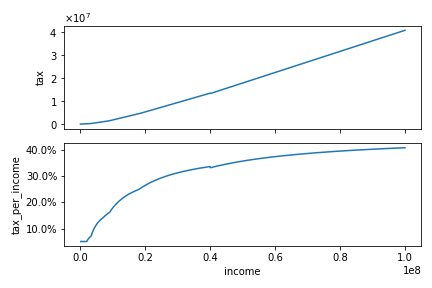
所得税のビジュアライゼーション
実際に払う所得税の金額とそれが収入に占める金額(ウォレットシェア)
の二つのグラフを出してます。
体裁を整えるのにset_major_formatterを使用
税率は段階的に上がっていますが、
累進課税なので実際の負担額は滑らかに上がっていきますね。
inc = np.arange(0, 10**8, 10**5)
tax = [CalcTax(i) for i in inc]

fig, (ax1, ax2) = plt.subplots(2, 1, sharex=True)

ax1.plot(inc, tax)
ax1.set_ylabel('tax')
ax1.yaxis.set_major_formatter(ScalarFormatter(useMathText=True))

ax2.plot(inc, tax/inc)
ax2.set_xlabel('income')
ax2.set_ylabel('tax_per_income')
ax2.yaxis.set_major_formatter(PercentFormatter(1.0))

fig.tight_layout()