Julia のDataFramesはPythonでいえばpandasに対応する。Pythonではmatplotlib.pyplot がpandasのデータフレームをサポートしていてそのままぷろっとできるようだ。JuliaだとPlots ライブラリはDataFramesをサポートしていない。
julia> d = DataFrame(Dict("key"=>[1, 2, 3, 4],
  "v0"=>[10, 20, 10, 5], "v1"=>[0, 10, 20, 30]))
4×3 DataFrame
 Row │ key    v0     v1
     │ Int64  Int64  Int64
─────┼─────────────────────
   1 │     1     10      0
   2 │     2     20     10
   3 │     3     10     20
   4 │     4      5     30

julia> Plots.plot(d)
ERROR: Cannot convert DataFrame to series data for plotting
StatsPlots
StatsPlots
というパッケージがあり、これを使うとDataFrameを直接プロットできる。
julia> import StatsPlots
julia> StatsPlots.@df d plot(:key, [:v0, :v1])

が、これはなかなかよくわからないライブラリで、マクロで書かれているせいか、挙動がよくわからない。[:v0, :v1]を変数として与えるとそれだけで動かない。
julia> vs = [:v0, :v1]
2-element Vector{Symbol}:
 :v0
 :v1

julia> StatsPlots.@df d plot(:key, vs)
ERROR: Cannot convert Symbol to series data for plotting
Stacktrace:
...
plot_df
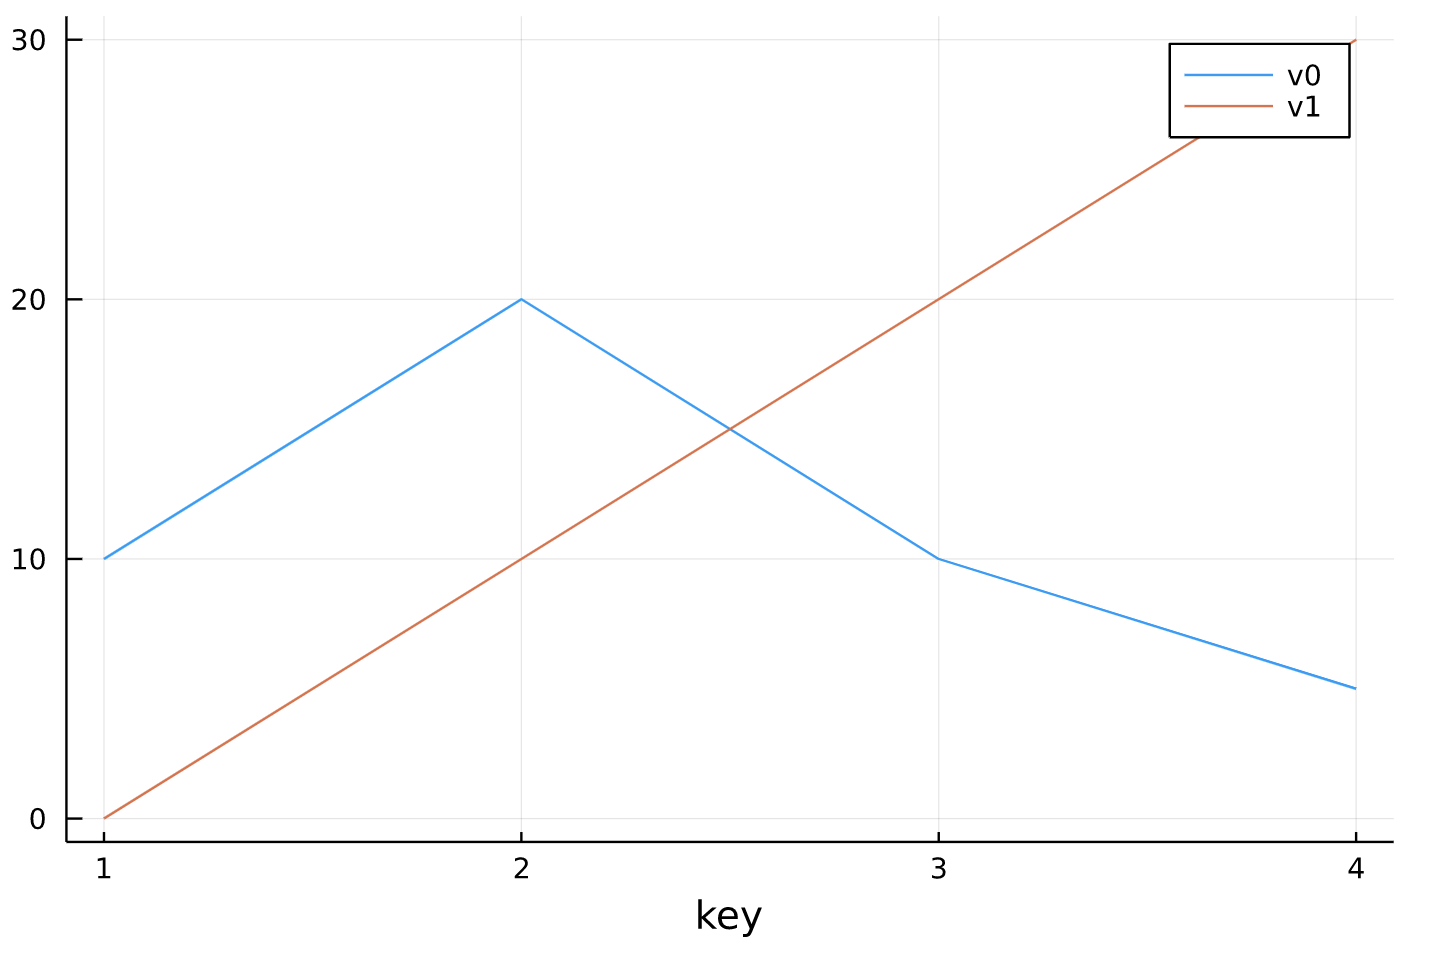
仕方ないので自分で適当に書いてみる。x軸にする列をkeyとして指定すると、残りの列をデータとしてプロットする。ラベルもつける。一気に複数の線を引いて複数のラベルを指定することができるはずなのだが、なんかうまく行かないので、仕方なくループを回して一本ずつ線を引いている。
function plot_df(df, key)
    vals = filter((n)->! isequal(n, key), names(df))
    Plots.plot()
    Plots.xlabel!(key)
    for val in vals
        Plots.plot!(df[!,key], df[!, val], label=val)
    end
    Plots.plot!()
end
こんなふうにすると、
julia> plot_df(d, "key")
こうなる。