やりたいこと
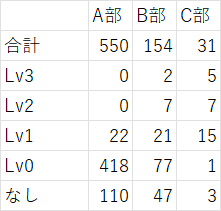
以下のようなデータExcelに入っている時に、A部・B部・C部のレベルの内訳をそれぞれ円グラフで示したいのです。
ソリューション
matplotlibを使います。もっといい書き方がありそうですが。
en.py
#!/usr/bin/env python
# coding: utf-8

# 必要なモジュールのインポート
import matplotlib.pyplot as plt
import japanize_matplotlib  # <- これ
import numpy as np
import pandas as pd

# 不要な警告を非表示にする
import warnings
warnings.filterwarnings('ignore')

# 入力Excelのファイル名、シート名
in_file = 'data.xlsx'
in_sheet1 = 'リスト'

#----------
# Excelの読込
df_1 = pd.read_excel(in_file, sheet_name=in_sheet1, index_col=0, header=0)
df_1 = df_1.drop('合計')

print(df_1)


# RGB値での色の指定(0から255の値)
colors = [
    (255, 170, 180),  # 赤
    (255, 255, 128),  # 黄
    (140, 255, 140),  # 緑
    (128, 192, 255),  # 青
    (128, 128, 128)   # 灰色
]

# RGB値を0から1にスケーリング
colors = [(r / 256, g / 256, b / 256) for r, g, b in colors]

# グラフの設定
pie_num = len(df_1.columns)
fig, axes = plt.subplots(1, pie_num)
fig.suptitle('レベル分布')

for i in range(pie_num):
    axes[i].pie(df_1[df_1.columns[i]], labels=df_1.index, startangle=90, colors=colors, counterclock=False, labeldistance=None)
    axes[i].axis('equal')  # 円を円形に保つ
    axes[i].set_title(df_1.columns[i])


# グラフを表示
plt.show()
とりあえず出力されたので、よかったです。今後コードは改善予定。
(おわり)
