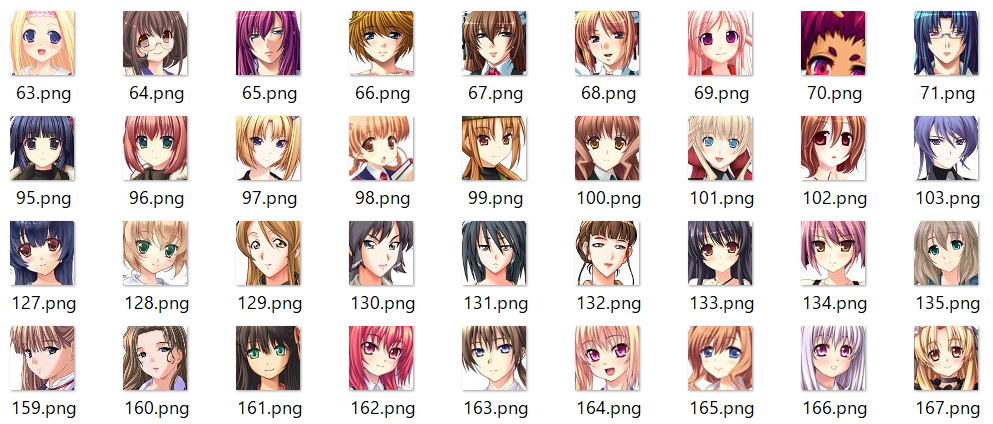
機械学習といえば画像処理です。PCA(主成分分析)やNMF(非負値行列因子分析)といった古典的な解析手法によって、多数の顔画像から主要な特徴量を抽出できるということで、さっそくアニメ顔を対象にやってみました。対象となるのは以下のような21,551通りの顔データです。https://www.kaggle.com/soumikrakshit/anime-faces からお借りしました。ありがとうございます。
解析によって、輪郭を決定づける成分、髪を決定づける成分などが視覚的に分解できたら面白いですね。
PCA
import cv2
import numpy as np
import matplotlib.pyplot as plt
from sklearn.decomposition import PCA

sample = 20000

X = []

for i in range(sample):
    file_name = str(i+1) + '.png'
    img = cv2.imread(file_name)
    img = img.reshape(12288)/255
    X.append(img)

pca = PCA(n_components=9, whiten=True)
pca.fit(X)
X_pca = pca.transform(X)

fig, axes = plt.subplots(3,3,figsize=(10,10))
for i,(component, ax) in enumerate(zip(pca.components_,axes.ravel())):
    ax.imshow(0.5-component.reshape((64,64,3))*10)
    ax.set_title('PC'+str(i+1))

print(pca.explained_variance_ratio_)

plt.show()
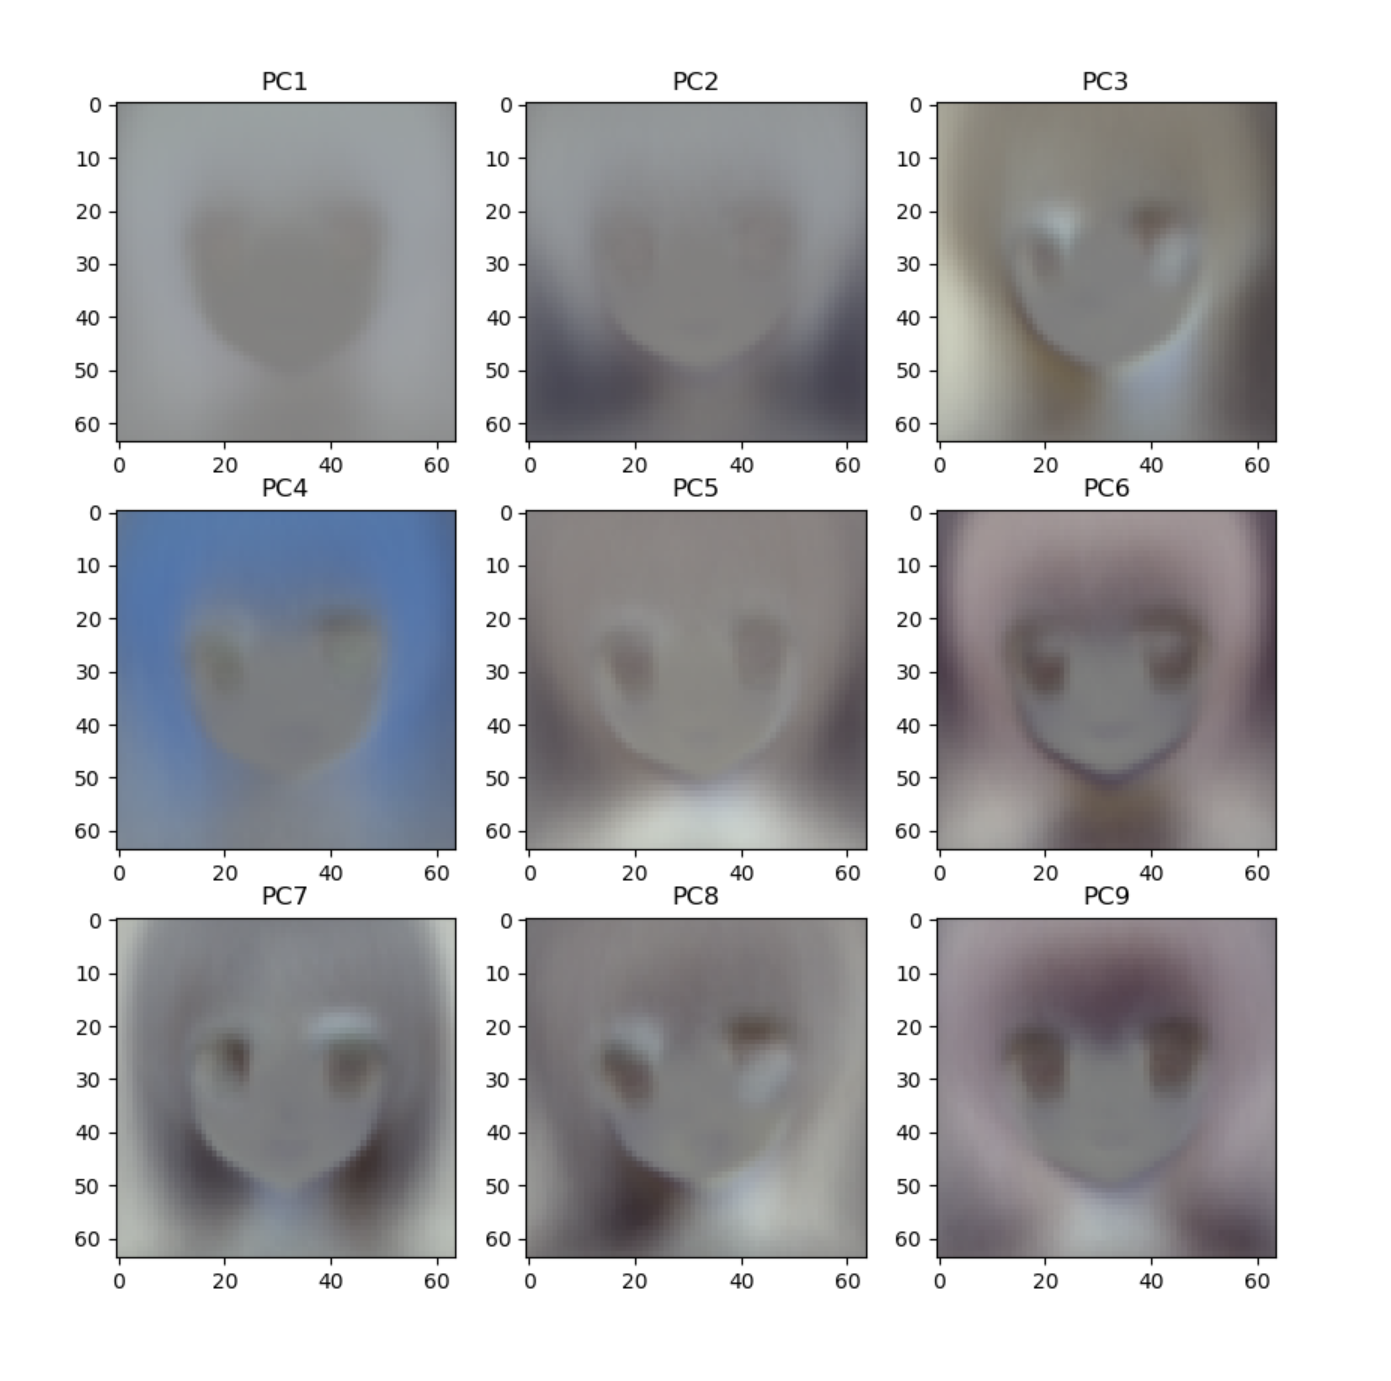
解析結果がこちら。
ホラーだ! 壁に滲んだ怨念の顔みたいになっとる!
PC1から順に画像の主要な部分を説明するように変数(ここでいうと座標とピクセル)を束ねたものになっているはずですが……
- PC1 全体の明るさ
- PC2 髪の全体的なボリューム?
- PC3 左を向いているかどうか?
みたいな傾向を無理すれば読めなくもないですが、明確な特徴量とはとても言えないですね。PCによる説明率を見ても、それほど集約できているとは言えなさそうです。残念。
print(pca.explained_variance_ratio_)
[0.21259875 0.06924239 0.03746094 0.03456278 0.02741101 0.01864574
 0.01643447 0.01489064 0.0133781 ]
NMF
import cv2
import numpy as np
import matplotlib.pyplot as plt
from sklearn.decomposition import NMF

sample = 20000

X = []

for i in range(sample):
    file_name = str(i+1) + '.png'
    img = cv2.imread(file_name)
    img = img.reshape(12288)/255
    X.append(img)

nmf = NMF(n_components=9)
nmf.fit(X)
# X_nmf = nmf.transform(X)

fig, axes = plt.subplots(3,3,figsize=(10,10))
for i,(component, ax) in enumerate(zip(nmf.components_,axes.ravel())):
    ax.imshow(component.reshape((64,64,3)))
    ax.set_title('component'+str(i+1))

plt.show()
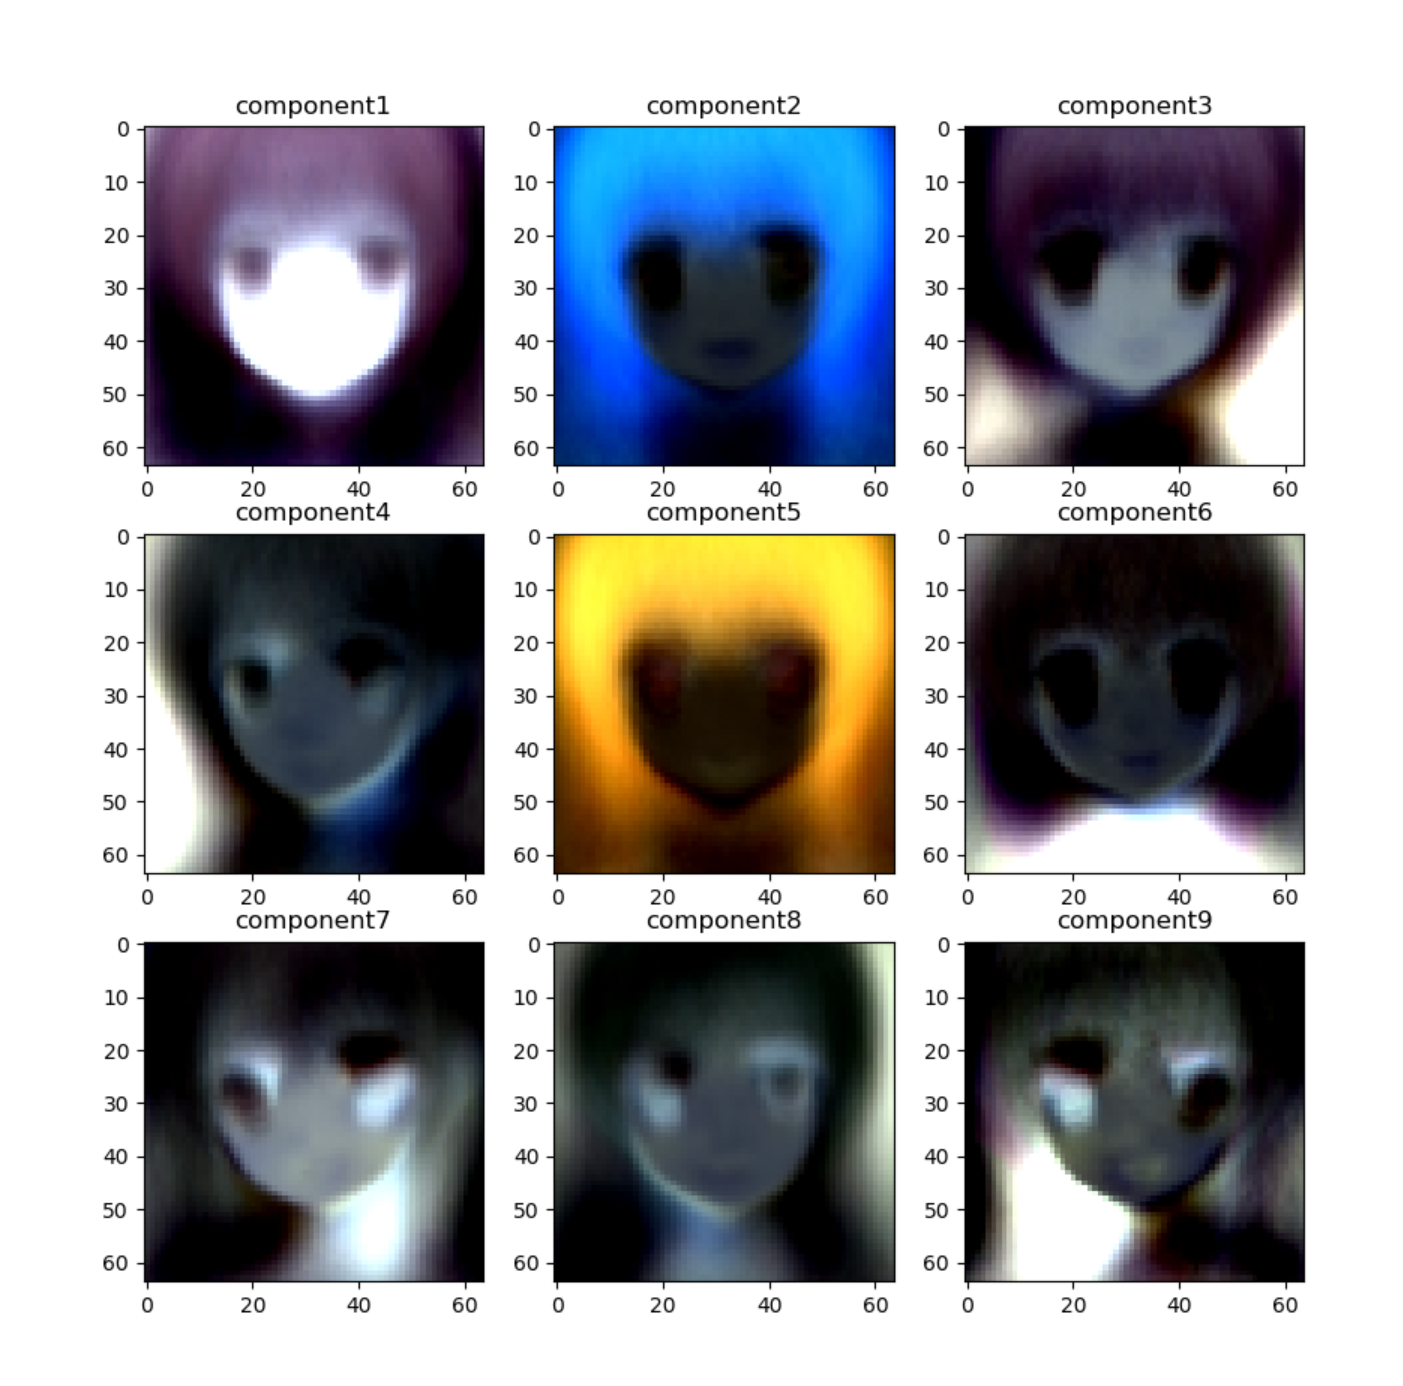
解析結果がこちら。
ホラーだ! フィルムに映り込んだ亡霊のネガになっとる! もはや解釈する気も起きない。
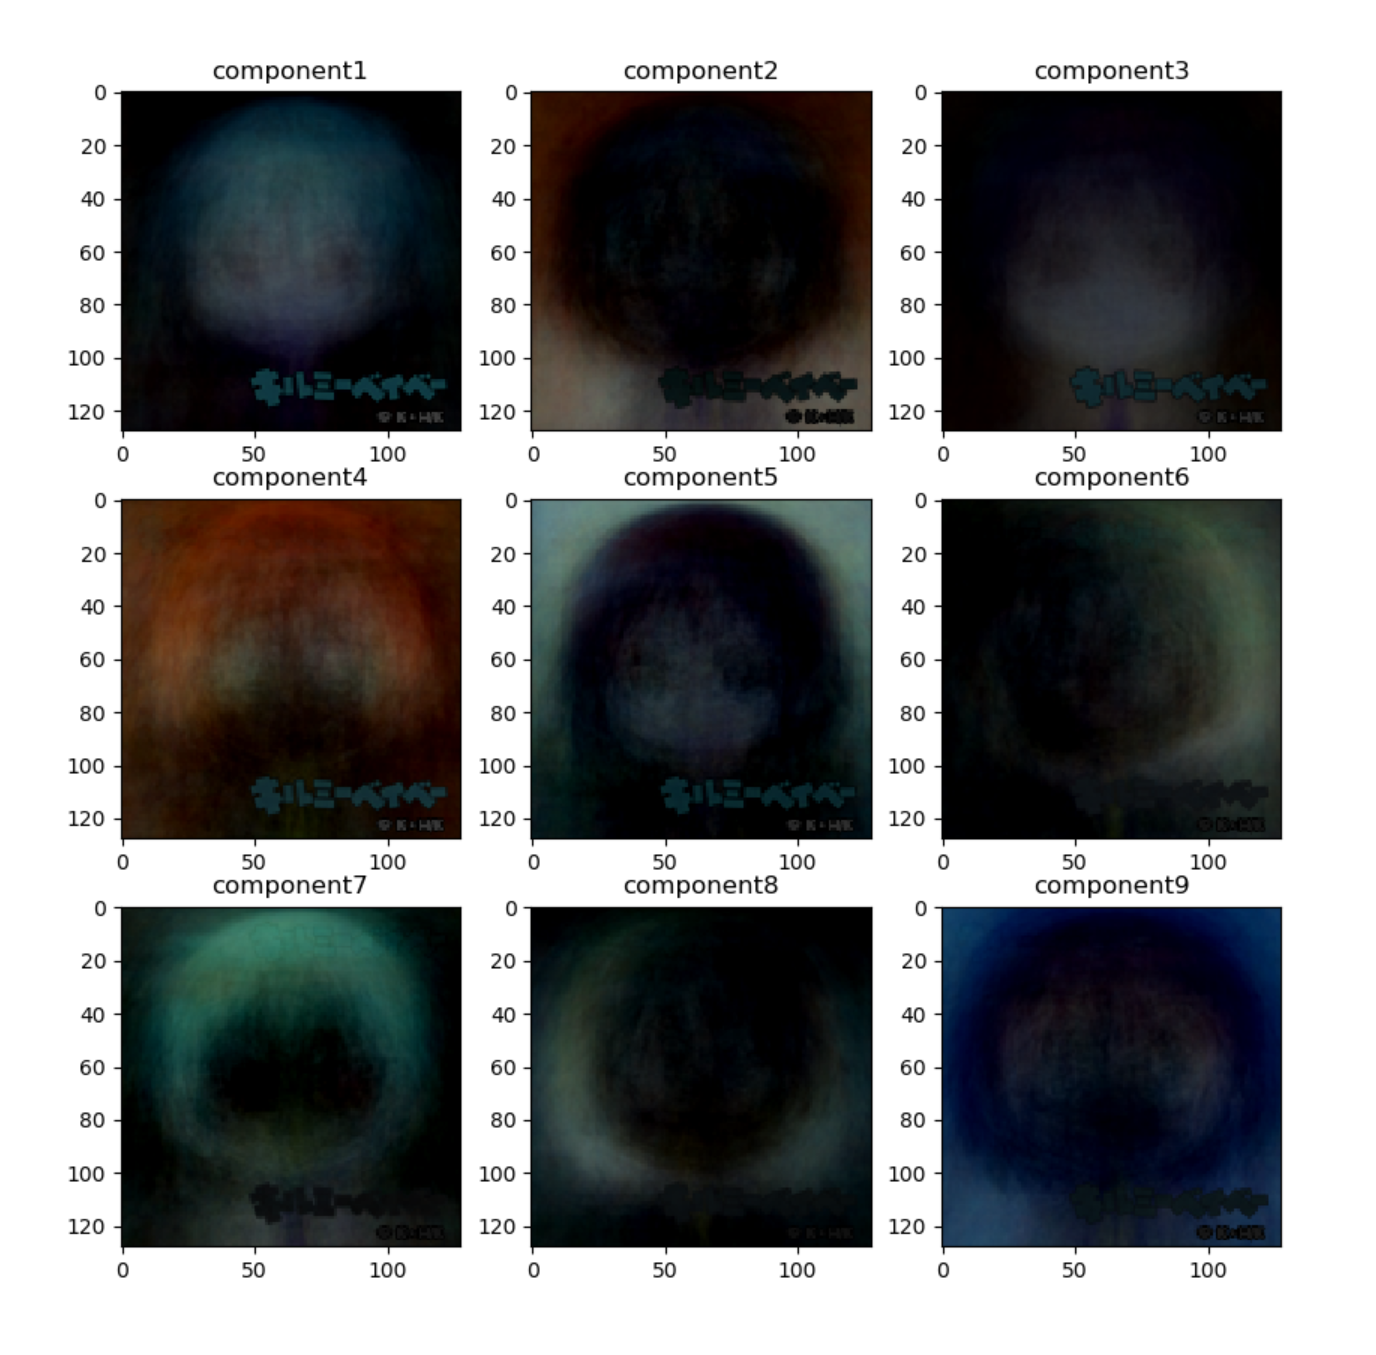
キルミーベイベー
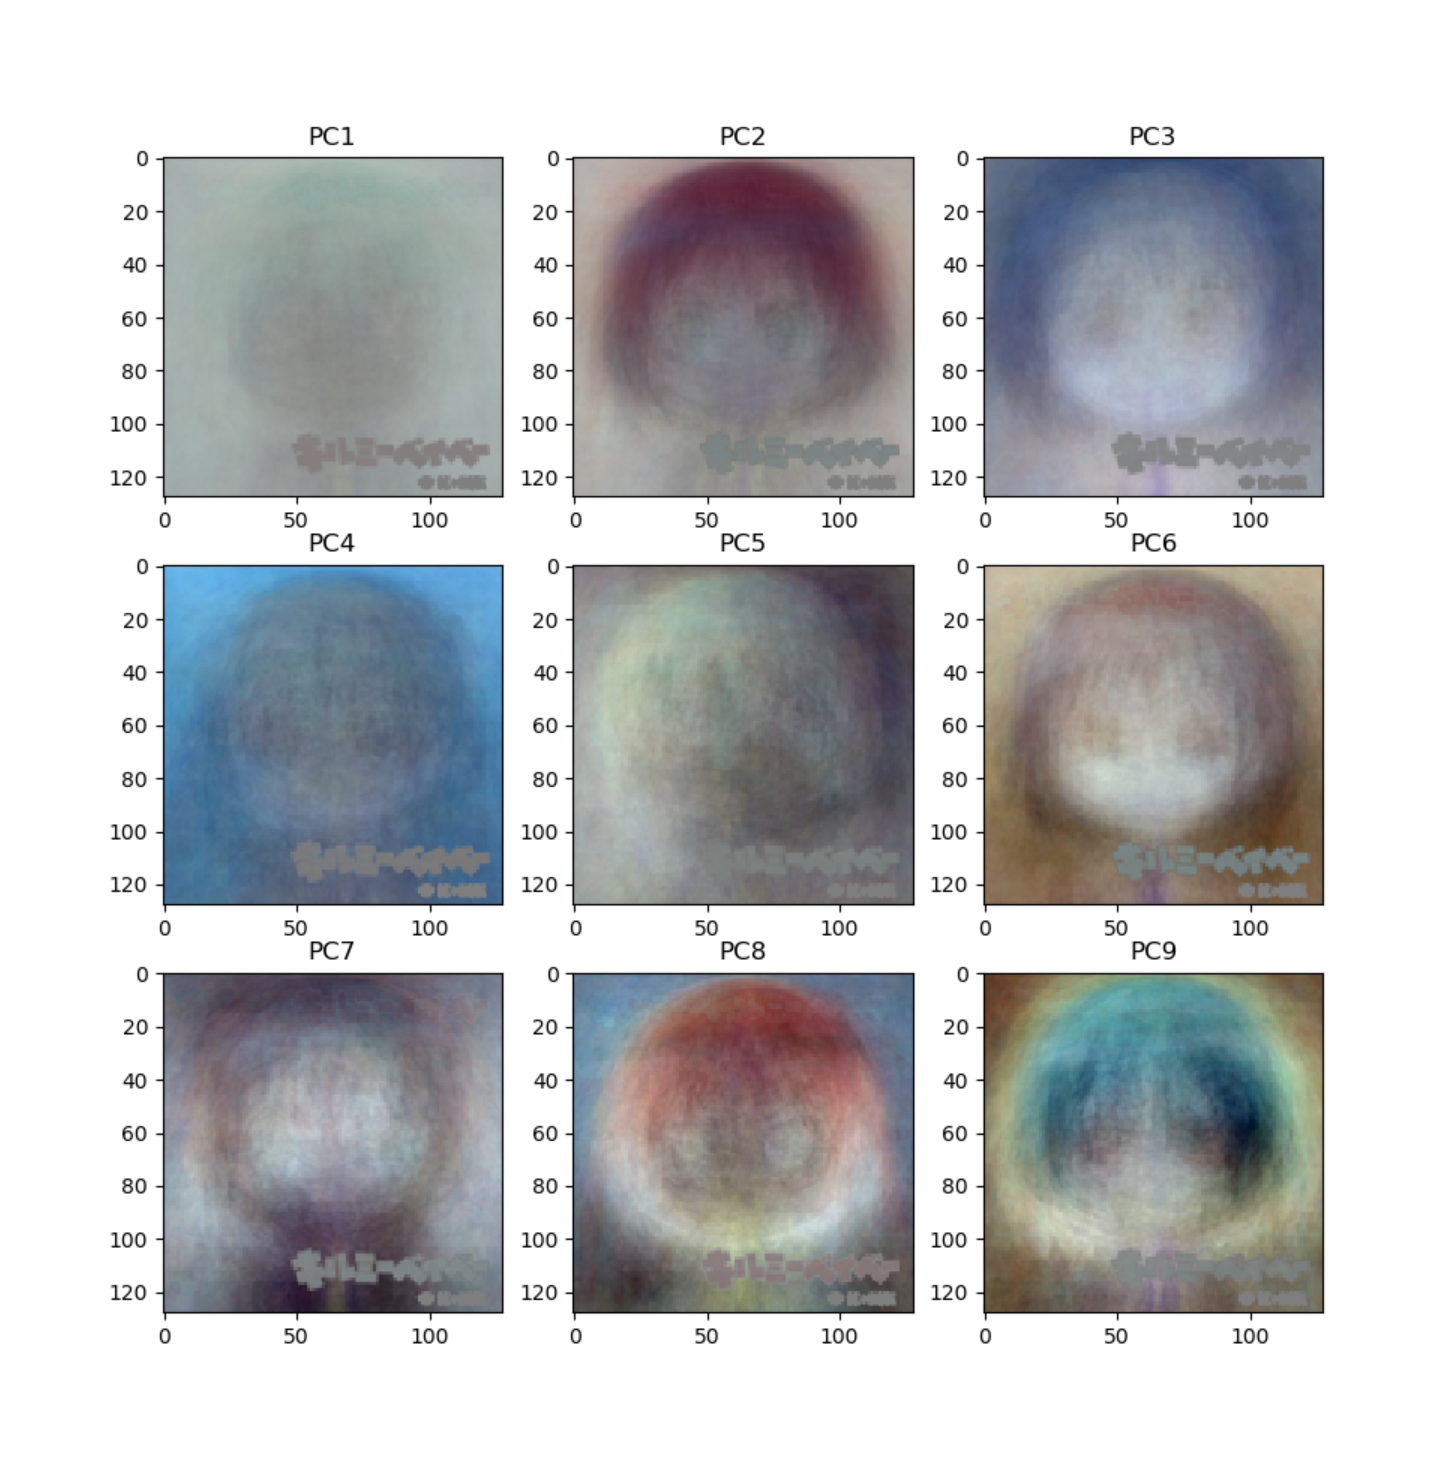
先人に倣ってキルミーベイベーでも解析を試みていきます。
南無。
結論
やはり線形的な手法だけで(それも教師なしで)画像の特徴量を抽出することは難しいようです。GANなどの発展的な手法を用いてさらなる解析を進めることが望まれるので勉強します、ハイ。
コードの解説
なんか短くなってしまったのでコードの解説。画像の読み込みと展開について。実行するpythonファイルと同じ場所に画像ファイルを置いておけば、ファイル名を指定するだけでアクセスできます。1.jpg、2.jpgというように名付けていけば単純なイテレーションでファイル名を指定できます。より一般的なコードだと、os.listdirでファイル名を取得しますが、今回はラクをしました。
読み込んだファイルはcv2モジュールにあるimreadという関数を使って配列化します。しかしこの配列は縦×横×RGBという3次元配列になっているので、後の解析に使うため、reshapeで1行の長いベクトルにします。今回は縦64、横64、RGBなので64*64*3=12288となります。また、配列の値が生データだとRGBの値が0~255なっているので、255で割ることにより0~1の間に収めます。
    file_name = str(i+1) + '.png'
    img = cv2.imread(file_name)
    img = img.reshape(12288)/255
以上の内容をコードにしたものが上です。
解析によって得られた成分は、PCAでもNMFでもcomponents_に格納されています。リファレンスはhttps://scikit-learn.org/stable/modules/generated/sklearn.decomposition.PCA.html とhttps://scikit-learn.org/stable/modules/generated/sklearn.decomposition.NMF.html のAttributes:を参照。これをpyplotモジュールにあるimshowという関数でグラフに表示します。これは先ほどとは逆に、解析結果(1行の長いベクトル)をまた縦×横×RGBに整形しなおす必要があるのでまたreshapeしていきます。
fig, axes = plt.subplots(3,3,figsize=(10,10))
for i,(component, ax) in enumerate(zip(pca.components_,axes.ravel())):
    ax.imshow(0.5-component.reshape((64,64,3))*10)
    ax.set_title('PC'+str(i+1))
以上の内容をコードにしたものが上です。axesは多数のグラフの中でどのグラフの位置にあるかとういことを示していますが、axes.ravelではそれを一連の配列として取得することができます。これも一種のreshapeのようなものですね。
