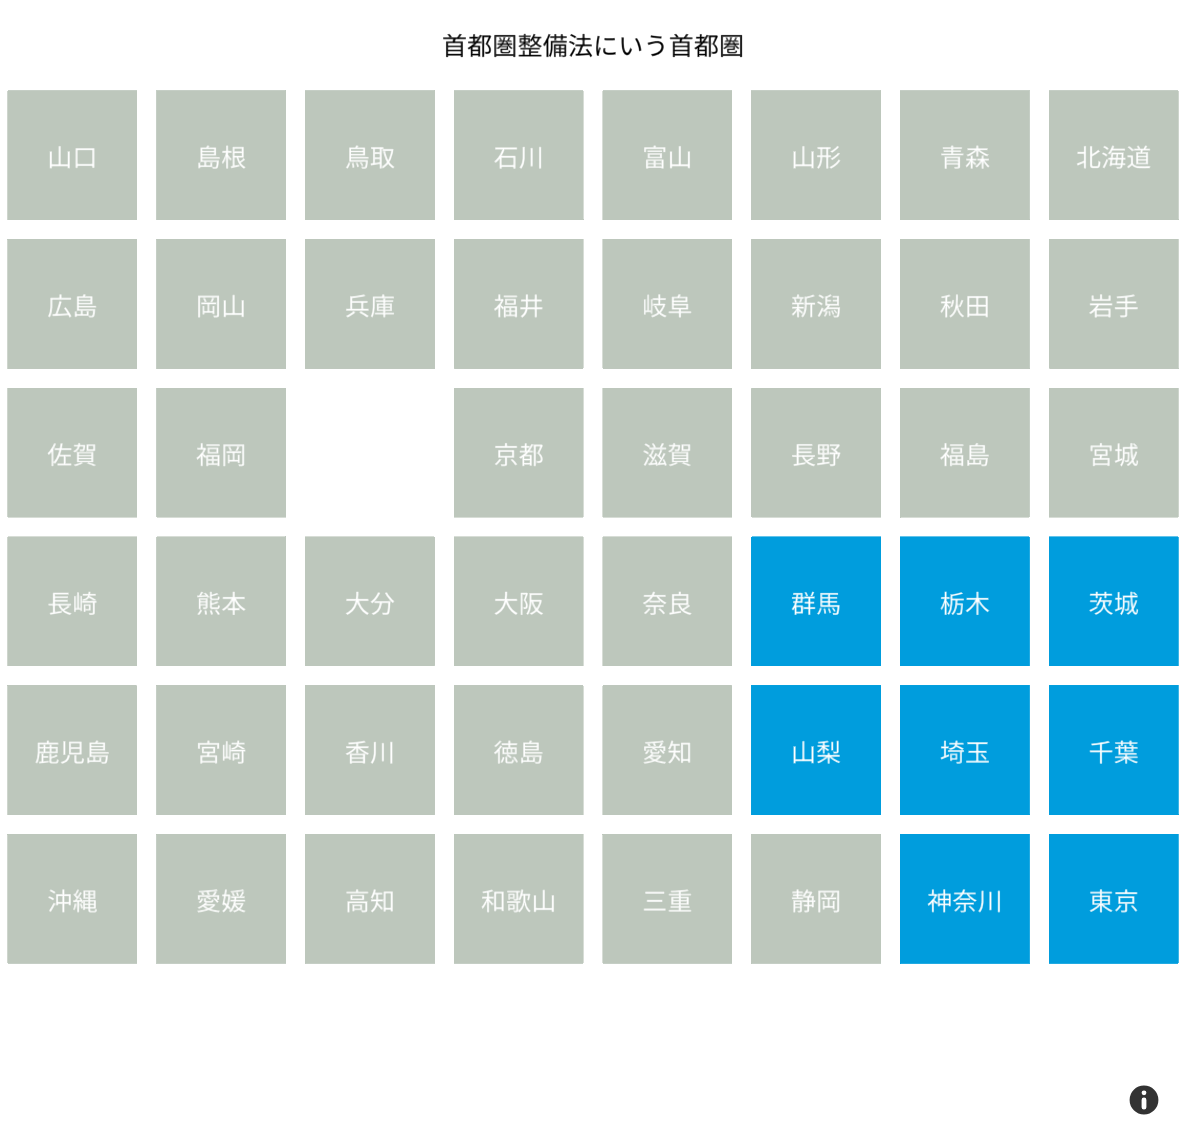
都道府県を 8 x 6 のタイルで表現して、そこに統計値などの指標を可視化していくアイディアをプロトタイプ実装してみました。

デモ
1. デフォルト
https://hfu.github.io/dash-prototype/
この記事の冒頭にある表示がされます。与えられた表示範囲に合わせてフィットする用に作ったつもりなので、iframe に入れて埋め込んでもらう用途を想定したいと思っています。
2. カスタマイズ例
JavaScript プログラム上でオプションを与えると、統計値や配色を変更できるように作ってあります。次の内容の HTML で、九州沖縄地方を色ぬりすることができます。
<!doctype html>
<html>
<head>
<meta charset="utf-8">
<meta name="viewport" content="width=device-width, initial-scale=1">
<title></title>
<link rel="stylesheet" type="text/css" href="https://api.tiles.mapbox.com/mapbox-gl-js/v0.53.1/mapbox-gl.css"/>
<style>
body { margin: 0; top: 0; bottom: 0; width: 100%; }
# map { position: absolute; top: 0; bottom: 0; width: 100%; }
</style>
<script src="https://api.tiles.mapbox.com/mapbox-gl-js/v0.53.1/mapbox-gl.js"></script>
<script src="https://hfu.github.io/dash-prototype/bundle.js"></script>
</head>
<body>
<div id="map"></div>
<script>
map = dash.createMap({
  title: '九州・沖縄地方',
  table: [[40, 41, 42, 43, 44, 45, 46, 47], 1],
  color: function(v) {
    if (v == 1) {
      return ['rgb', 254, 194, 64]
    } else {
      return ['rgb', 207, 207, 207]
    }
  }
})
</script>
</body>
</html>
title で題名が、tableで統計情報が設定できます。
table: [[40, 41, 42, 43, 44, 45, 46, 47], 1]は、都道府県コード 40, 41, 42, 43, 44, 45, 46, 47 には値 1 を割り当てる、という意味です。
その値それぞれに色を割り当てる関数を color でセットします。引数に値をとって、Mapbox GL JS 方式の色表現、つまり ['rgb', r, g, b]や['rgba', r, g, b, a]を返却するようにしてください。
これで、次の可視化ができます。

タイル配置のカスタマイズ
なお、タイル配置の変更もオプションで渡せば変えられるように作ったつもりです。たぶん、7 x 7 とか 10 x 5 で入れても、適当に調整すると思います。現在のタイル配置の設定は、次のように書きます。
  board: [
    [35, 32, 31, 17, 16, 6, 2, 1],
    [34, 33, 28, 18, 21, 15, 5, 3],
    [41, 40, null, 26, 25, 20, 7, 4],
    [42, 43, 44, 27, 29, 10, 9, 8],
    [46, 45, 37, 36, 23, 19, 11, 12],
    [47, 38, 39, 30, 24, 22, 14, 13]
  ],
レポジトリ
レポジトリを次の場所に置いています。
https://github.com/hfu/dash-prototype
ライセンス
私の仕事分については、パブリックドメイン扱いを目指した Unlicense でお願いします。
技術的な背景
- 技術的には、ベクトル系のウェブ地図技術である Mapbox GL JS で実現しています。なので、タイル配列と地理空間情報の間を統計値が自在に流れ込む、といった展開に向かうことも可能です。
- 都道府県を正方形に抽象化して 8 x 6 や 7 x 7、10 x 5 の配列に並べてみよう、というアイディアは、SNS での楽しい議論で鍛えられました。改めて、ありがとうございます。
今後の改善について
Issues で整理できればと思います。ここ Qiita でのコメントとしてご助言いただいてもありがたいです。
追記 2019-03-21
URL で発行できるようにしてみました。
例: https://hfu.github.io/dash-prototype/q.html?title=京都・大阪・奈良の3府県の総称としての京阪奈&prefs=26,27,29&color=green