パレット
国連ベクトルタイルツールキットでベクトルタイルのスタイルを作るときに、私は style.json を直接書くこともしなければ、グラフィカルなツールも使いません。
HOCON でレイヤごとにスタイルを書いて include する形をとっています。
スタイルを書くときに煩雑になり、また手抜きの温床になりがちなのが色の指定です。色の指定にも include を使うことで、よく統制されたパレットを使いやすくなると思いました。
ディスプレイや紙と異なるのですから、ディスプレイに合わせて設計されたパレットを使うべきです。私は 2014 Material Design color palette を使うことが多いです。
Material Design color palette の Mapbox Style / HOCON 実装
スタイルの記述が、次のように実現できるようにします。
line-color: include "https://unvt.github.io/mat/orange-300"
その実装を https://github.com/unvt/mat に置きました。
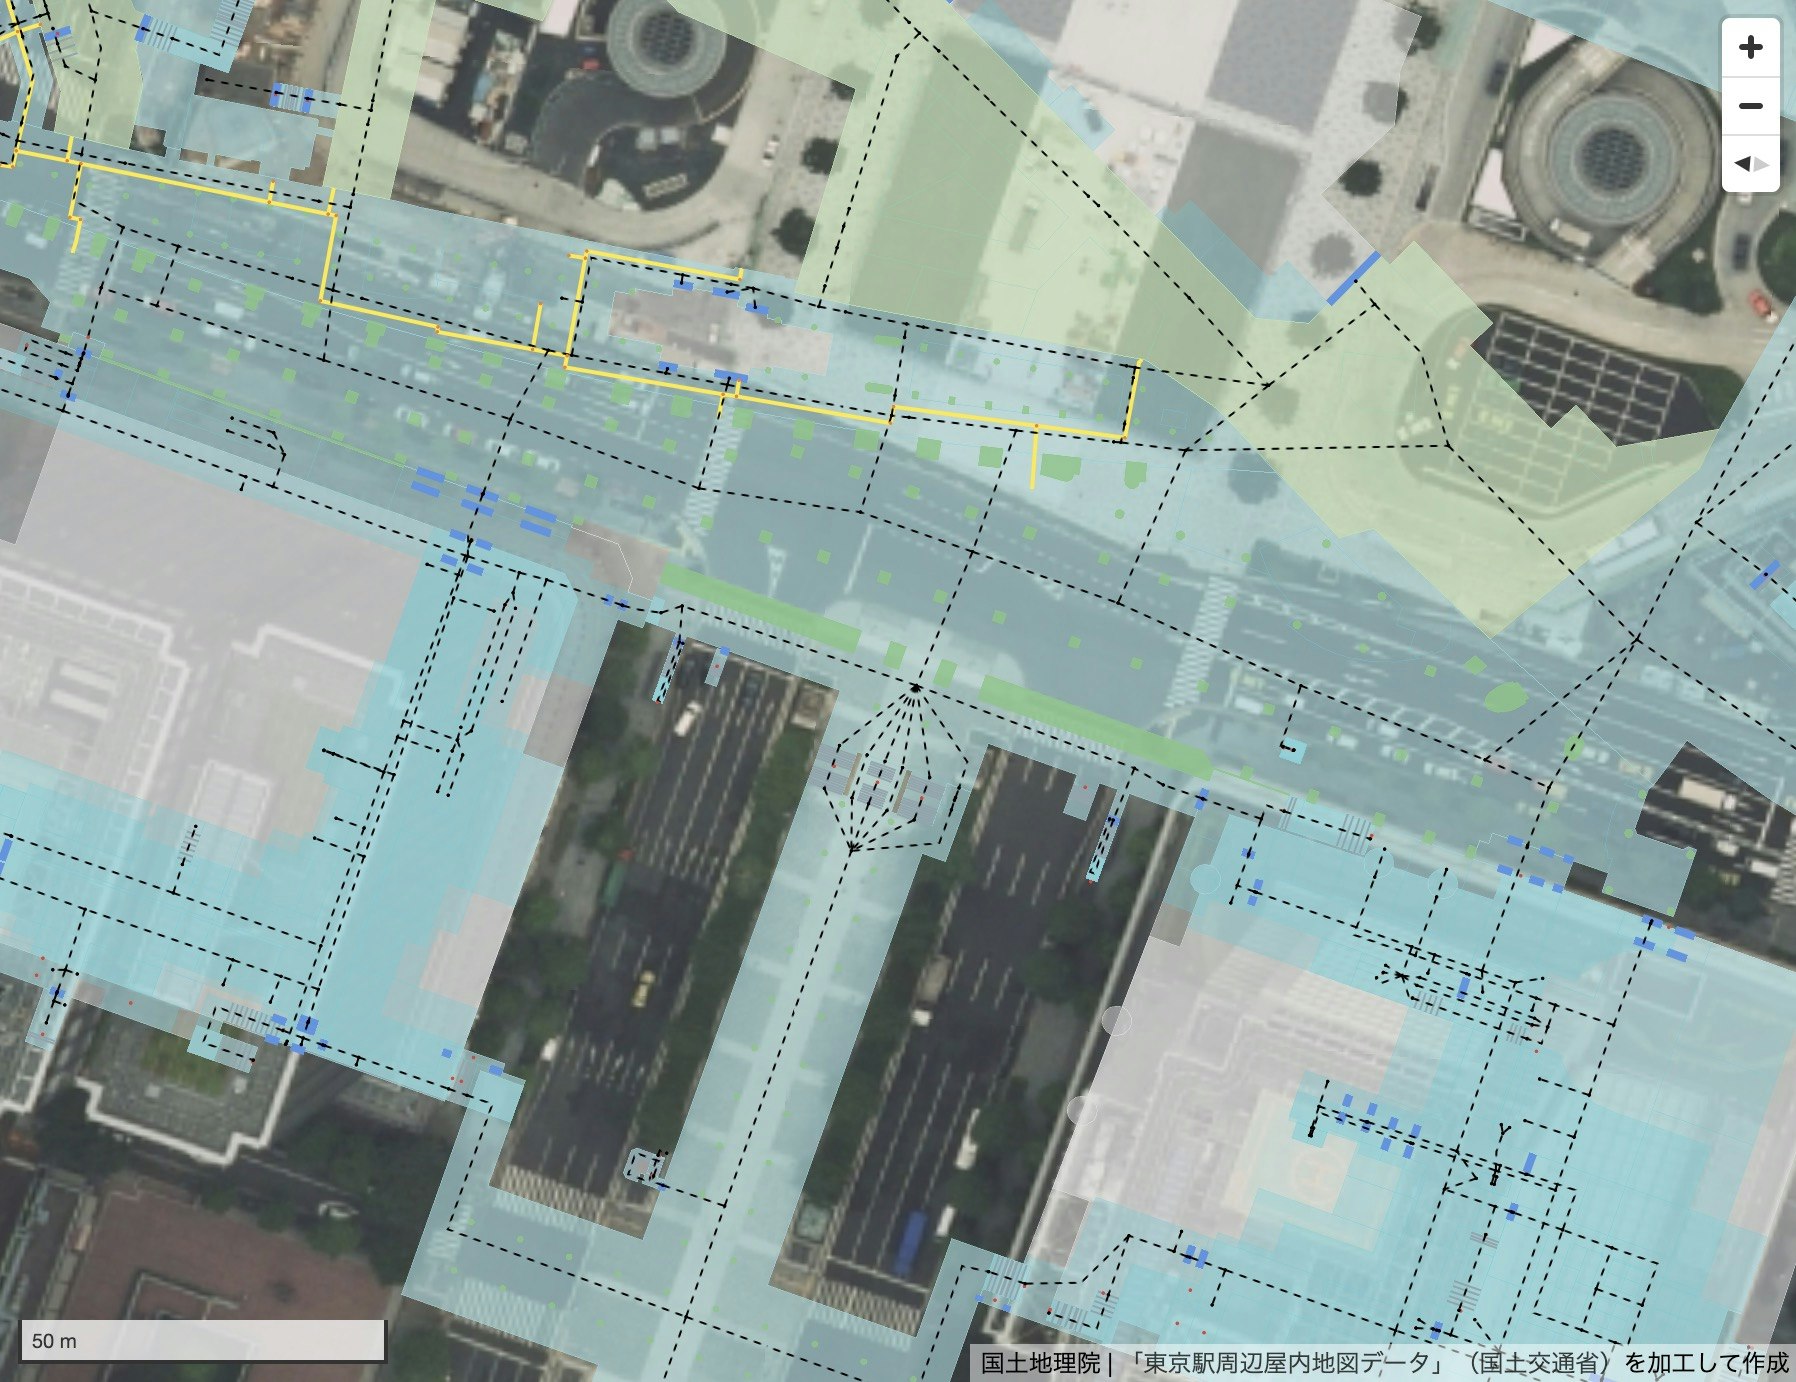
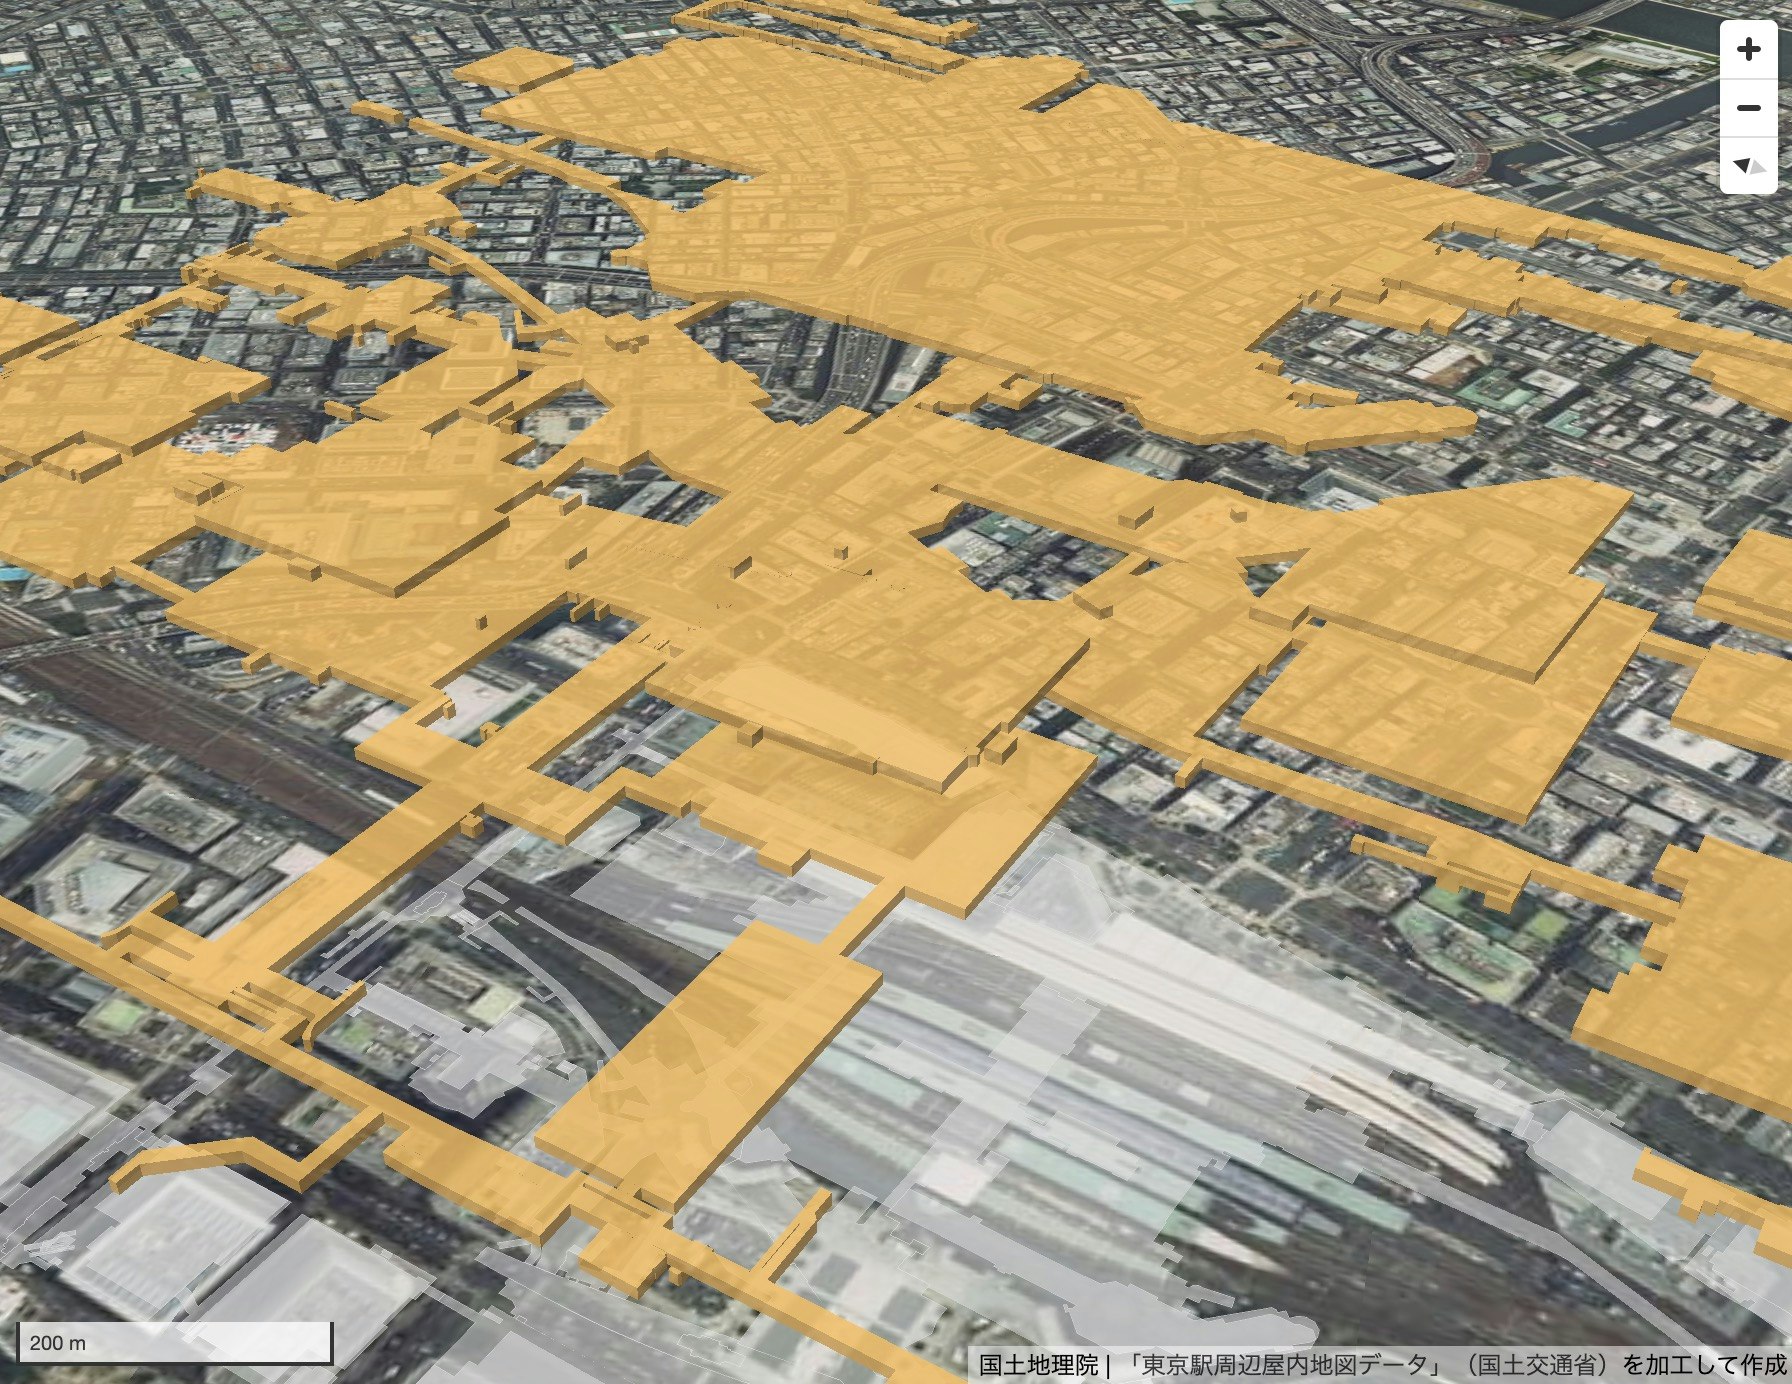
屋内地図データのベクトルタイル化
屋内地図データのベクトルタイル化をたまたま手掛けていたので、上記のパレットを使用してみました。例えば、次のような形で記載しています。
id: drawing
type: line
source: v
source-layer: drawing
paint: {
  line-color: include "https://unvt.github.io/mat/blue-gray-300"
}
レポジトリは https://github.com/optgeo/technopolis で、テストサイトは https://optgeo.github.io/technopolis です。
上空にフロアの上下関係を表現しています。
地上には、図面を素直に置いています。