plotly.jsを使用する機会があったので時系列折れ線グラフ作成までの手順を紹介します。
plotly.jsとは
Plotly.jsは、データ可視化のための強力なJavaScriptライブラリであり、Webベースのインタラクティブなグラフやチャートを作成するために利用されます。このライブラリは、豊富な機能を提供し、多様なグラフやカスタマイズオプションを備えています。Plotly.jsを用いることで、データを効果的に表現し、ユーザーがグラフを探索したり分析したりすることが可能となります。
インストール
npm install react-plotly.js plotly.js plotly.js-basic-dist
or
yarn add react-plotly.js plotly.js plotly.js-basic-dist
グラフの作成
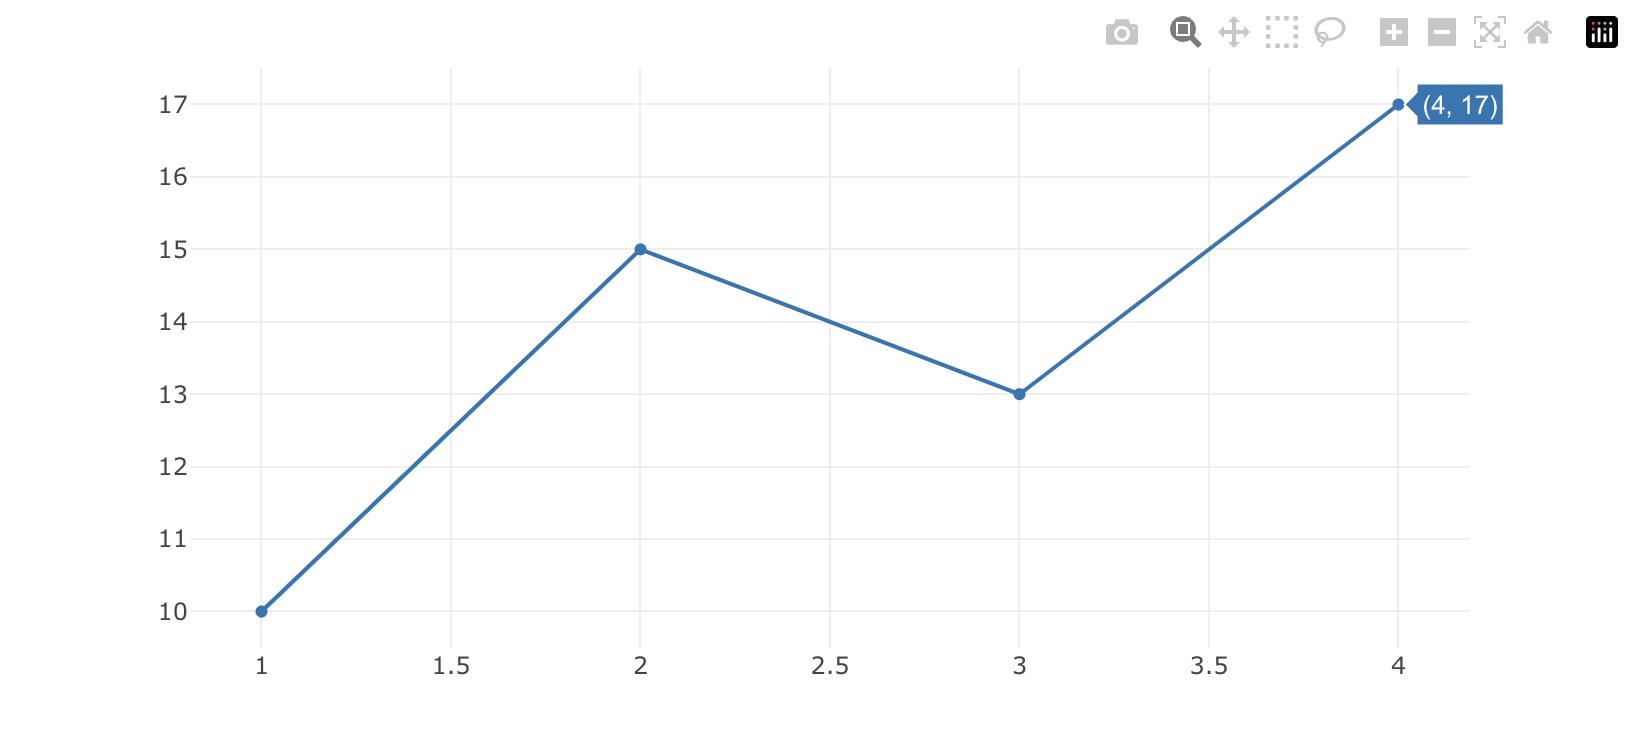
グラフはインストールしたPlotlyコンポーネントにdataを渡すだけで作成できます!
import Plotly from "plotly.js-basic-dist";
import createPlotlyComponent from "react-plotly.js/factory";

const Plot = createPlotlyComponent(Plotly);

const MyPlot = (): JSX.Element => {
    const trace1 = {
        x: [1, 2, 3, 4],
        y: [10, 15, 13, 17],
        // 今回は折れ線グラフを作成できる"lenes"を指定します
        type: "lines",
    };

    const data = [trace1] as Plotly.Data[];
    const layout = {
        width: 800,
        height: 400,
    } as Plotly.Layout;

    return (
        <Plot
            data={data}
            layout={layout}
        >
    )
};
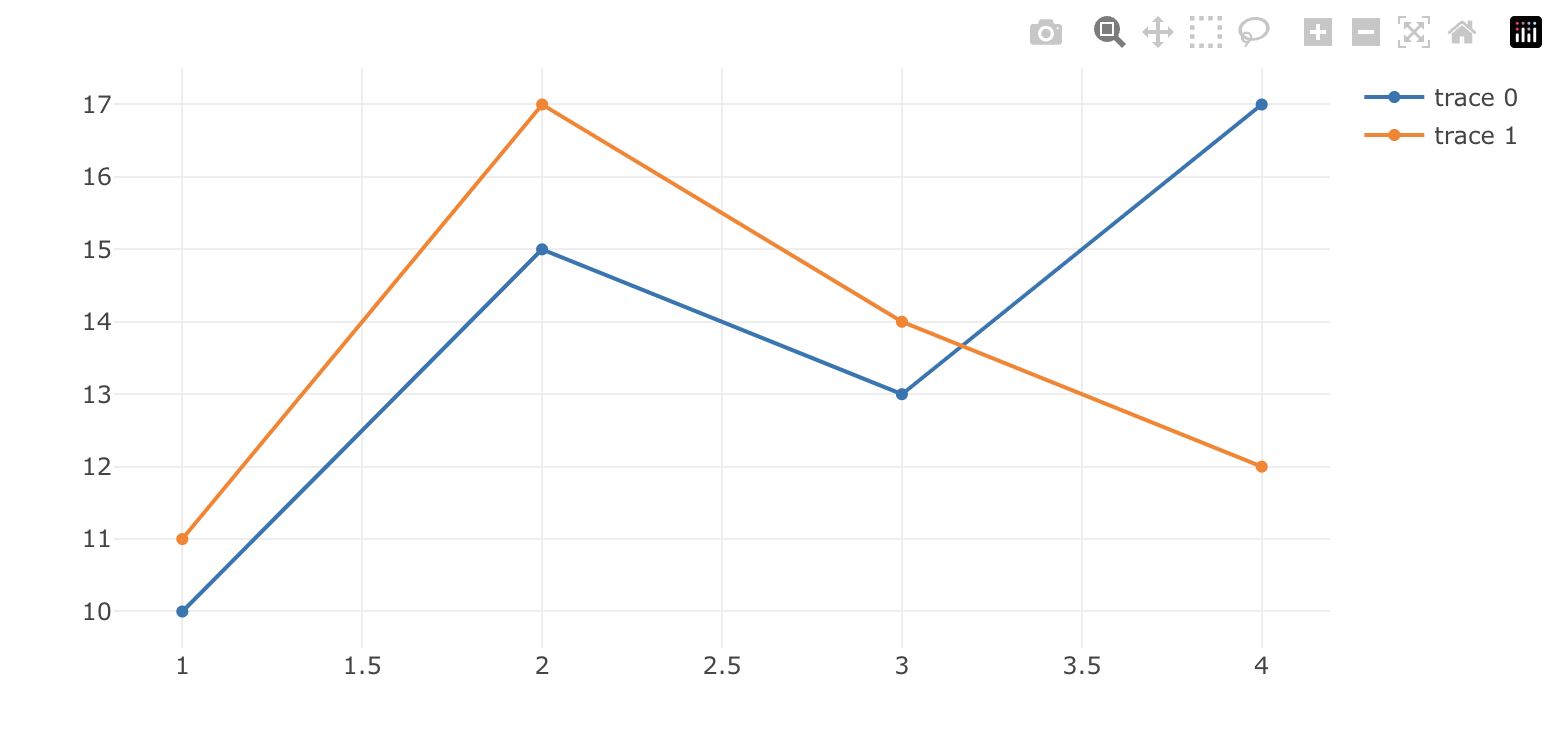
データの複数表示
import Plotly from "plotly.js-basic-dist";
import createPlotlyComponent from "react-plotly.js/factory";

const Plot = createPlotlyComponent(Plotly);

const MyPlot = (): JSX.Element => {
    const trace1 = {
        x: [1, 2, 3, 4],
        y: [10, 15, 13, 17],
        type: "lines",
    };

    const trace2 = {
        x: [4, 3, 2, 1],
        y: [12, 14, 17, 11],
        type: "lines",
    };

    // データを複数用意し、配列で渡す
    const data = [trace1, trace2] as Plotly.Data[];
    const layout = {
        width: 800,
        height: 400,
    } as Plotly.Layout;

    return (
        <Plot
            data={data}
            layout={layout}
        >
    )
};
レイアウトの調整
plotlyで用意されているプロパティでレイアウトを調整していきます。
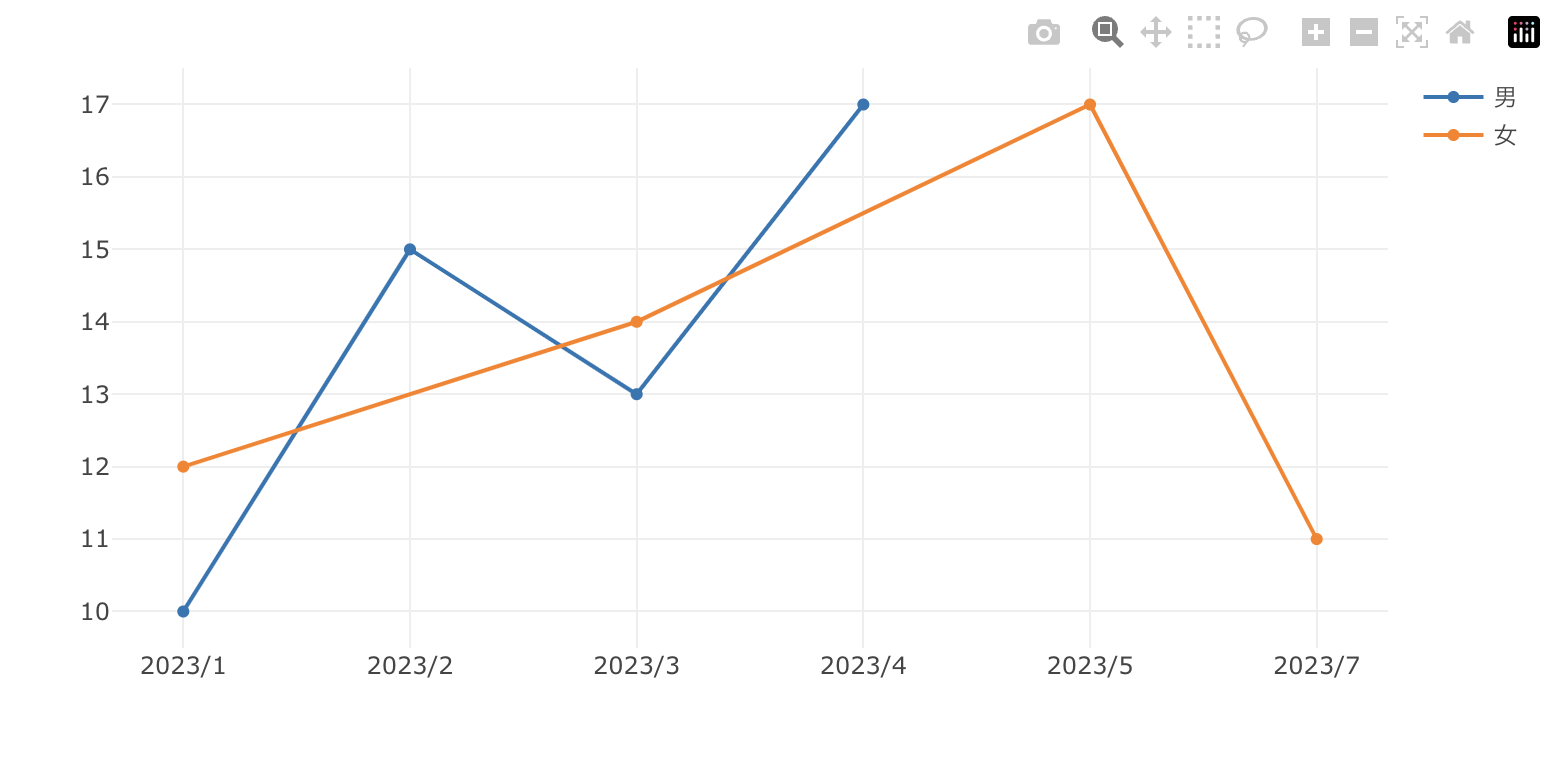
// まずはデータを整える
const mens = {
    //時系列風にするためにx軸の値に日付を指定
    x: ["2023/1", "2023/2", "2023/3", "2023/4"],
    y: [10, 15, 13, 17],
    name: "男",
    type: "lines",
};

const women = {
    x: ["2023/1", "2023/3", "2023/5", "2023/7"],
    y: [12, 14, 17, 11],
    name: "女",
    type: "lines",
};

const data = [mens, women] as Plotly.Data[];
凡例の位置を変更
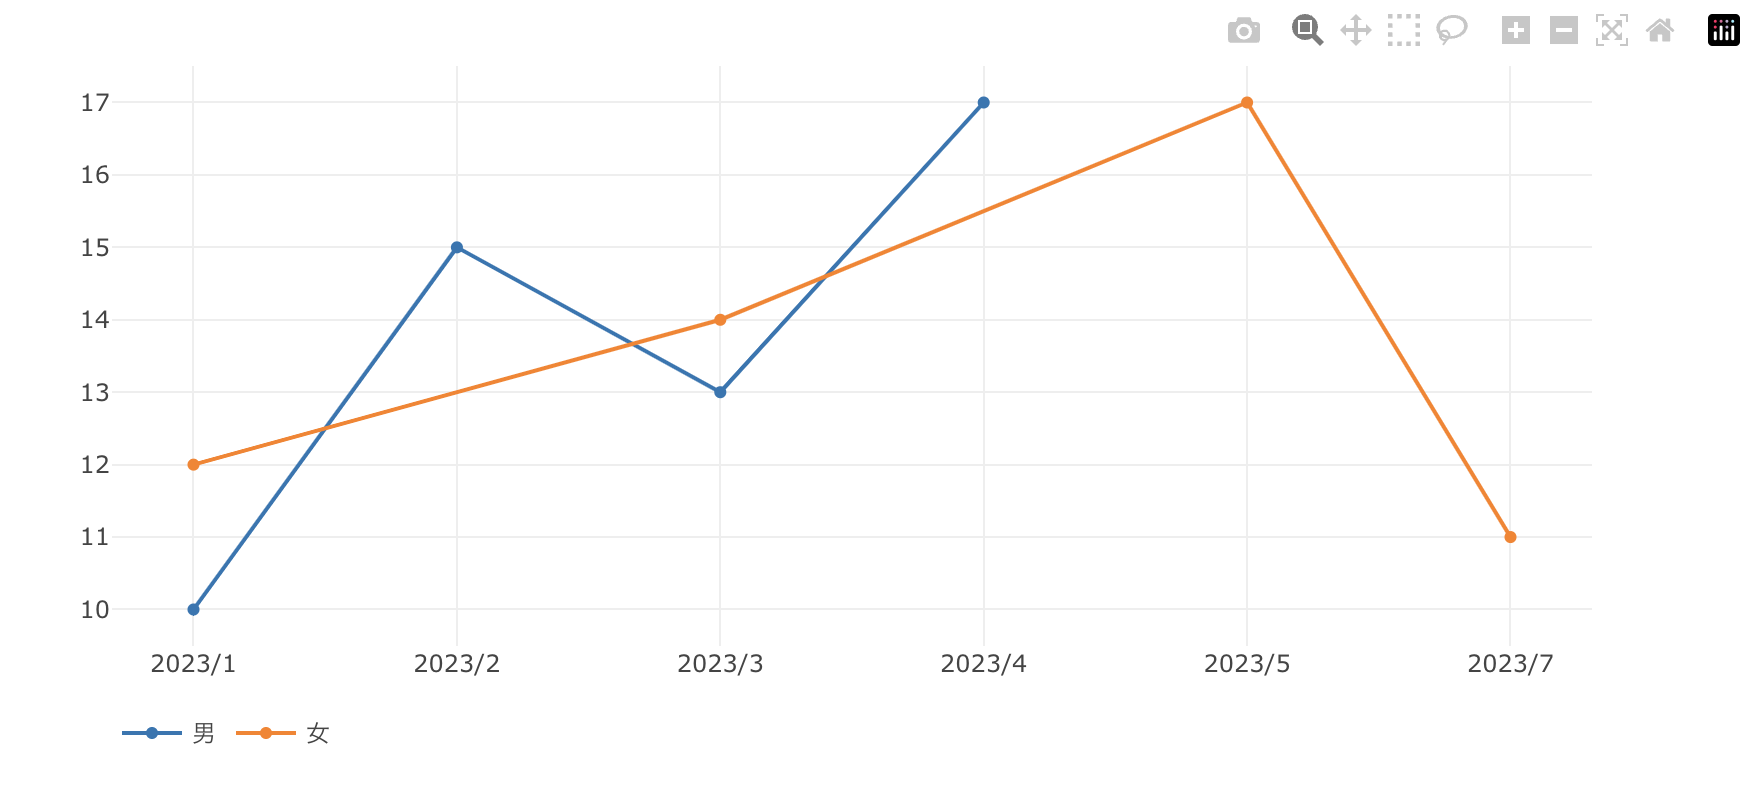
凡例を水平方向に表示したいためlegendプロパティのorientationプロパティに"h"を指定。
デフォルトで"v"が指定されています。
「vertical」の「v」と「horizontal」の「h」かな??
const layout = {
    // ...省略
    legend: {
        orientation: "h",
    },
}
マーカーのカスタマイズ(折れ線)
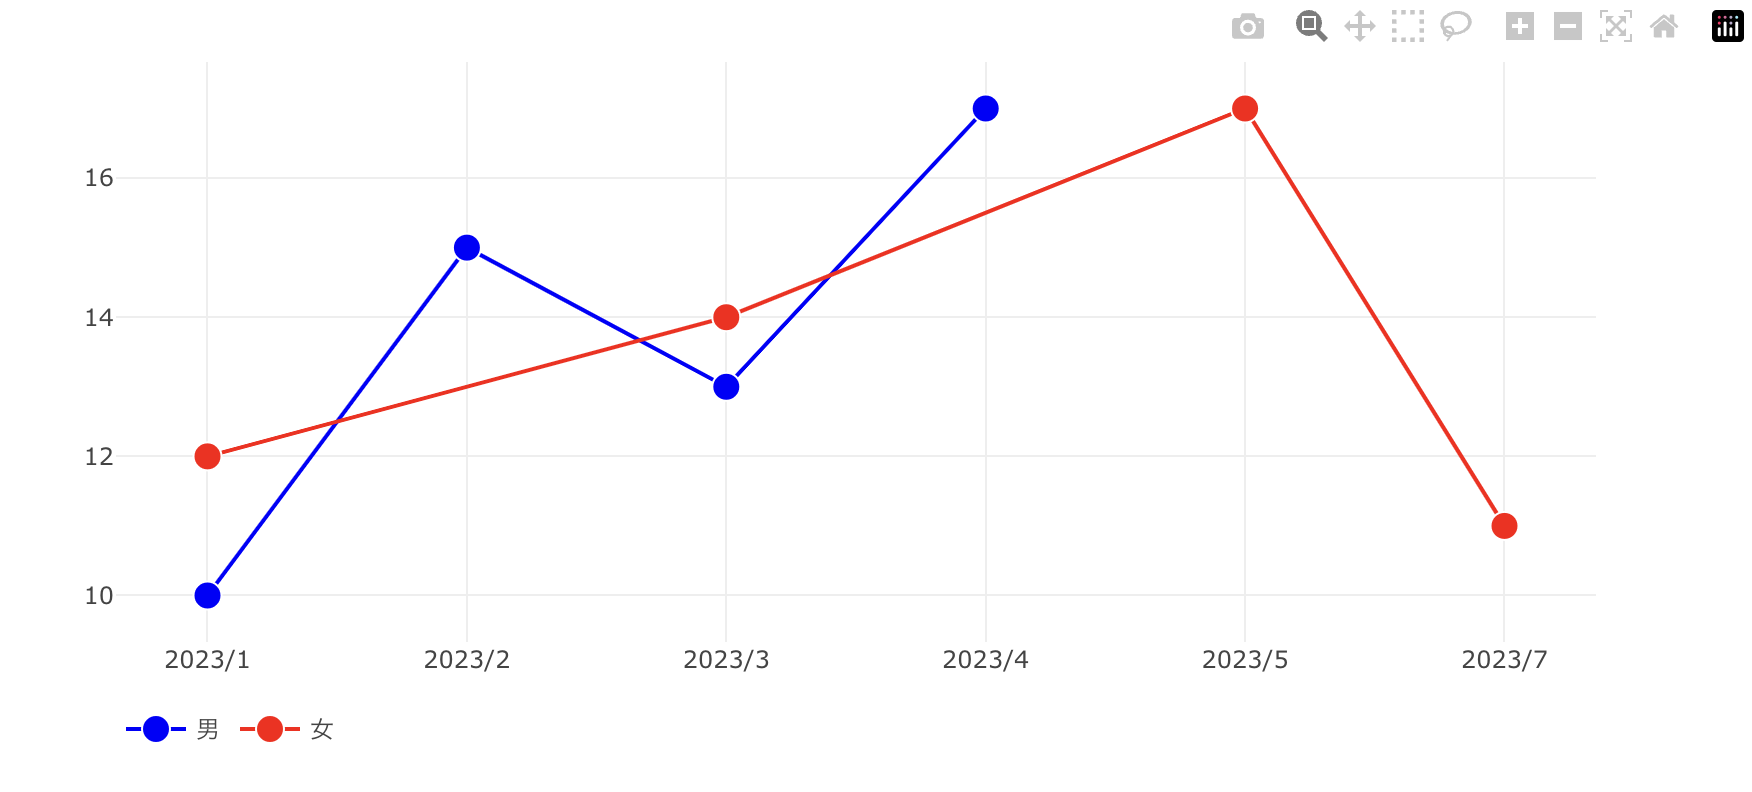
マーカーのポイントはクリックが可能なのでクリックしやすいように大きさ等を設定していきます。
const men = {
    // ...省略
    marker: {
        // 線の色
        color: "bleu",
        line: {
            // 枠線の色
            color: "#fff",
            // 線の太さ
            width: 1,
        },
        // ポイントの大きさ
        size: 14,
    },
}

const women = {
    // ...省略
    marker: {
        color: "red",
        line: {
            color: "#fff",
            width: 1,
        },
        size: 14,
    },
}
y軸の固定
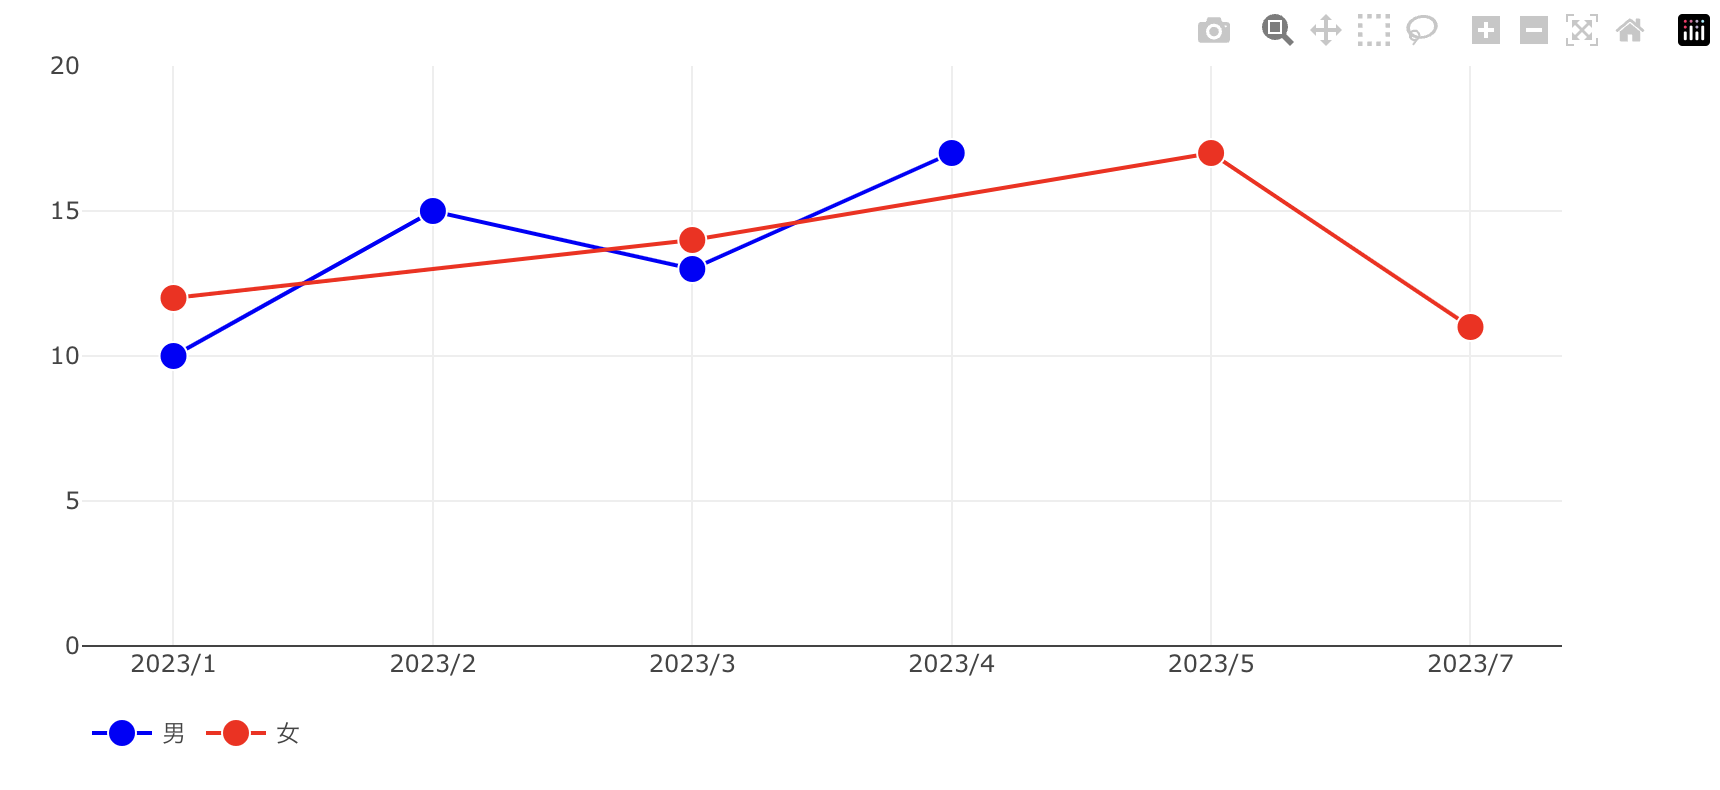
渡すデータによって初期表示のズーム比率が変わるため(今回の場合は最低値の10と最大値の17の範囲)y軸の表示を0から20の範囲で固定します。
const layout = {
    // ...省略
    yaxis: {
        range: [0, 20],
    },
}
モートバーのカスタマイズ
最後にモートバーの不要な機能を削除して・・・・
{
    // ...省略
    const config = {
        // モートバーを常に表示する
        displayModeBar: true,
        // plotlyのロゴを削除
        displaylogo: false,
        // 必要な機能のみ下記に追加する
        modeBarButtons: [
            // 配列を分けることでアイコン同士の間隔をあけることができます
            ["zoom2d", "pan2d"],
            ["zoomIn2d", "zoomOut2d", "autoScale2d", "resetViews"],
        ],
    } as Plotly.Config;

    return (
            // コンポーネントにconfigを渡す
        <Plot config={config} data={data} layout={layout} />
    );
};
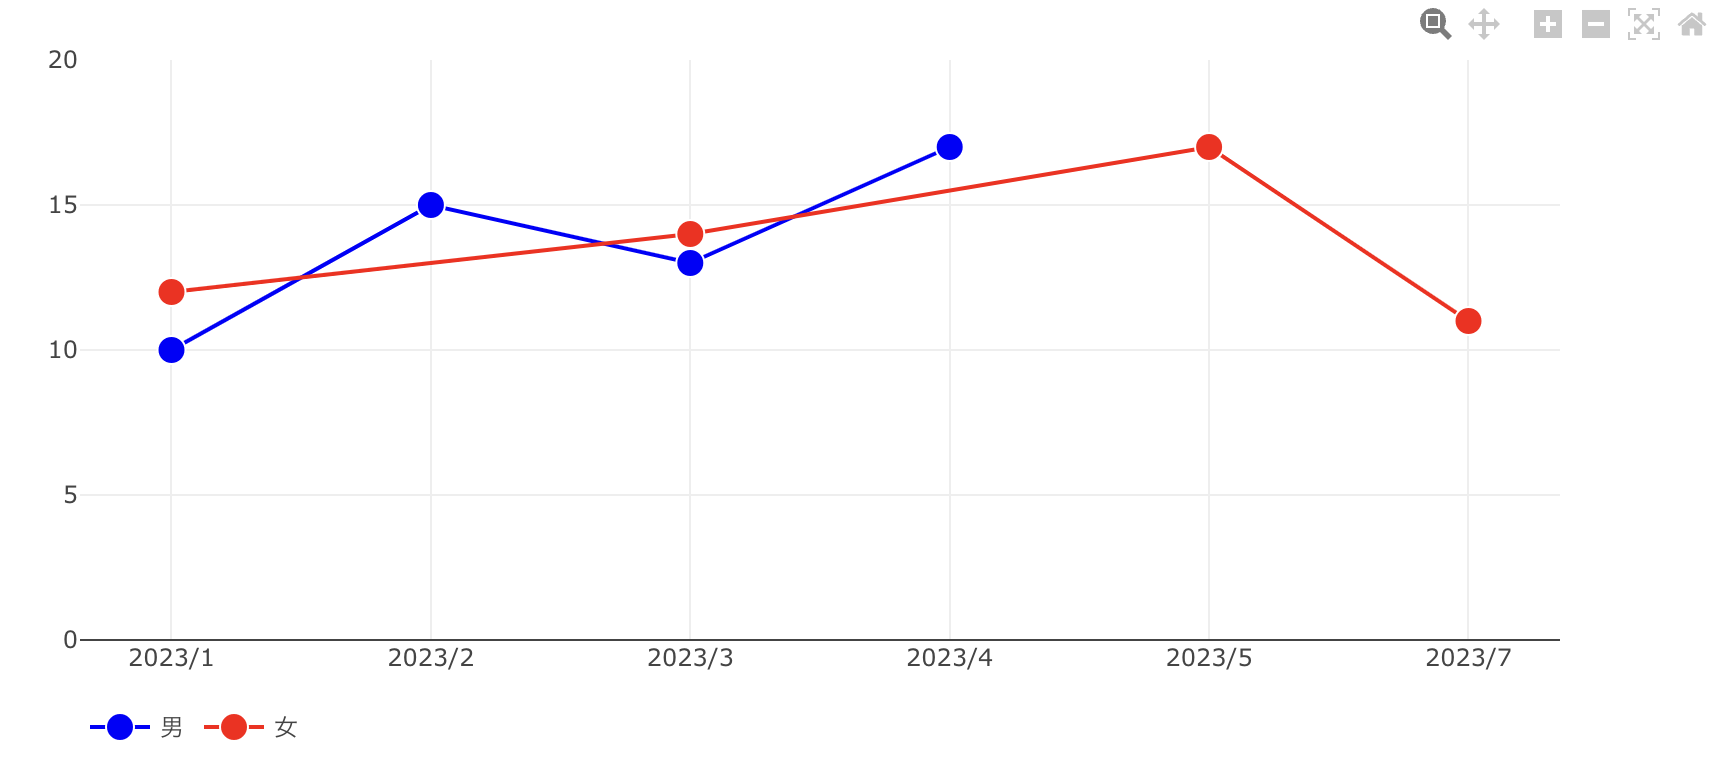
完成
シンプルで見やすいグラフができたと思います!(多分(-_-;))
最終的なコード
import Plotly from "plotly.js-basic-dist";
import createPlotlyComponent from "react-plotly.js/factory";

const Plot = createPlotlyComponent(Plotly);

const MyPlot = (): JSX.Element => {
    const mens = {
        x: ["2023/1", "2023/2", "2023/3", "2023/4"],
        y: [10, 15, 13, 17],
        name: "男",
        type: "lines",
        marker: {
            color: "blue",
            line: {
                color: "#fff",
                width: 1,
            },
            size: 14,
        },
        hovertemplate: "%{x}   %{y}",
    };

    const women = {
        x: ["2023/1", "2023/3", "2023/5", "2023/7"],
        y: [12, 14, 17, 11],
        name: "女",
        type: "lines",
        marker: {
            color: "red",
            line: {
                color: "#fff",
                width: 1,
            },
            size: 14,
        },
    };

    const data = [mens, women] as Plotly.Data[];

    const layout = {
        width: 900,
        height: 400,
        legend: {
            orientation: "h",
        },
        yaxis: {
            range: [0, 20],
        },
    } as Plotly.Layout;

    const config = {
        displayModeBar: true,
        displaylogo: false,
        modeBarButtons: [
            ["zoom2d", "pan2d"],
            ["zoomIn2d", "zoomOut2d", "autoScale2d", "resetViews"],
        ],
    } as Plotly.Config;

    return (
        <Plot config={config} data={data} layout={layout} />
    );
};
最後に
plotly.jsを使用して時系列折れ線グラフを作成してみました。
今回は時系列の折れ線グラフに焦点を当てて紹介しましたが、まだまだ紹介できてないレイアウトの設定や3Dグラフなどさまざまな種類のグラフを作成できるので、ぜひ色々カスタマイズして遊んでみてください!!
PR
HRBrainでは一緒に働く仲間を募集しています!
Advent Calendarを見ていただき、興味を持っていただいた方はぜひ弊社の採用ページをご確認ください!
