はじめに
テスト工程において品質の状況を逐一知りたいというときに「品質管理図」があれば把握できます。
品質が悪い場合、早めの対策が取れたりするのでpythonのmatplotlibを用いて描く方法を共有します。
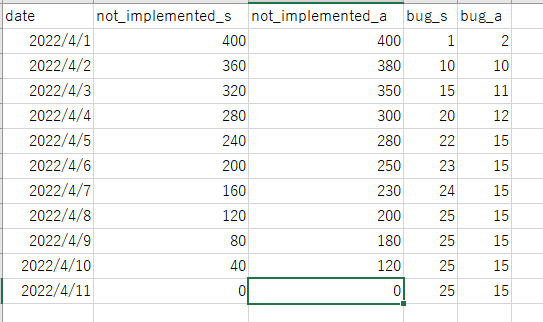
準備(管理表)
- シート名:list
- カラム名は下記
date:日付
not_implemented_s:テスト消化予想線
not_implemented_a:テスト消化線
bug_s:不良摘出予想線
bug_a:テスト消化線
sはschedule、aはactualの略としています。
バグ予想の列は「ゴンペルツ曲線」を用いて算出します。(これは別途)
下記はテストデータとなります。

グラフ作成
ライブラリインポート
import openpyxl
import pandas as pd
import matplotlib.pyplot as plt
import datetime
管理表(エクセル)読み込み
wb = openpyxl.load_workbook('D:\\work\\test\\test_result_table.xlsx', data_only=True)
sheet_count = wb['list']
pandas.DataFrame作成
def getDataframe(sheet):
    data = sheet.values
    # 最初の行をヘッダーとして取得する
    columns = next(data)[0:]
    # 以降のデータからDataFrameを作成する
    df = pd.DataFrame(data, columns=columns)

    return df

df_count = getDataframe(sheet_count)
描画
タイトルが文字化け(豆腐)になるときは下記をダウンロードする。
https://moji.or.jp/ipafont/ipaex00401/
下記は「IPAexゴシック」をダウンロードした例です。
fig = plt.figure(figsize=(20, 20))
# フォント指定
plt.rcParams['font.family'] = 'IPAexGothic'
fig, ax1 = plt.subplots()
ax2 = ax1.twinx()

ax1.plot(df_count["date"], df_count["not_implemented_s"], color="k", label="テスト消化予想線")
ax1.plot(df_count["date"], df_count["not_implemented_a"], color="r", label="テスト消化線")

ax2.plot(
    df_count["date"], df_count["bug_s"], color="k", label="不良摘出予想線", linestyle="dashed"
)
ax2.plot(
    df_count["date"], df_count["bug_a"], color="r", label="不良摘出実績線", linestyle="dashed"
)

plt.tick_params(labelsize=10)  # 目盛線ラベルのフォントサイズ

# グラフタイトルを付ける
plt.title("消化したテスト項目数と摘出したバグ数", fontsize=15)
ax1.grid(False)
ax2.grid(False)
# 凡例の表示のため、handler1と2にはグラフオブジェクトのリスト情報が入る
# label1と2には、凡例用に各labelのリスト情報が入る
handler1, label1 = ax1.get_legend_handles_labels()
handler2, label2 = ax2.get_legend_handles_labels()

# 凡例をまとめて出力する
ax1.legend(
    handler1 + handler2,
    label1 + label2,
    bbox_to_anchor=(1.25, 1),
    loc="upper left",
    borderaxespad=0.0,
)
fig.autofmt_xdate(rotation=45)
ax1.set_ylim([0, 500])
ax2.set_ylim([0, 70])
ax1.set_ylabel("残存テスト項目数")
ax2.set_ylabel("不良摘出件数")
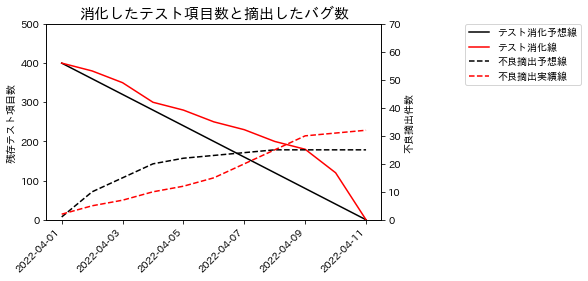
図示すると下記のような図になります。
予想線をちゃんとつければ評価できる図になります。

おわりに
管理表(エクセル)からpythonのmatplotlibを用いて品質管理図を図示するコードを共有しました。
図示することで意思決定がしやすくなると思います。
例えば下記のどのパターンになっているかなど。
https://monoist.itmedia.co.jp/mn/articles/1002/18/news101.html
参考
https://qiita.com/pbjpkas/items/e45dfed05c39518f3ad3
https://qiita.com/katuemon/items/5c4db01997ad9dc343e0