はじめに
こんにちは、開発部の一筒です!
前回のLeaflet.jsの記事に続き、今回は図形やラインの表示方法を紹介したいと思います!
前回はマーカーの表示についてご紹介しました:
まず地図を用意
前回と同様に、OpenStreetMapとLeafletの利用に必要なCSSファイル、JavaScriptファイルをダウンロードまたはCDNから取得し、マップを表示します。(前回と同じなので省略してます)
// Leafletを使用して地図を初期化 初期の中心座標とズームレベルを指定
var map = L.map('map', {
    center: [34.693017433826746, 135.53148106698168],
    zoom: 17,
});

// OpenStreetMapレイヤーを追加、クレジット表記必須
L.tileLayer('https://{s}.tile.openstreetmap.org/{z}/{x}/{y}.png', {
    attribution: '© OpenStreetMap contributors'
}).addTo(map);
指定した座標(34.693017433826746, 135.53148106698168)を中心にしたOpenStreetMapが表示されました。
ラインの表示
先ほど表示させた地図(map)に一連の位置情報を結んでライン表示させます。
詳細な経路を表示させたい時などに便利です
//2点以上の緯度・経度の座標を配列で指定します。
var latlngs = [
    [34.696125, 135.534278],
    [34.695592, 135.534493],
    [34.694064, 135.534839],
    [34.692877, 135.535137],
    [34.692268, 135.535101],
    [34.692337, 135.533764],
    [34.692317, 135.531974],
    [34.692229, 135.529766],
    [34.692602, 135.528990]
];

//マップにラインを追加
var polyline = L.polyline(latlngs, {color: 'red'}).addTo(map);
//地図のズーム調整
map.fitBounds(polyline.getBounds());
-
L.polyline(latlngs, {color: 'red'}):
L.polylineに座標の配列を渡します。 -
map.fitBounds(polyline.getBounds()):
地図表示に設定したズームレベルに関わらず、ラインが全て見えるようにズームを調整してくれます。
var polyline = L.polyline(latlngs, {
    color: 'blue',      // 線の色
    weight: 5,          // 線の太さ
    opacity: 0.7,       // 線の透明度
    dashArray: '5, 10'  // 点線(5pxの線、10pxの隙間)
}).addTo(map);
一方通行などを考慮して自動で経路を計算する便利なプラグインもあります!
Leaflet Routing Machine:
多角形図形(ポリゴン)の表示
ラインと同様に、複数の緯度経度の配列を引数に取り、それらを結んだ多角形の図形(ポリゴン)を描画します。
細かくエリアの分けが必要な時などに使えます。
//2点以上の緯度・経度の座標を配列で指定します
var latlngs = [
    [34.694028, 135.531823],
    [34.692515, 135.531909],
    [34.692361, 135.530916],
    [34.692281, 135.529715],
    [34.692480, 135.529366],
    [34.692758, 135.529162],
    [34.693000, 135.528985],
    [34.693494, 135.530053],
    [34.693856, 135.531018]
];

// 2つ目のポリゴンの座標
var latlngs2 = [
    [34.694084, 135.532005],
    [34.693547, 135.531998],
    [34.693561, 135.532639],
    [34.693602, 135.533269],
    [34.693992, 135.533235],
    [34.694455, 135.533219],
    [34.694338, 135.532764],
    [34.694147, 135.532739],
    [34.694160, 135.532681],
    [34.694311, 135.532656],
    [34.694232, 135.532335]
];

// 最初のポリゴンを描写
var polygon1 = L.polygon(latlngs, { color: 'blue' }).addTo(map);

// 2つ目のポリゴンを描写
var polygon2 = L.polygon(latlngs2, { color: 'red' }).addTo(map);

// 地図の表示範囲をポリゴンに合わせる
map.fitBounds(polygon1.getBounds().extend(polygon2.getBounds()));
-
L.polygon(latlngs, {color: 'red'}):
L.polygonに座標の配列を渡します。
L.polylineをL.polygonに変えただけでラインの表示方法とほぼ同じです。
デフォルトで透明度が入っていますがこちらもデザイン設定が可能です。
![uploading...0]()
var polygon = L.polygon(latlngs, {
    fill: false,         //塗りつぶしをするか?
    color: 'blue',      // 線の色
    weight: 5,          // 線の太さ

    // stroke: false,    //線を入れるか?
    //fillColor: 'blue',  //塗りつぶしの色
}).addTo(map);
ラインと同様に点線や透過度も指定できます。
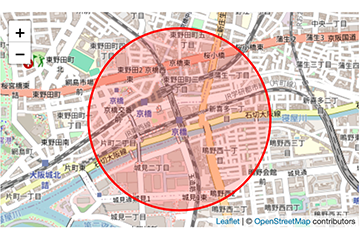
円の表示
先ほどのラインやポリゴンとは変わって、一点の地点から半径を指定して円を表示させます。
ざっくりしたエリアの描画などに使えます。
//円の中心座標と半径(メートル単位)を設定
var circle = L.circle([34.696125, 135.534278], {
    color: 'red',       // 線の色
    radius: 500          // 半径(500メートル)
}).addTo(map);

map.fitBounds(circle.getBounds());
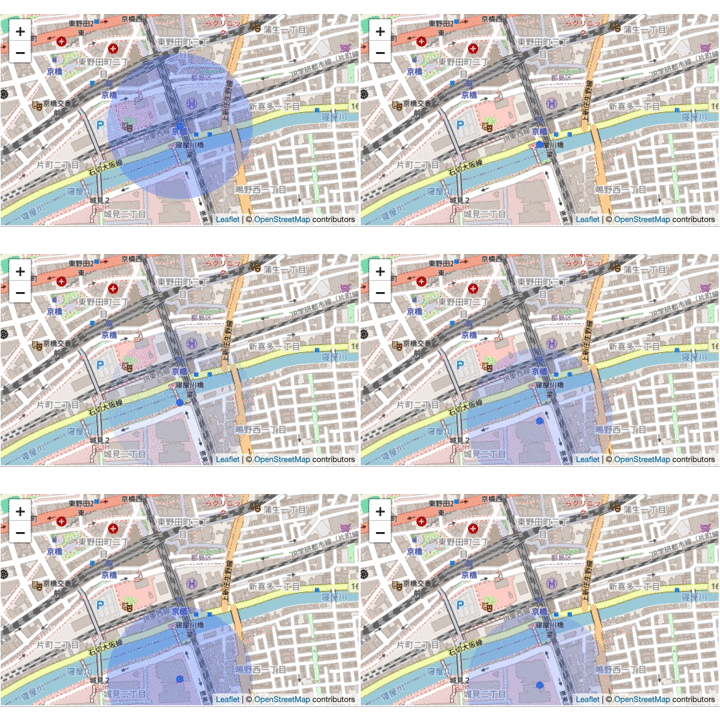
応用すると現在地が移動しているようなアニメーションも作成できます

さいごに
簡単ですがLeafletjsを使った地図上のエリア描写についてご紹介させていただきました。
少しでもご参考になれば幸いです![]()
はつかぜ株式会社では、IT学習や業務に役立つ情報を定期的にお届けしていきたいと思っています。
システム開発のお問い合わせ・ご相談はこちら


