環境
OS:Ubuntu 18.10
gnuplot: 5.2 patchlevel 2(Qt)
ファイルからデータを読み込んでアニメーションで表示
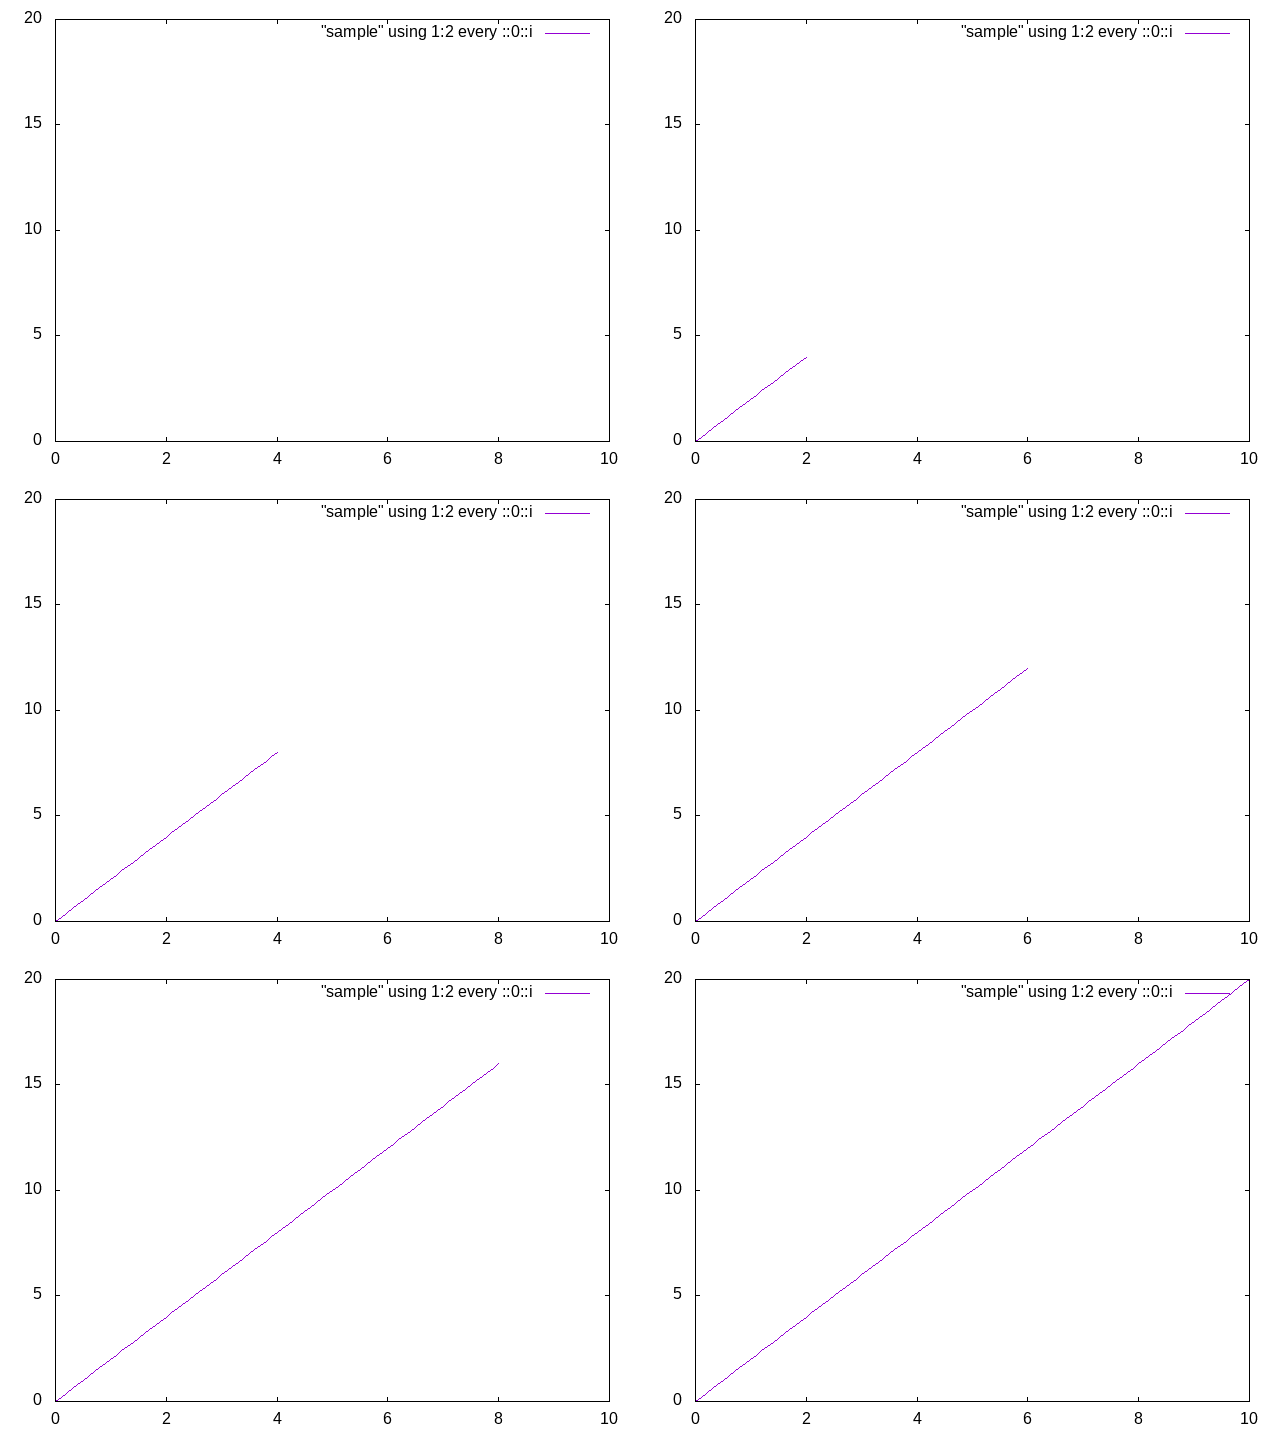
$y = 2x$をアニメーションで表示
gnuplot
gnuplot> do for[i=0:100]{
more> plot [0:10] [0:20] "sample" using 1:2 every ::0::i with lines
more> pause 0.05
more> }
sample
0.000000 0.000000
0.100000 0.200000
0.200000 0.400000
略
9.800000 19.600000
9.900000 19.800000
10.000000 20.000000
sampleの中に表示したい線の座標データがあれば簡単にアニメーション表示できる。
わざわざ座標データのファイルを読み込むのは面倒
媒介変数を使った方法
gnuplotには媒介変数モードがあるのでそれを使います(他の方法があればコメントお願いします)
gnuplot
gnuplot> set param

	dummy variable is t for curves, u/v for surfaces
gnuplot> set xrange[0:10]
gnuplot> set yrange[0:20]
gnuplot> do for[i=0:100]{
more> set trange[0:i*0.1]
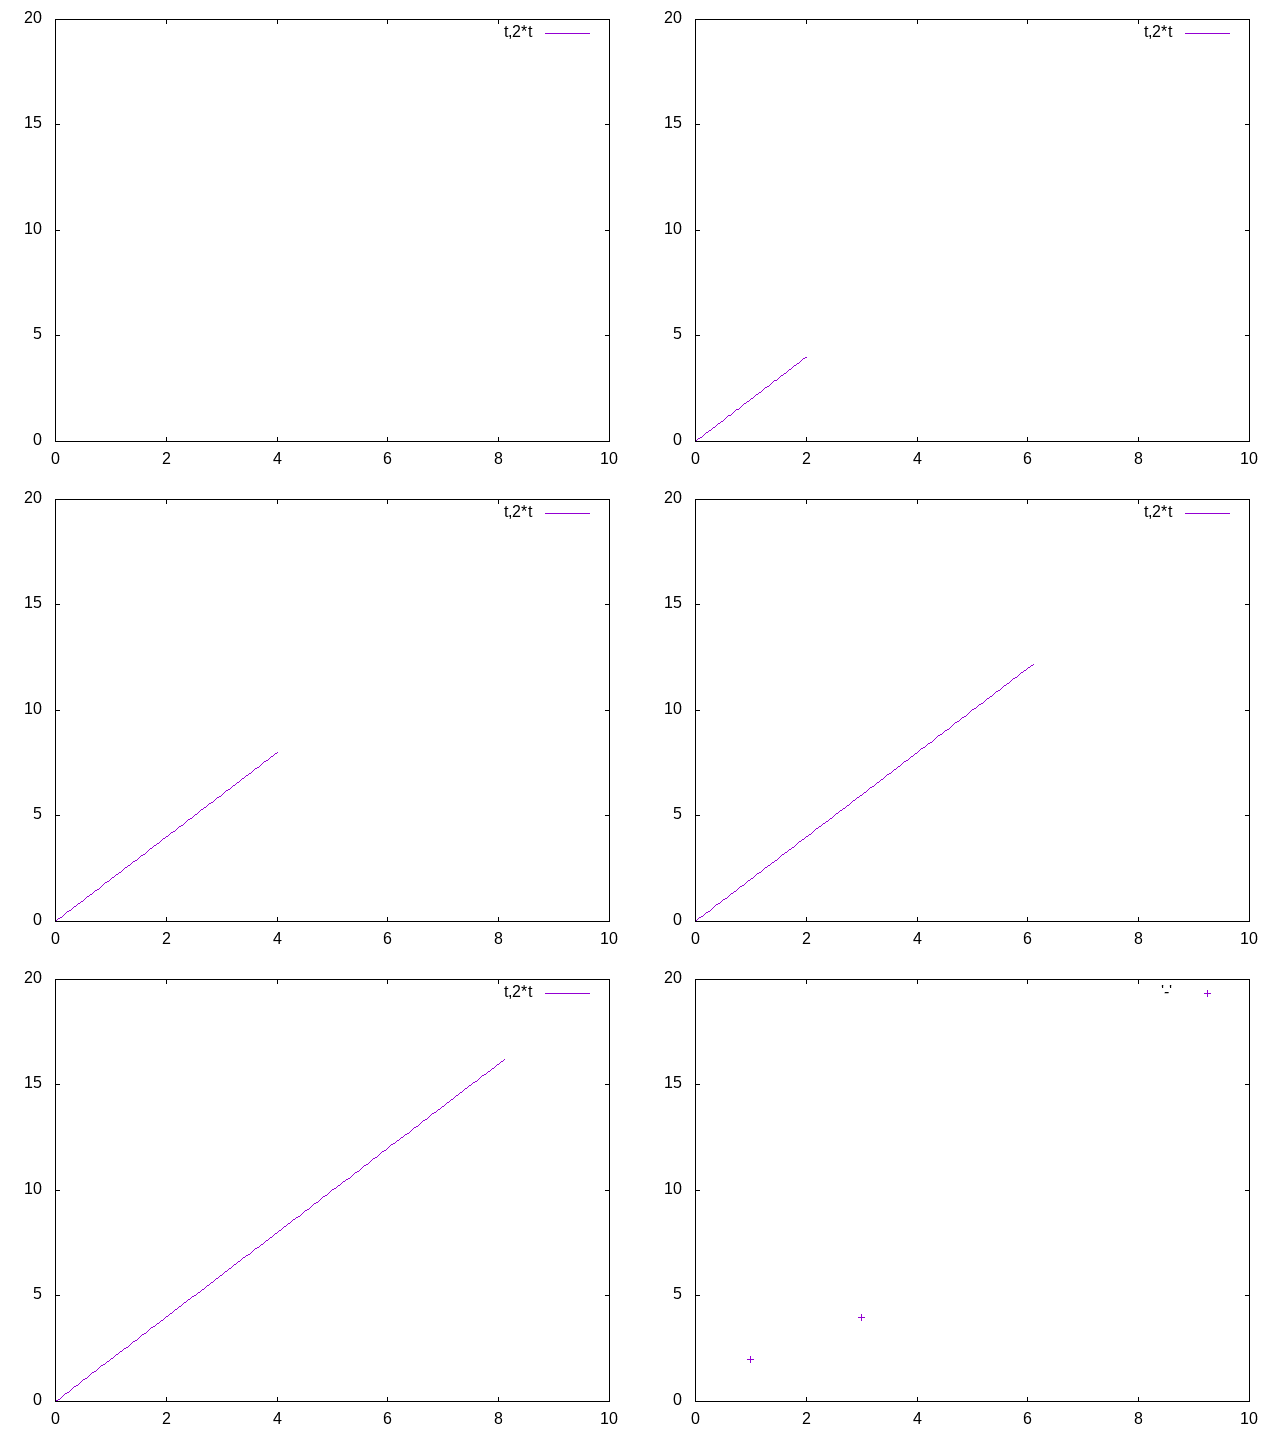
more> plot t,2*t with lines
more> pause 0.05
more> }
set trangeで媒介変数の描画範囲を決めてdo forでループしている。
さっきのやつと見た目は変わらないけど座標データがいらないから便利
C言語サンプル
main.c
# define _GNU_SOURCE
# include<stdio.h>
# include<stdlib.h>

int main(){

    FILE *pipe = popen("gnuplot -persist\n", "w");

    if(pipe == NULL){
        fprintf(stderr, "popen error\n");
        exit(1);
    }

    fprintf(pipe, "set xrange [0:10]\n"
                  "set yrange [0:20]\n"
                  "set param\n"
                  "do for[i=0:100]{\n"
                  "set trange [0:i*0.1]\n"
                  "plot t,2*t with lines\n"
                  "pause 0.05\n"
                  "}\n");

    pclose(pipe);

    return 0;
}

