はじめに
私がロボットに関して興味を持っており,ロボットの経路を作成したいと思ったところ,RRT (Rapidly-exploring Random Tree) と呼ばれる経路生成の手法に辿り着いた.
本記事では,経路生成の古典的手法である RRT (Rapidly-exploring Random Tree) をPythonより,実装してみる.
前記事では,円形の干渉物が存在する2次元空間を探索するRRTを実装した.
前記事の内容を下記に記します.
・https://qiita.com/haruhiro1020/items/b11e63ffcd71311d3390
・https://qiita.com/haruhiro1020/items/6eaae645bd638c2b8897
本記事では,干渉物が存在しない3次元空間を探索するRRTを実装する.
また,3次元データをアニメーション化する際には,下記を参考とした.
・https://qiita.com/AnchorBlues/items/3acd37331b12e844d259
本記事で実装すること
・干渉物が存在しない3次元空間でのRRTによる経路生成
・経路生成のアニメーションを作成
本記事では実装できないこと(将来実装したい内容)
・球の干渉物が存在する経路生成
動作環境
・macOS Sequoia (バージョン15.5)
・Python3 (3.10.9)
・Numpy (1.23.5) (数値計算用ライブラリ)
・Matplotlib (3.7.0) (アニメーション作成用ライブラリ)
経路生成手法のまとめ
経路生成手法をまとめた記事を展開いたします.RRT以外の手法も記載してますので,参照いただけますと幸いです.
(https://qiita.com/haruhiro1020/items/000b3287fce082ae4283)
RRTに関して
経路生成手法である,前記事でRRTに関しての説明をしたため,本記事では割愛する.
2次元空間から3次元空間へ拡張する.
始点から終点までの経路生成(干渉物が存在しない3次元空間)
PythonによるRRTの実装は下記の通りです.
前記事と大方同じである.新規追加/変更箇所は 「# 新規追加」/「# 変更」と記載した.
# 経路生成手法であるRRT (Rapidly-exploring Random Tree) の実装

# ライブラリの読み込み
import numpy as np
import time


class RRT:
    """
    RRTクラス

    プロパティ
        _pathes(numpy.ndarray): 始点から終点までの経路
        _debug_pathes(numpy.ndarray): デバッグ用経路
        _debug_random_pathes(numpy.ndarray): デバッグ用ランダム位置
        _strict_min_pos(numpy.ndarray): 探索の最小範囲
        _strict_max_pos(numpy.ndarray): 探索の最大範囲

    publicメソッド (全てのクラスから参照可能)
        planning(): 経路生成の実装
        pathes(): _pathesプロパティのゲッター
        debug_pathes(): _debug_pathesプロパティのゲッター
        debug_random_pathes(): _debug_random_pathesプロパティのゲッター
        strict_min_pos(): _strict_min_posプロパティのゲッター
        strict_max_pos(): _strict_max_posプロパティのゲッター

    protectedメソッド (自クラスまたは子クラスが参照可能)
        _reset(): データの初期化
        _set_node(): データにノードを設定する
        _chk_end_pos_dist(): 終点との距離が一定範囲内であるかの確認
        _fin_planning(): 経路生成の終了処理
        _calc_new_pos(): 最短ノードからランダムな値方向へ新しいノード(位置)を作成
        _get_near_node(): ランダムな位置と最短距離であるノードを取得
        _strict_planning_pos(): 探索範囲を制限する
        _get_random_pos(): ランダムな位置を取得
    """
    # 定数の定義
    _INITIAL_NODE_NEAR = -1     # 初期値の最短距離ノード番号
    _MOVING_VALUE = 0.25        # 1回の移動量
    _STRICT_PLANNING_POS = 0.2  # 探索範囲の制限
    _TIMEOUT_VALUE = 10         # タイムアウト時間 [second]
    _FILE_NAME_PATHES = "pathes.csv"                # _pathesプロパティを保存するファイル名
    _FILE_NAME_DEBUG_PATHES = "debug_pathes.csv"    # _debug_pathesプロパティを保存するファイル名
    _FILE_NAME_DEBUG_RANDOM_PATHES = "debug_random_pathes.csv"  # _debug_random_pathesプロパティを保存するファイル名

    def __init__(self):
        """
        コンストラクタ
        """
        self._debug_pathes = []
        self._debug_random_pathes = []
        self._pathes = []

    @property
    def pathes(self):
        """
        _pathesプロパティのゲッター
        """
        return self._pathes

    @property
    def debug_pathes(self):
        """
        _debug_pathesプロパティのゲッター
        """
        return self._debug_pathes

    @property
    def debug_random_pathes(self):
        """
        _debug_random_pathesプロパティのゲッター
        """
        return self._debug_random_pathes

    @property
    def strict_min_pos(self):
        """
        _strict_min_posプロパティのゲッター
        """
        return self._strict_min_pos

    @property
    def strict_max_pos(self):
        """
        _strict_max_posプロパティのゲッター
        """
        return self._strict_max_pos

    def _set_node(self, node):
        """
        データにノードを設定する

        パラメータ
            node(numpy.ndarray): ノード位置と最短距離ノード番号 (最終要素)
        """
        if len(self._debug_pathes) == 0:
            self._debug_pathes = node
        else:
            self._debug_pathes = np.append(self._debug_pathes, node, axis=0)

    def _set_random_node(self, node):
        """
        データにノードを設定する

        パラメータ
            node(numpy.ndarray): ノード位置と最短距離ノード番号 (最終要素)
        """
        if len(self._debug_random_pathes) == 0:
            self._debug_random_pathes = node
        else:
            self._debug_random_pathes = np.append(self._debug_random_pathes, node, axis=0)

    def planning(self, start_pos, end_pos):
        """
        経路生成

        パラメータ
            start_pos(numpy.ndarray): 経路生成の始点
            end_pos(numpy.ndarray): 経路生成の終点

        戻り値
            result(bool): True / False = 成功 / 失敗
        """
        # 処理結果
        result = False

        # 始点と終点の次元数が一致しているかの確認
        if np.size(start_pos) != np.size(end_pos):
            # 次元数が異なるので異常
            return result

        # 始点ノードを設定
        self._set_node(np.append(start_pos, self._INITIAL_NODE_NEAR).reshape(1, -1))
        self._set_random_node(np.append(start_pos, self._INITIAL_NODE_NEAR).reshape(1, -1))
        # 探索する範囲を設定
        self._strict_planning_pos(start_pos, end_pos)

        # 経路生成は一定時間内に終了させる
        start_time = time.time()

        # 終点までの経路生成が終わるまでループ
        while True:
            # ランダムな値を取得
            random_pos = self._get_random_pos()
            # ランダムな値と最短ノードを計算
            near_node = self._get_near_node(random_pos)
            # 最短ノードからランダムな値方向へ新しいノード(位置)を作成
            new_pos = self._calc_new_pos(random_pos, near_node)
            # ランダムノードを設定
            self._set_random_node(np.append(random_pos, near_node).reshape(1, -1))
            # ノードを設定
            self._set_node(np.append(new_pos, near_node).reshape(1, -1))
            # 終点との距離が一定範囲内であるかの確認
            if self._chk_end_pos_dist(new_pos, end_pos):
                # 一定範囲内のため,経路生成の完了
                result = True
                break

            now_time = time.time()
            if now_time - start_time >= self._TIMEOUT_VALUE:
                # タイムアウト
                break

        if result:
            # 経路生成に成功のため,経路生成の終了処理
            self._fin_planning(start_pos, end_pos)

        return result

    def _chk_end_pos_dist(self, pos, end_pos):
        """
        終点との距離が一定範囲内であるかの確認

        パラメータ
            pos(numpy.ndarray): ノード位置
            end_pos(numpy.ndarray): 経路生成の終点

        戻り値
            is_near(bool): True / False = 一定範囲内である / でない
        """
        is_near = False
        # 距離を計算
        dist = np.linalg.norm(end_pos - pos)
        # 一定範囲内であるかの確認
        if dist <= self._MOVING_VALUE:
            is_near = True

        return is_near

    def _fin_planning(self, start_pos, end_pos):
        """
        経路生成の終了処理

        パラメータ
            start_pos(list): 経路生成の始点
            end_pos(list): 経路生成の終点
        """
        # 始点から終点までの経路に関係するノードを選択
        revers_path = end_pos
        near_node = -1
        while True:
            # 終点から始点方向へノードを取得
            node = self._debug_pathes[near_node, :]
            pos = node[:-1].reshape(1, -1)
            # 浮動小数型になっているので,整数型に型変換
            near_node = int(node[-1])
            revers_path = np.append(revers_path, pos, axis=0)
            if near_node == self._INITIAL_NODE_NEAR:
                # 始点ノードまで取得できたため,処理終了
                break

        # 経路が終点からの順番になっているため,始点から終点とする
        self._pathes = revers_path[::-1]
        # デバッグ用の経路に終点を追加
        self._set_random_node(np.append(end_pos, self._debug_pathes.shape[0] - 1).reshape(1, -1))
        self._set_node(np.append(end_pos, self._debug_pathes.shape[0] - 1).reshape(1, -1))

    def _calc_new_pos(self, random_pos, near_node):
        """
        最短ノードからランダムな値方向へ新しいノード(位置)を作成

        パラメータ
            random_pos(numpy.ndarray): ランダムな位置
            near_node(numpy.ndarray): 最短ノード

        戻り値
            new_pos(numpy.ndarray): 新しいノード
        """
        # 方向を計算
        near_pos = self._debug_pathes[near_node, :-1]
        direction = random_pos - near_pos
        # 方向の大きさを1にする
        norm_direction = direction / np.linalg.norm(direction)
        # 新しいノードを作成
        new_pos = near_pos + norm_direction * self._MOVING_VALUE

        return new_pos

    def _get_near_node(self, random_pos):
        """
        ランダムな位置との最短距離ノードを取得

        パラメータ
            random_pos(numpy.ndarray): ランダムな位置

        戻り値
            min_dist_node(int): 最短距離ノード
        """
        # 最後以外に位置が保存されている
        node_pos = self._debug_pathes[:, :-1]
        # 差分を計算
        difference = node_pos - random_pos
        # 差分から距離を計算
        distance = np.linalg.norm(difference, axis=1)
        # 最小距離のノードを取得
        min_dist_node = np.argmin(distance)

        return min_dist_node

    def _strict_planning_pos(self, start_pos, end_pos):
        """
        探索範囲を制限する

        パラメータ
            start_pos(numpy.ndarray): 始点
            end_pos(numpy.ndarray): 終点
        """
        all_pos = np.append(start_pos, end_pos, axis=0)
        # 各列の最大/最小値を取得
        min_pos = np.min(all_pos, axis=0)
        max_pos = np.max(all_pos, axis=0)
        self._strict_min_pos = min_pos - self._STRICT_PLANNING_POS
        self._strict_max_pos = max_pos + self._STRICT_PLANNING_POS

    def _get_random_pos(self):
        """
        ランダムな位置を取得

        戻り値
            random_pos(numpy.ndarray): ランダムな位置
        """
        random_pos = np.random.uniform(self._strict_min_pos, self._strict_max_pos)

        return random_pos

    def save(self):
        """
        生成した経路をファイル保存
        """
        np.savetxt(self._FILE_NAME_PATHES, self._pathes)
        np.savetxt(self._FILE_NAME_DEBUG_PATHES, self._debug_pathes)
        np.savetxt(self._FILE_NAME_DEBUG_RANDOM_PATHES, self._debug_random_pathes)
経路生成のアニメーション
上記でRRTの実装をしたが,想定通りに動いているかの確認が必要なため,アニメーションを作成して確認する.
PythonによるRRTのアニメーション実装は下記の通りです.
# RRTで作成した経路のアニメーションを作成する

# ライブラリの読み込み
import numpy as np
import matplotlib.pyplot as plt
import matplotlib.animation as ani


class RRTAnimation:
    """
    RRTのアニメーション作成

    プロパティ
        _min_pos(numpy.ndarray): RRTの最小探索範囲
        _max_pos(numpy.ndarray): RRTの最大探索範囲
        _figure: 描画枠
        _axis: 描画内容

    publicメソッド (全てのクラスから参照可能)
        plot_2DAnimation(): 2D(2次元)アニメーション作成
        plot_3DAnimation(): 3D(3次元)アニメーション作成

    protectedメソッド (自クラスまたは子クラスが参照可能)
        _reset2D(): 2次元データのリセット
        _reset3D(): 3次元データのリセット
        _update_3Ddata(): 3次元各データの更新
    """
    # 定数の定義
    _ONE_CUT_NUM = 6        # 1回
    _ANIMATION_NAME = "rrt_animation.gif"

    def __init__(self, min_pos, max_pos):
        """
        コンストラクタ
        """
        self._min_pos = min_pos
        self._max_pos = max_pos

    def _reset2D(self):
        """
        2次元データのリセット
        """
        self._figure = plt.Figure()
        self._axis = self._figure.add_subplot(111)

        # X/Y軸に文字を記載
        self._axis.set_xlabel("X")
        self._axis.set_ylabel("Y")
        # プロットするX/Yの範囲を設定
        self._axis.set_xlim(self._min_pos[0], self._max_pos[0])
        self._axis.set_ylim(self._min_pos[1], self._max_pos[1])
        self._axis.grid()

    def plot_2DAnimation(self, pathes, debug_pathes, debug_random_pathes):
        """
        2D(2次元)アニメーション作成

        パラメータ
            pathes(numpy.ndarray): 経路
            debug_pathes(numpy.ndarray): デバッグ用経路
            debug_random_pathes(numpy.ndarray): デバッグ用ランダム経路

        戻り値
            plot_result(bbol): True / False = 成功 / 失敗
        """
        plot_result = False

        # データをリセットする
        self._reset2D()

        # 引数の確認
        if pathes.size == 0 or debug_pathes.size == 0 or debug_random_pathes.size == 0:
            return plot_result

        # デバッグ用経路とデバッグ用ランダム経路の行数が一致していることを確認
        if debug_pathes.shape[0] != debug_random_pathes.shape[0]:
            # 異常なデータ
            return plot_result

        # ノード位置を取得
        debug_pathes_pos = debug_pathes[:, :-1]
        debug_pathes_near_node = debug_pathes[:, -1]
        imgs = []

        # アニメーション
        for i in range(debug_pathes.shape[0]):
            for j in range(self._ONE_CUT_NUM * 2):
                # デバッグ用経路の点数分ループ
                path_images = []
                # ランダムな経路をプロット
                image = self._axis.plot(debug_random_pathes[i, 0], debug_random_pathes[i, 1], color="red", marker="*")
                path_images.extend(image)
                # ノードをプロット
                image = self._axis.scatter(debug_pathes_pos[:i, 0], debug_pathes_pos[:i, 1], color="black", marker="*")
                path_images.extend([image])
                # 始点をプロット
                image = self._axis.scatter(debug_pathes_pos[ 0, 0], debug_pathes_pos[ 0, 1], color="cyan", marker="*", s=24)
                path_images.extend([image])
                # 終点をプロット
                image = self._axis.scatter(debug_pathes_pos[-1, 0], debug_pathes_pos[-1, 1], color="lime", marker="*", s=24)
                path_images.extend([image])
                # 現ノードをプロット
                image = self._axis.scatter(debug_pathes_pos[ i, 0], debug_pathes_pos[ i, 1], color="blue", s=24)
                path_images.extend([image])
                # 最短ノードもプロット
                if i != 0:
                    # 始点には最短ノードが存在しないから,始点以外でプロットする
                    near_node = int(debug_pathes_near_node[i])
                    plot_pos = np.append(debug_pathes_pos[i].reshape(1, -1), debug_pathes_pos[near_node].reshape(1, -1), axis=0)
                    image = self._axis.plot(plot_pos[:, 0], plot_pos[:, 1], color="red")
                    path_images.extend(image)
                    image = self._axis.scatter(plot_pos[1, 0], plot_pos[1, 1], color="green", marker="*", s=24)
                    path_images.extend([image])
                imgs.append(path_images)

        # 最終的なパスをプロット
        for _ in range(self._ONE_CUT_NUM * 4):
            path_images = []
            image = self._axis.plot(pathes[:, 0], pathes[:, 1], color="green")
            path_images.extend(image)
            image = self._axis.scatter(debug_pathes[:, 0], debug_pathes[:, 1], color="gray")
            path_images.extend([image])
            imgs.append(path_images)

        # アニメーション
        animation = ani.ArtistAnimation(self._figure, imgs)
        animation.save(self._ANIMATION_NAME, writer='imagemagick')
        plt.show()

        plot_result = True

        return plot_result

    # 新規追加 ↓
    def _reset3D(self):
        """
        3次元データのリセット
        """
        self._figure = plt.figure()
        self._axis = self._figure.add_subplot(111, projection="3d")

    def _set_3DAxis(self):
        """
        3次元データのラベルや範囲を設定
        """
        # X/Y/Z軸に文字を記載
        self._axis.set_xlabel("X")
        self._axis.set_ylabel("Y")
        self._axis.set_zlabel("Z")
        # プロットするX/Y/Zの範囲を設定
        self._axis.set_xlim(self._min_pos[0], self._max_pos[0])
        self._axis.set_ylim(self._min_pos[1], self._max_pos[1])
        self._axis.set_zlim(self._min_pos[2], self._max_pos[2])
        self._axis.grid()

    def _update_3Ddata(self, i, pathes, debug_pathes, debug_random_pathes):
        """
        3D(3次元)各データの更新

        パラメータ
            i(int): フレーム番号
            pathes(numpy.ndarray): 経路
            debug_pathes(numpy.ndarray): デバッグ用経路
            debug_random_pathes(numpy.ndarray): デバッグ用ランダム経路
        """
        # 以前のプロットをクリアする
        self._axis.clear()
        self._set_3DAxis()

        # ノード位置を取得
        debug_pathes_pos = debug_pathes[:, :-1]
        debug_pathes_near_node = debug_pathes[:, -1]

        if i < debug_pathes.shape[0]:
            # 各ノードをプロットする
            # ランダムな経路をプロット
            self._axis.plot(debug_random_pathes[i, 0], debug_random_pathes[i, 1], debug_random_pathes[i, 2], color="red", marker="*")
            # ノードをプロット
            self._axis.scatter(debug_pathes_pos[:i, 0], debug_pathes_pos[:i, 1], debug_pathes_pos[:i, 2], color="black", marker="*")
            # 始点をプロット
            self._axis.scatter(debug_pathes_pos[ 0, 0], debug_pathes_pos[ 0, 1], debug_pathes_pos[ 0, 2], color="cyan", marker="*", s=24)
            # 終点をプロット
            self._axis.scatter(debug_pathes_pos[-1, 0], debug_pathes_pos[-1, 1], debug_pathes_pos[-1, 2], color="lime", marker="*", s=24)
            # 現ノードをプロット
            self._axis.scatter(debug_pathes_pos[ i, 0], debug_pathes_pos[ i, 1], debug_pathes_pos[ i, 2], color="blue", s=24)
            # 最短ノードもプロット
            if i != 0:
                # 始点には最短ノードが存在しないから,始点以外でプロットする
                near_node = int(debug_pathes_near_node[i])
                plot_pos = np.append(debug_pathes_pos[i].reshape(1, -1), debug_pathes_pos[near_node].reshape(1, -1), axis=0)
                self._axis.plot(plot_pos[:, 0], plot_pos[:, 1], plot_pos[:, 2], color="red")
                self._axis.scatter(plot_pos[1, 0], plot_pos[1, 1], plot_pos[1, 2], color="green", marker="*", s=24)
        else:
            # 生成した経路をプロットする
            self._axis.plot(pathes[:, 0], pathes[:, 1], pathes[:, 2], color="green")
            self._axis.scatter(debug_pathes[:, 0], debug_pathes[:, 1], debug_pathes[:, 2], color="gray")

    def plot_3DAnimation(self, pathes, debug_pathes, debug_random_pathes):
        """
        3D(3次元)アニメーション作成

        パラメータ
            pathes(numpy.ndarray): 経路
            debug_pathes(numpy.ndarray): デバッグ用経路
            debug_random_pathes(numpy.ndarray): デバッグ用ランダム経路

        戻り値
            plot_result(bbol): True / False = 成功 / 失敗
        """
        plot_result = False

        # データをリセットする
        self._reset3D()

        # 引数の確認
        if pathes.size == 0 or debug_pathes.size == 0 or debug_random_pathes.size == 0:
            return plot_result

        # デバッグ用経路とデバッグ用ランダム経路の行数が一致していることを確認
        if debug_pathes.shape[0] != debug_random_pathes.shape[0]:
            # 異常なデータ
            return plot_result

        # アニメーションのフレーム数
        n_frame = debug_pathes.shape[0] + self._ONE_CUT_NUM * 4
        animation = ani.FuncAnimation(self._figure, self._update_3Ddata, fargs=(pathes, debug_pathes, debug_random_pathes), interval=500, frames=n_frame)

        # アニメーション
        animation.save(self._ANIMATION_NAME, writer="imagemagick")
        plt.show()

        plot_result = True

        return plot_result
    # 新規追加 ↑
RRTの経路生成およびアニメーションを実施するメイン処理は下記の通りである.
# ライブラリの読み込み
import numpy as np
import matplotlib.pyplot as plt

# 自作モジュールの読み込み
from rrt import RRT
from rrt_animation import RRTAnimation


def path_planning():
    """
    経路生成
    """
    # 始点と終点を作成 (# 変更)
    start_pos = np.array([0, 0, 0]).reshape(1, -1)
    end_pos   = np.array([2, 2, 2]).reshape(1, -1)
    # RRTクラスのインスタンスを作成
    rrt = RRT()
    # 始点から終点までの経路を生成
    planning_result = rrt.planning(start_pos, end_pos)
    # 生成した経路をファイルに保存
    rrt.save()

    # RRTアニメーションのインスタンスを作成
    rrtAni = RRTAnimation(rrt.strict_min_pos, rrt.strict_max_pos)
    # アニメーションを描画 (# 変更)
    result = rrtAni.plot_3DAnimation(rrt.pathes, rrt.debug_pathes, rrt.debug_random_pathes)

if __name__ == "__main__":
    # 本ファイルがメインで呼ばれた時の処理
    path_planning()
main.pyを実行すると,"rrt_animation.gif"が作成される.
RRTによる経路生成は下図のようになった.
アニメーションの見方は以下の通りである.
・水色の星形(左下)データ:経路生成の始点
・緑色の星形(右上)データ:経路生成の終点
・黒色の星形データ:RRTで生成された経由点
・青色の丸データ:新規データ
・赤色の星形データ:乱数データ
・赤色の線:乱数データと最短距離のデータを結んだ線
・緑色の線:最終的な始点から終点までの経路
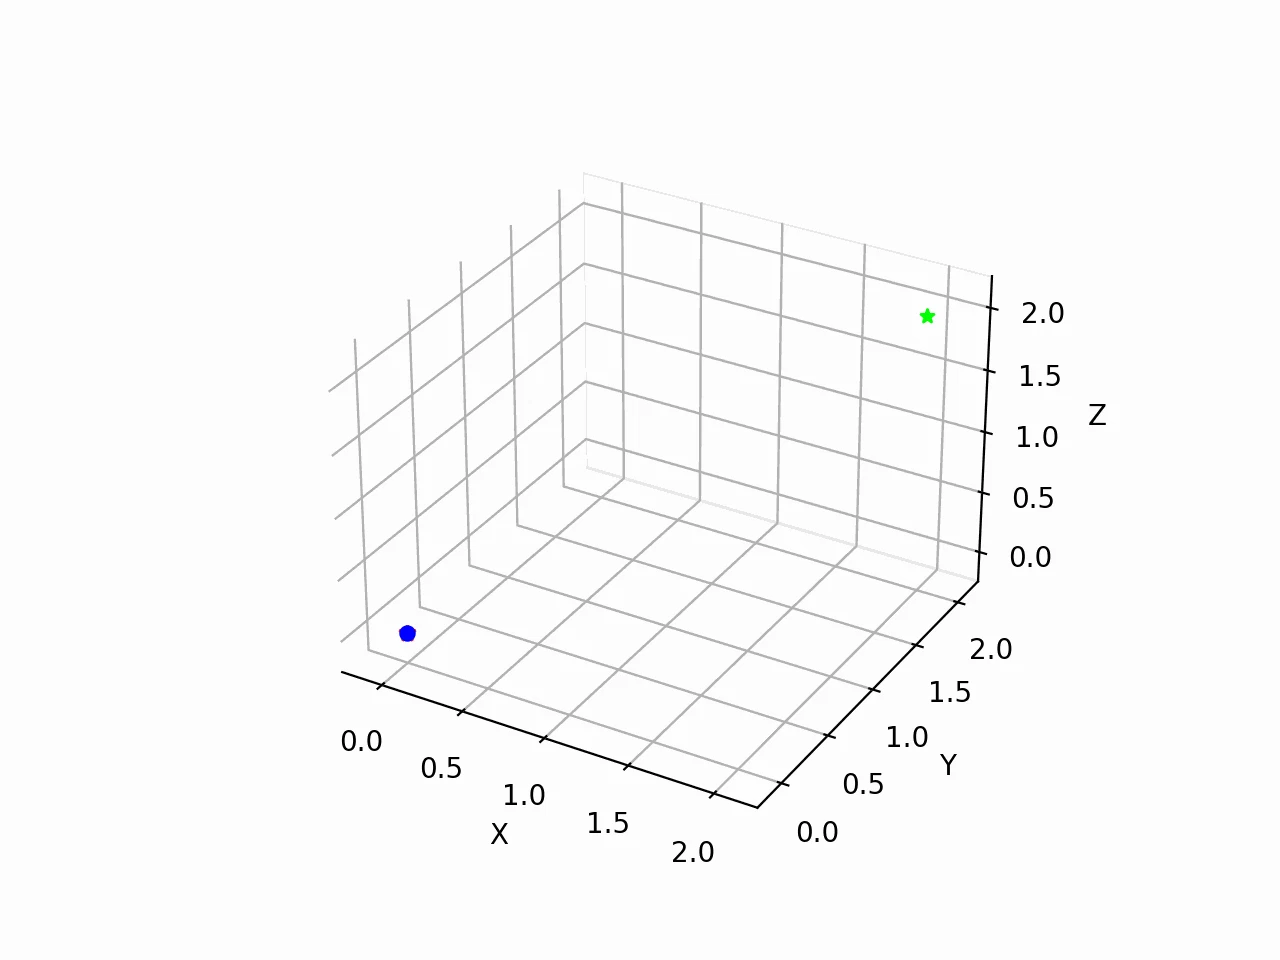
上アニメーションより,想定通りに動いていることが確認できた.
今回は干渉物のない環境において経路生成をしたが,現実世界では干渉物があるため,干渉物のある環境においても経路生成ができるようにしたい.
おわりに
本記事では,Pythonを使用して,下記内容を実装しました.
・3次元空間でのRRTによる経路生成
・経路生成のアニメーション
次記事では,下記内容を実装していきます.
・球の干渉物を考慮した,3次元空間でのRRTによる経路生成
(https://qiita.com/haruhiro1020/items/61e477b156daa6b0cc40)