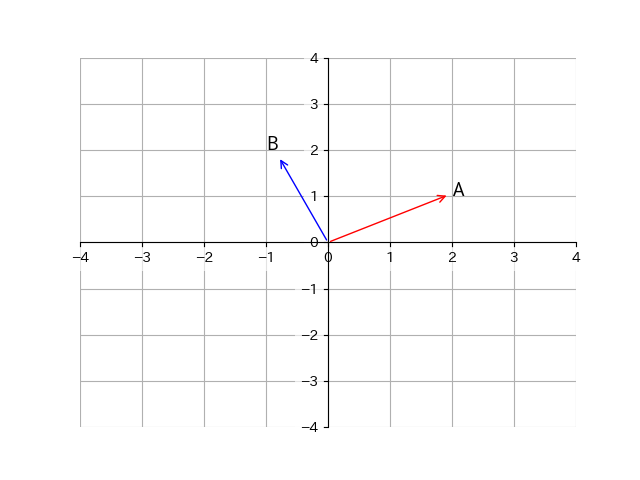
サンプル図
こんな感じの図を作りたかった.
(この図のソースコードを見たい方はページ最下部へ)
コード
Axes内のspinesのメソッドset_positionを利用して, 軸を移動する.
また, Axes内のspinesのset_visibleを利用して軸を消す.
from matplotlib import pyplot as plt

if __name__ == '__main__':
    fig = plt.figure()
    ax = fig.add_subplot(111)

    # 下軸と左軸をそれぞれ中央へもってくる
    ax.spines['bottom'].set_position(('data', 0))
    ax.spines['left'].set_position(('data', 0))

    # 上軸と右軸を表示しない
    ax.spines['right'].set_visible(False)
    ax.spines['top'].set_visible(False)
spinesのset_position()に関して
このメソッドは1つのタブルpositionを渡す必要があります.
set_position(position)
positionは以下の二つの内容からなっています.
-
position type… 配置の指定方法を'outward'/'axes'/'data'の3つから選びます. -
amount… 位置を数値で具体的に決めます. 数値の置き方はposition typeによって異なります.
position type |
概要 |
|---|---|
'outward' |
外枠の位置からどれだけ外側へいくかで位置を指定する. amountが負なら内側へ |
'axes' |
軸の位置を割合で指定する.($0\leq $amount$ \leq 1$) amount=0.3なら左から/下から30%の位置に軸が置かれます. |
'data' |
利用しているデータの値で軸の位置を指定する. amount=2ならその軸が2の位置へ置かれる. |
以下にそれぞれを利用したプログラムと出力図をのせます.
'outward'
ax.spines['bottom'].set_position(('outward', 20))
ax.spines['left'].set_position(('outward', -20))
ax.spines['right'].set_visible(False)
ax.spines['top'].set_visible(False)
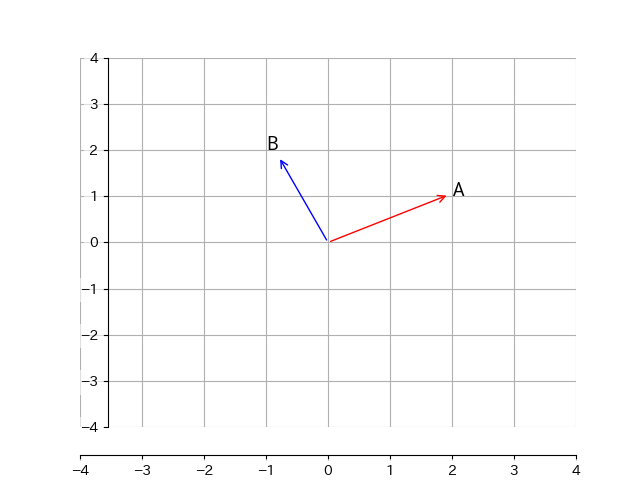
下軸が最初の位置から外側へ, 左軸が内側へ移動しているのがわかります.
'axes'
ax.spines['bottom'].set_position(('axes', 0.5))
ax.spines['left'].set_position(('axes', 0.2))
ax.spines['right'].set_visible(False)
ax.spines['top'].set_visible(False)
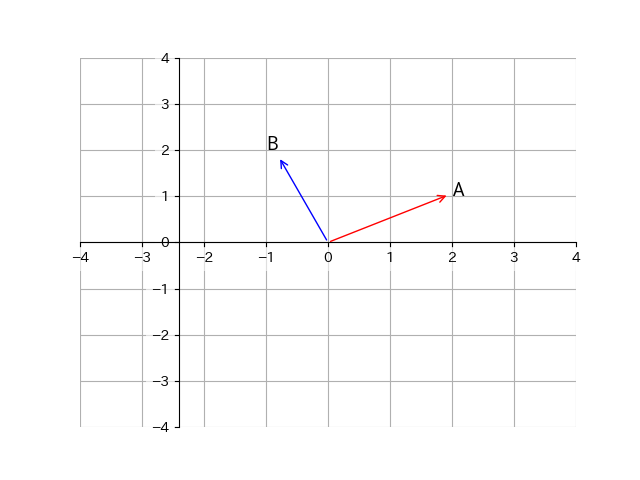
下軸が50%上の位置に, 左軸が20%右の位置へずれています.
'data'
ax.spines['bottom'].set_position(('data', 2))
ax.spines['left'].set_position(('data', -3))
ax.spines['right'].set_visible(False)
ax.spines['top'].set_visible(False)
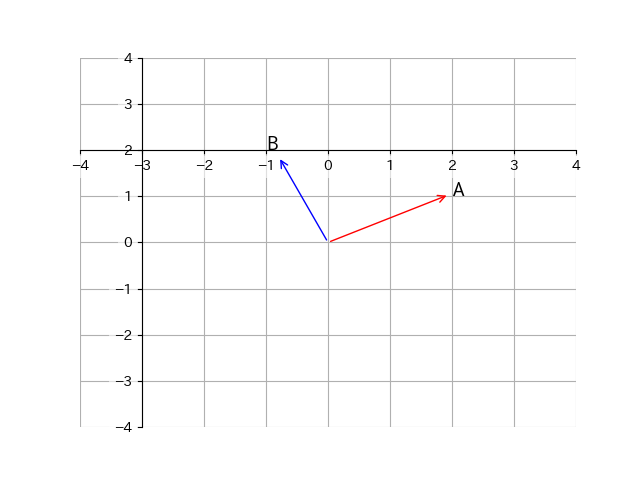
下軸がy軸方向の2の位置に, 左軸がx軸方向の-3の位置に移動しています.
その他
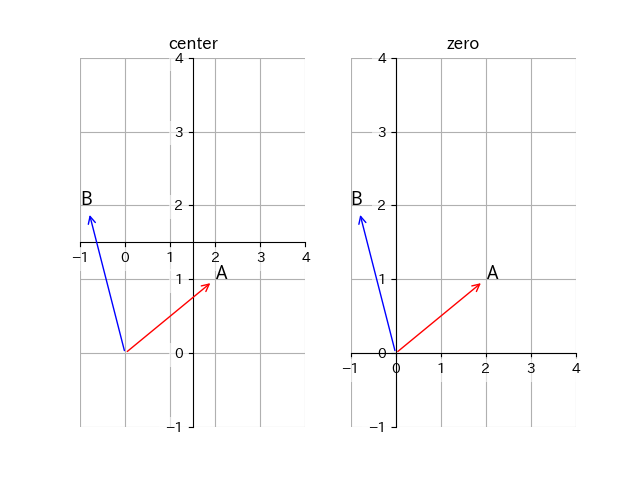
特殊な引数として'center'と'zero'も利用できます.
これらは下記のように省略版となっています.
| 引数 | 実際の意味 |
|---|---|
'center' |
('axes', 0.5) |
'zero' |
('data', 0.0) |
以下のようなコードで実行した時の図も載せておきます.
ax.spines['bottom'].set_position('center')
ax.spines['left'].set_position('center')
ax.spines['right'].set_visible(False)
ax.spines['top'].set_visible(False)
ax.spines['bottom'].set_position('zero')
ax.spines['left'].set_position('zero')
ax.spines['right'].set_visible(False)
ax.spines['top'].set_visible(False)
おまけ
冒頭の図のソースコードをのせておきます.
import numpy as np
import matplotlib as mpl
from matplotlib import pyplot as plt
import os
import re


def main():
    font = {"family": "IPAexGothic"}
    mpl.rc('font', **font)

    point_list = [
        {'p': [2, 1], 'name': 'A', 'c': 'red'},
        {'p': [-1, 2], 'name': 'B', 'c': 'blue'},
    ]

    fig = plt.figure()
    ax = fig.add_subplot(111)

    for p in point_list:
        ax.annotate(s=p['name'], xy=[0, 0], xytext=p['p'], fontsize=13,
                    arrowprops=dict(arrowstyle='<-',
                                    connectionstyle='arc3',
                                    facecolor=p['c'], edgecolor=p['c'])
                    )

    lim = [-4, 4]

    ax.set_xlim(lim)
    ax.set_ylim(lim)

    ax.grid()

    ax.spines['bottom'].set_position('center')
    ax.spines['left'].set_position('center')
    ax.spines['right'].set_visible(False)
    ax.spines['top'].set_visible(False)

    for label in ax.get_xticklabels() + ax.get_yticklabels():
        label.set_bbox(dict(facecolor='white', edgecolor='None', alpha=0.6))

    plt.savefig(re.sub(".py", "", os.path.basename(__file__))+".png")


if __name__ == '__main__':
    main()