0. 概要
点群が得られたとする。この点群から代表的な点はどこかを探したい。よくある方法は平均値を取る方法である。しかしこの方法は外れ値に弱い。
また、座標として不連続の場合あり得ない座標(ゴルフコースでいう山林的な場所)を示す場合がある。そこで、全点群の距離を計算し、その距離が最も小さい点群を選ぼうとする。この場合、$O = N^2$となりとてつもない計算量になる。よってこの手法は現実的ではない。
では、どうしたらよいか?それをインターネットで調査したものの全く見つからなかった。というか検索ワードが分からなかった。
その後、5分くらい考えたすえ以下の方法を思いついた。
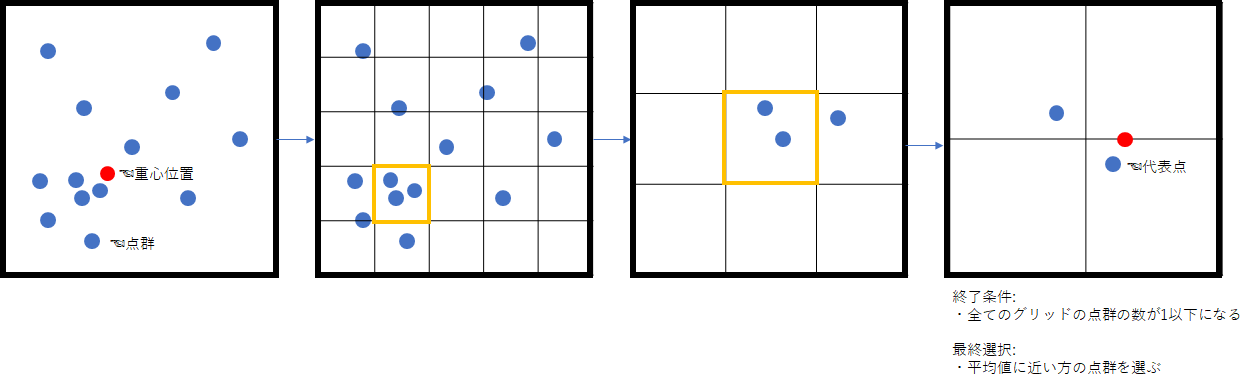
アルゴリズムも簡単で、以下のものを実装する。
- 全点群をグリッドで分ける
- グリッド内で点群が多いものを抽出
- 抽出した点群でまた1)を繰り返す
- グリッド内に含まれる点群が全て1以下になったら終了条件である。
- 複数グリッドに1つの点群が含まれる場合は、全点群の平均位置から近い点群を代表点とする
1. 実装
全探索
最も安定性のある解を出すが、計算量が$O = N^2$になってしまうプログラムである。
def repPoint_full_search(_x, _y):
  data_num = len(_x)
  distance = np.zeros(data_num)
  for i in range(data_num):
    for j in range(data_num):
      distance[i] += np.abs(_x[i] - _x[j]) + np.abs(_y[i] - _y[j])
  return distance

x = np.random.rand(1000)
y = np.random.rand(1000)
plt.figure(figsize=(12, 10))
plt.scatter(x, y)
dis = repPoint_full_search(x, y)
num = np.argmin(dis)
plt.scatter([x[num]], [y[num]], c='pink')
plt.xlabel("z[0]")
plt.ylabel("z[1]")
plt.savefig("repPoint.png")
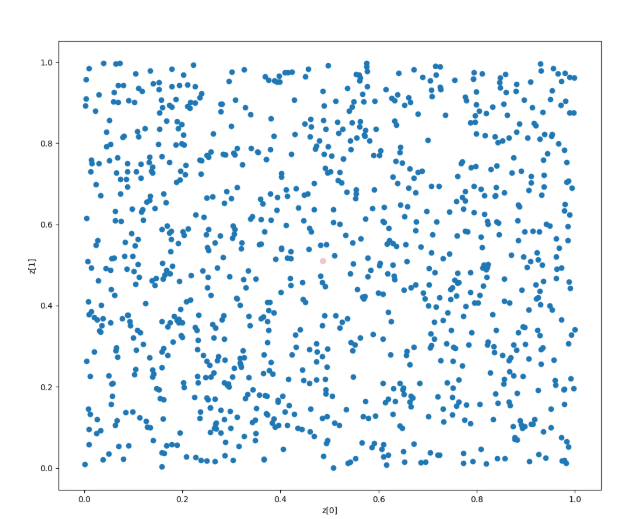
1000x1000程度なので20秒程度で終わる。しかし、5000x5000とかになるともう終わらない。
計算量は25, 000, 000にもなり、1msで1サイクルの計算が終わるとしても6.94hの計算がかかる
グリッドサーチ法
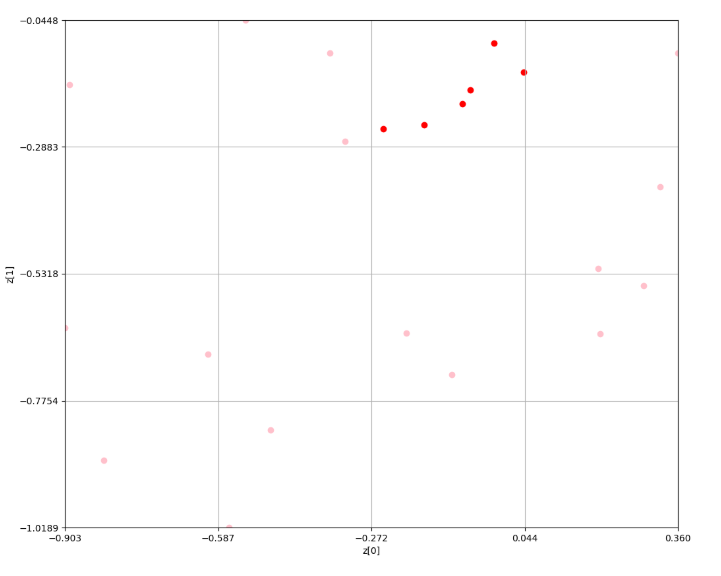
結果から説明する。
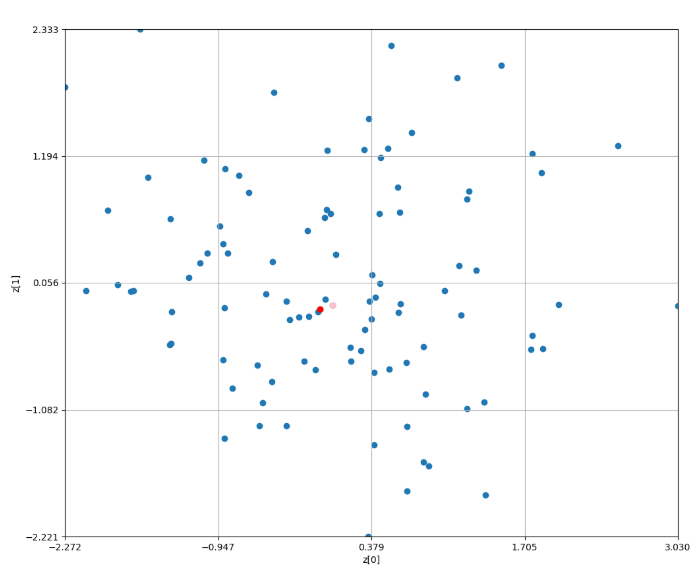
赤色がグリッドサーチによる点群の代表点である。ピンク色が全探索の結果の代表点である。
残念ながら同じ点群を指すことは出来ていないが、少ない計算量で近しいところを見つけてこれている。
次に、処理手順を説明する。
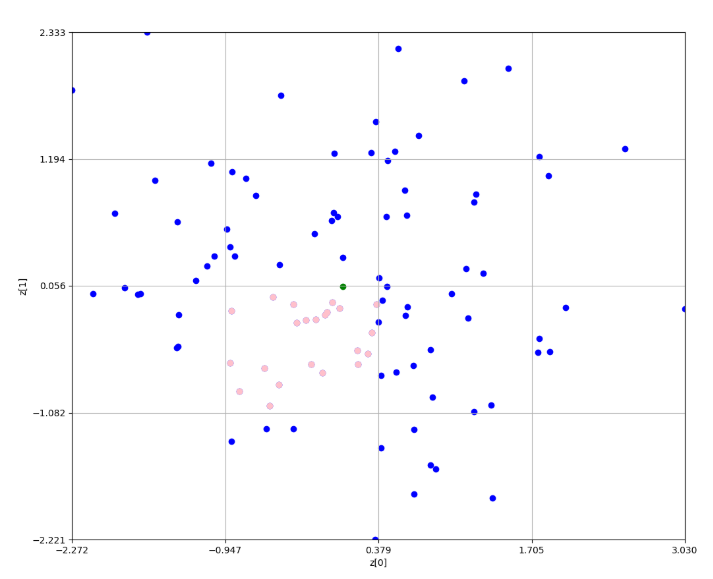
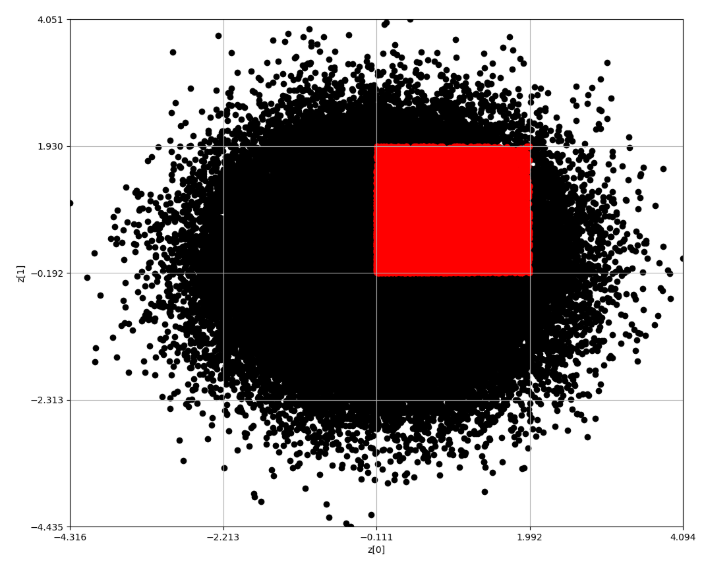
全点群データから密集度が最も高いグリッドを見つける。ここだとピンク色である。
因みに、緑色の点が平均位置である。なお、この後はこれを繰り返していく
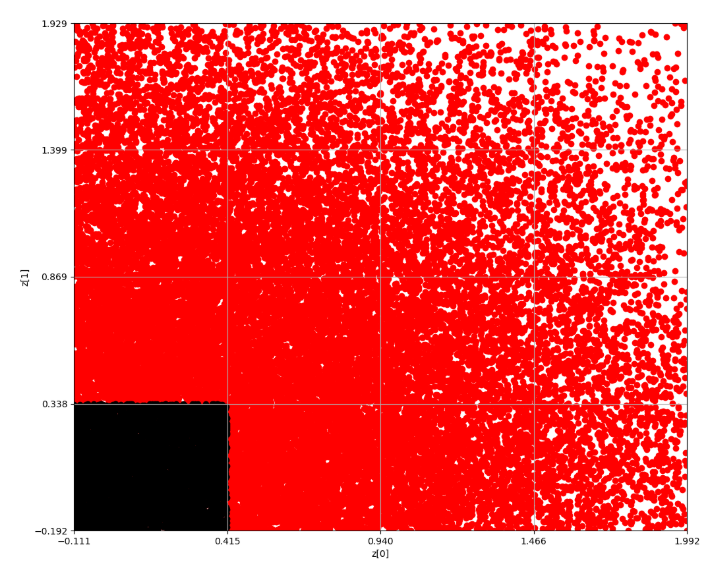
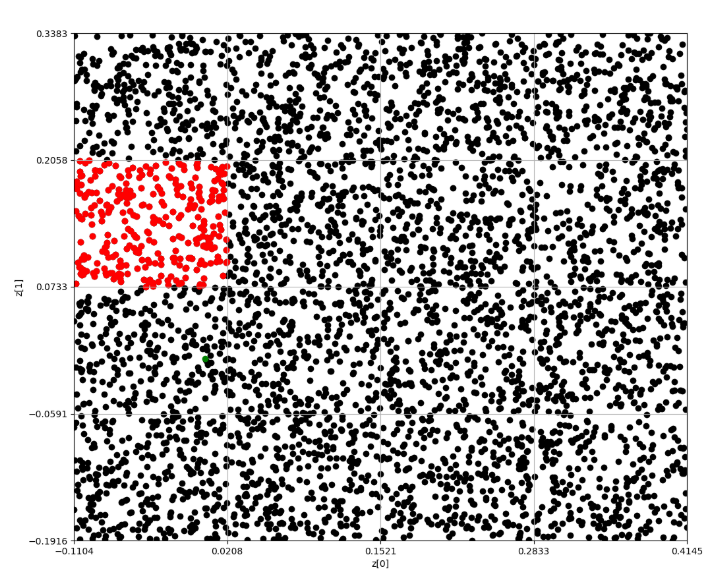
2エポック目
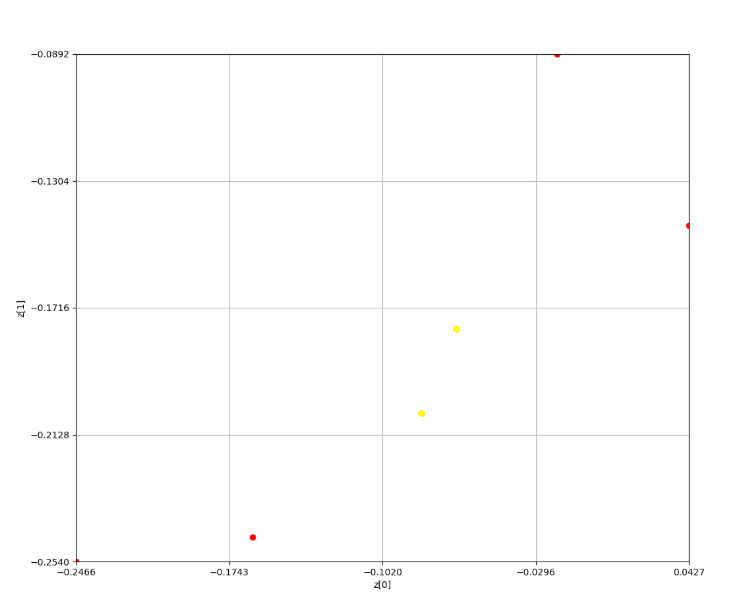
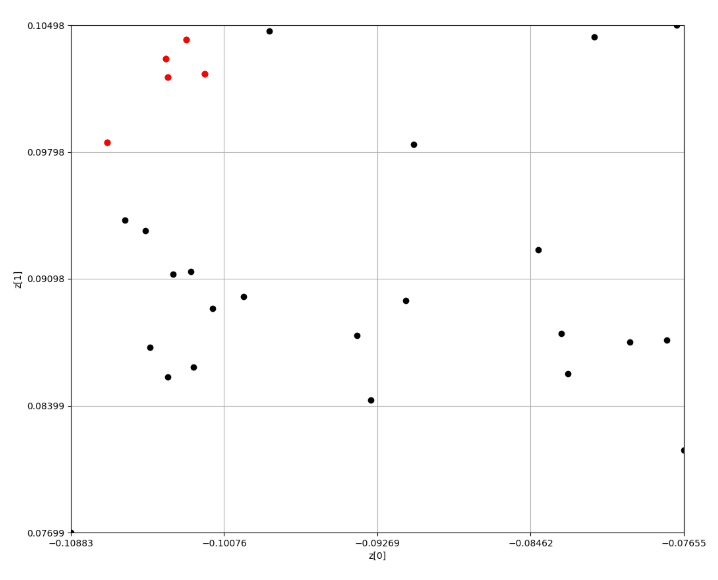
3エポック目
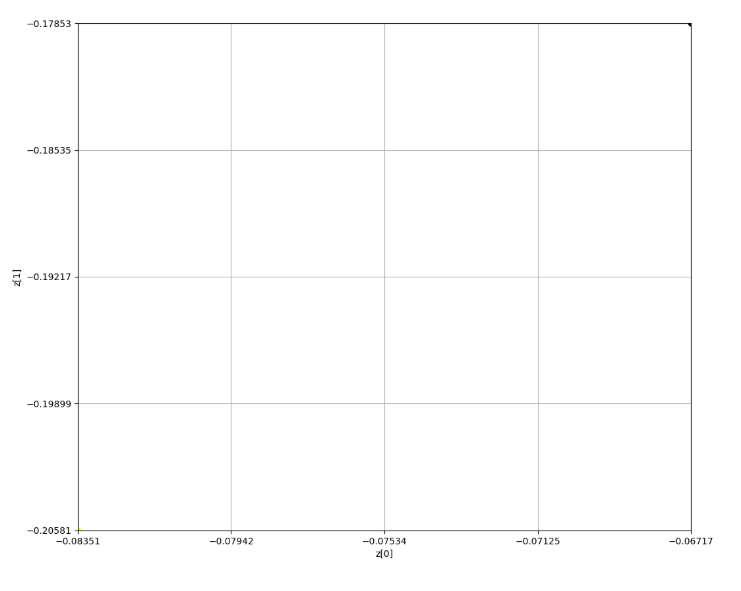
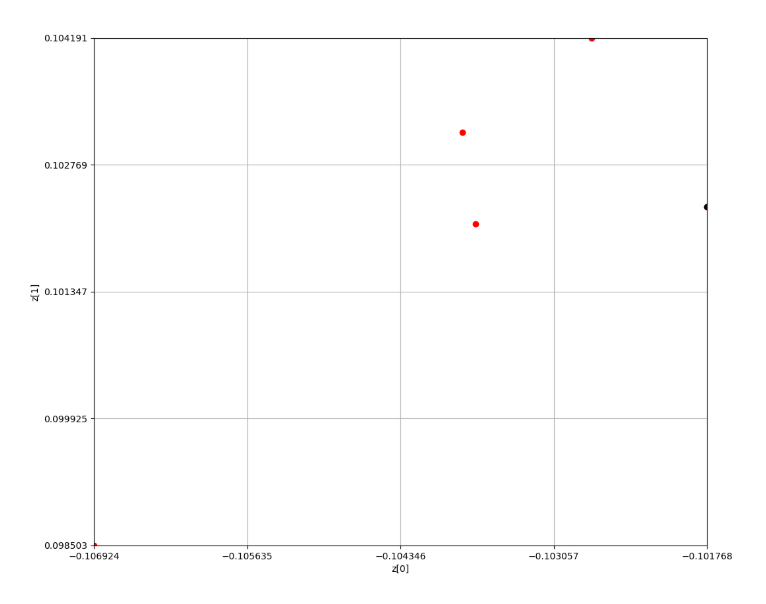
4エポック目
ここで点群が1つに絞られ、1つの結果が返ってきている
4x4のグリッドで探索を行った途中結果を以下に示す。
[2. 4. 5. 2.]
[ 7. 12.  9.  1.]
[ 7. 22. 14.  5.]
[0. 4. 6. 0.]
[5]
0.7743798569440619
Minimum grid:
5
--------------------
[1. 3. 6. 1.]
[0. 0. 0. 2.]
[2. 0. 2. 2.]
[1. 2. 0. 0.]
[14]
0.3999928541358709
Minimum grid:
14
--------------------
[0. 0. 0. 1.]
[0. 0. 0. 1.]
[0. 0. 2. 0.]
[1. 1. 0. 0.]
[6]
0.39153543531607427
Minimum grid:
6
--------------------
[0. 0. 0. 1.]
[0. 0. 0. 0.]
[0. 0. 0. 0.]
[1. 0. 0. 0.]
[0, 15]
0.4133443602306934
0.3697265104014552
Minimum grid:
15
--------------------
最終的にグリッドの対角のみが残り、平均位置に最も近い方が採用される仕組みとなっている
コードを以下に示す。
def grid_search(_x, _y, _mx, _my, _grid_num = 4):
  data_num = len(_x)
  distance = np.zeros(data_num)
  ##
  tmp_x = _x
  tmp_y = _y
  center_x_all_data = _mx
  center_y_all_data = _my
  eps = 0.00000001
  # can optimize yet
  min_x = np.min(tmp_x) - eps
  max_x = np.max(tmp_x) + eps
  min_y = np.min(tmp_y) - eps
  max_y = np.max(tmp_y) + eps
  split_num = _grid_num
  step_x = (max_x - min_x) / split_num
  step_y = (max_y - min_y) / split_num
  #
  grid_count = np.zeros(split_num * split_num)
  grid_center_x = np.zeros(split_num * split_num)
  grid_center_y = np.zeros(split_num * split_num)

  # phase 1: Deviding grids
  for i in range(data_num):
    x_num = math.floor ( ( (tmp_x[i] - min_x) / step_x) )
    y_num = math.floor( ( (tmp_y[i] - min_y) / step_y) )
    grid_num = int(x_num + ( y_num * split_num ))
    grid_count[grid_num] += 1
    grid_center_x[grid_num] += tmp_x[i]
    grid_center_y[grid_num] += tmp_y[i]

  for i in range(_grid_num):
    j = (_grid_num - 1) - i
    print(grid_count[j*_grid_num:(j*_grid_num)+_grid_num])

  # phase 2: finding density grid
  maxIndex = [i for i, x in enumerate(grid_count) if x == max(grid_count)]
  print(maxIndex)

  tmp_cost = 99999999
  tmp_idx = -1
  for i in range(len(maxIndex)):
    idx = maxIndex[i]
    cx = grid_center_x[idx] / grid_count[idx]
    cy = grid_center_y[idx] / grid_count[idx]
    r = np.abs(cx - center_x_all_data) + np.abs(cy - center_y_all_data)
    print(r)
    if r < tmp_cost:
      tmp_cost = r
      tmp_idx = i

  print("Minimum grid:")
  print(maxIndex[tmp_idx])
  print("--------------------")
  gird_idx = maxIndex[tmp_idx]

  # phase : choosing point data
  ext_tmp_x = []
  ext_tmp_y = []
  for i in range(data_num):
    x_num = math.floor ( ( (tmp_x[i] - min_x) / step_x) )
    y_num = math.floor( ( (tmp_y[i] - min_y) / step_y) )
    grid_num = int(x_num + ( y_num * split_num ))
    if(grid_num == gird_idx):
      ext_tmp_x.append(tmp_x[i])
      ext_tmp_y.append(tmp_y[i])

  return (ext_tmp_x, ext_tmp_y)


x = np.random.normal(0, 1, 100)
y = np.random.normal(0, 1, 100)
ex = x
ey = y
mx = np.average(x)
my = np.average(y)
carray = ['blue', 'pink', 'red', 'yellow', 'black', 'blue']
for i in range(5):
  plt.clf()
  plt.figure(figsize=(12, 10))
  plt.scatter(ex, ey, c=carray[i])
  plt.scatter([mx], [my], c='green')
  plt.xlabel("z[0]")
  plt.ylabel("z[1]")
  plt.ylim(np.min(ey), np.max(ey) )
  plt.xlim(np.min(ex), np.max(ex) )
  plt.xticks(np.linspace(np.min(ex), np.max(ex), 5))
  plt.yticks(np.linspace(np.min(ey), np.max(ey), 5))
  ex, ey = grid_search(ex, ey, mx, my)
  plt.scatter(ex, ey, c=carray[i+1])
  plt.grid()
  plt.savefig("./gird/repPoint" + str(i) +".png")
  if len(ex) == 1:
    break

# all data
plt.clf()
plt.figure(figsize=(12, 10))
plt.scatter(x, y)
dis = repPoint_full_search(x, y)
num = np.argmin(dis)
plt.scatter([x[num]], [y[num]], c='pink')
plt.scatter([ex], [ey], c='red')
plt.xlabel("z[0]")
plt.ylabel("z[1]")
plt.ylim(np.min(y), np.max(y) )
plt.xlim(np.min(x), np.max(x) )
plt.xticks(np.linspace(np.min(x), np.max(x), 5))
plt.yticks(np.linspace(np.min(y), np.max(y), 5))
plt.grid()
plt.savefig("./gird/repPoint.png")
100, 000 x 100, 000
なお、この方法だと100, 000の点群でも1秒もかからずに処理が終わる。
Epoch 1
Epoch 2
Epoch 3
Epoch 4
Epoch 5
このように10万個の点群、すなわち愚直にやれば10, 000, 000, 000サイクルを要する場合でも
10万×5回(×3)程度のサイクルで終わる。約7000倍の効率化である。