はじめに
機械学習エンジニアを目指す方なら一度はやったことがあるであろう【SIGNATE】の国勢調査からの収入予測をやってみました。
環境情報
Python 3.6.5
【SIGNATE】国勢調査からの収入予測とは
教育年数や職業等の国勢調査データから年収が$50,000ドルを超えるかどうかを予測する2値分類問題です。
以下リンク
https://signate.jp/competitions/107
#内容
データの読み込みと可視化
データを読み込んで基本的な情報を確認.
import pandas as pd
import numpy as np
import matplotlib.pyplot as plt
import matplotlib as mpl
import seaborn as sns

df = pd.read_csv('train.tsv', delimiter = '\t')
df = df.drop('id', axis = 1)
# データ量を確認.
print(df.shape)
# 欠損値の確認.
print(df.isnull().sum())
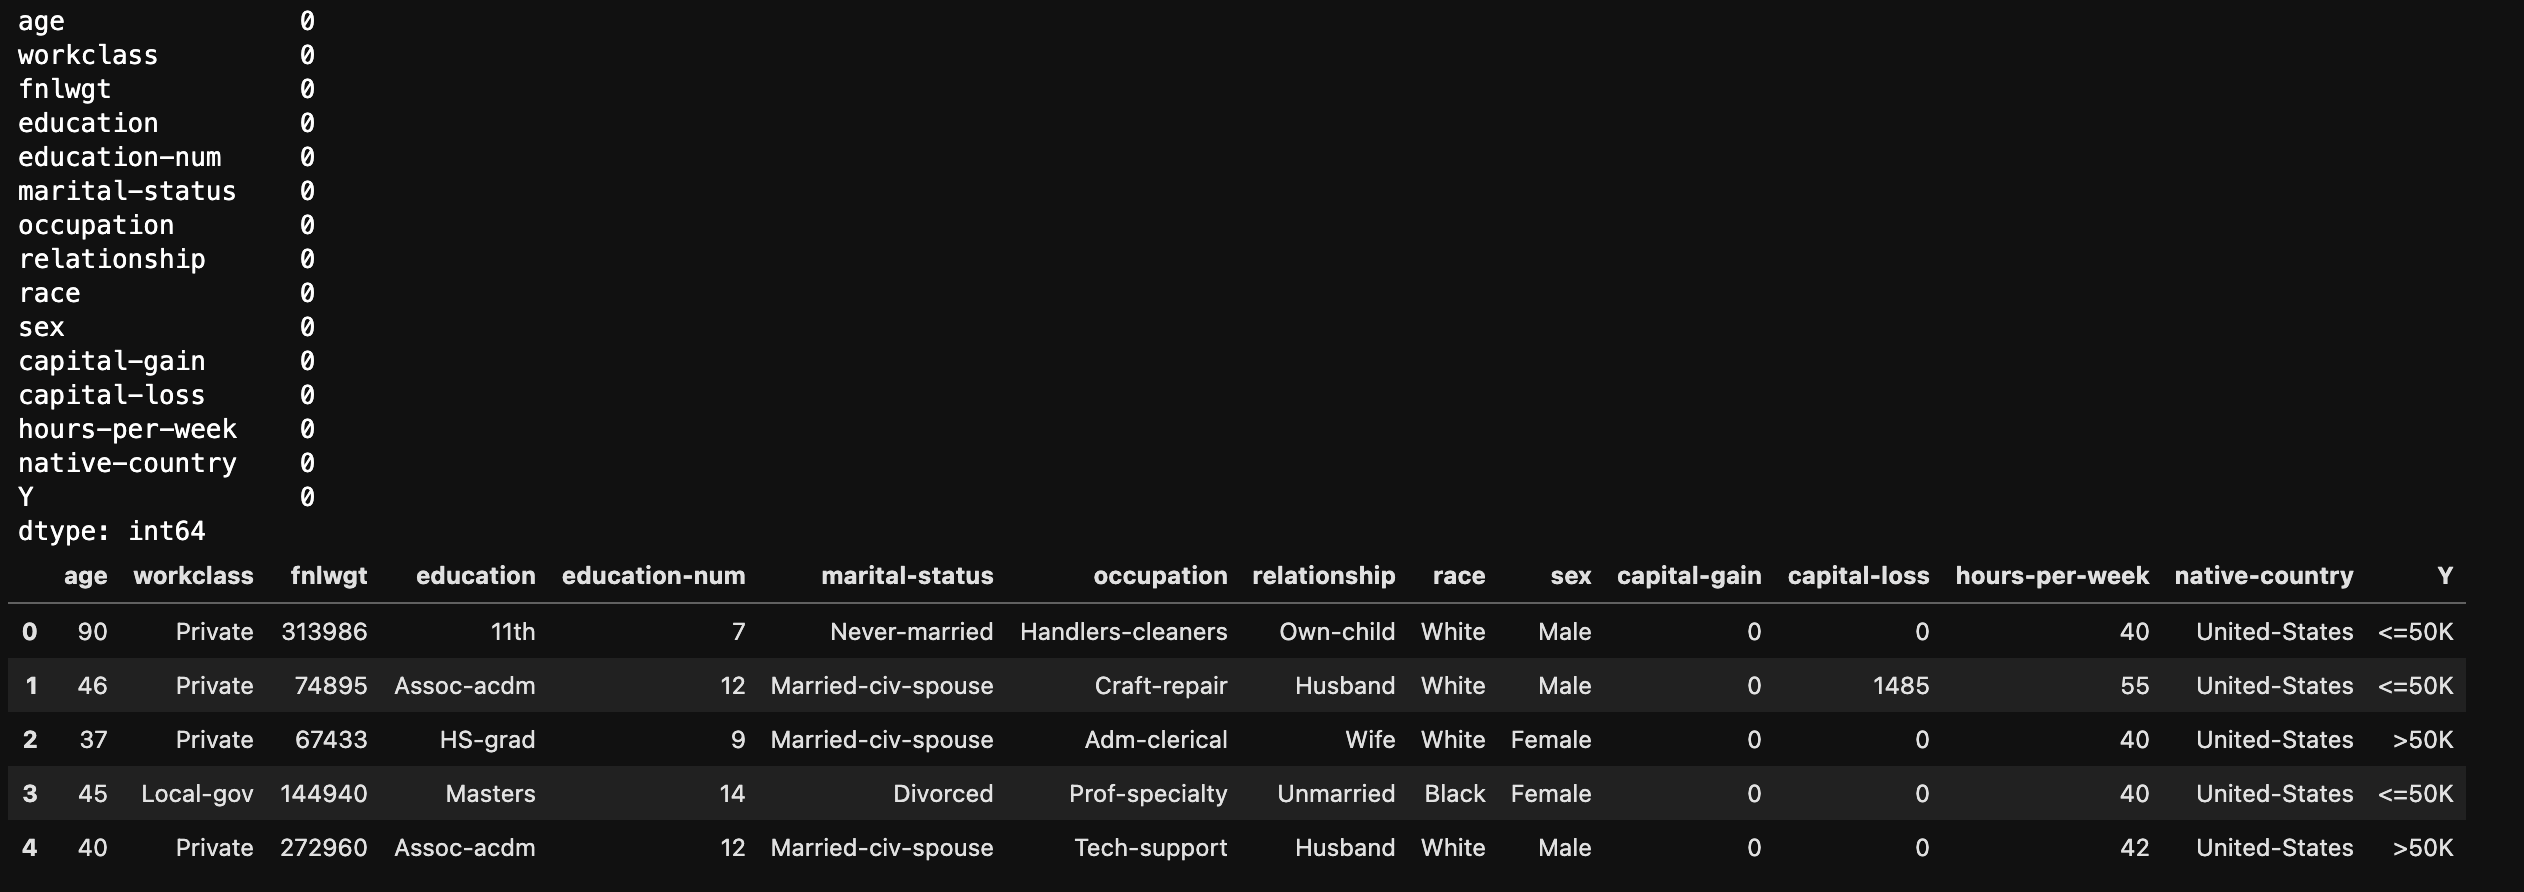
上記のソースコードを実行すると、下記の結果が返ってきます。
データの総数:16280
説明変数:14
目的変数:1
欠損値はなし
ということがわかりました。
目的変数を数値に置き換える。(<=50K → 0, >50K → 1)
df = df.replace({'Y': {'<=50K': 0, '>50K': 1}})
df['Y'].value_counts()

0    12288
1     3992
Name: Y, dtype: int64
全体の30%は年収50,000$未満のようですね。
量的データを可視化
sns.pairplot(df, hue="Y", diag_kind='hist', vars = ['age', 'fnlwgt', 'education-num'])
sns.pairplot(df, hue="Y", diag_kind='hist', vars = ['capital-gain', 'capital-loss', 'hours-per-week'])
capital-lossとcapital-gainに特徴がありそうな感じがするけど、、、
よくわからない。。。
クロス集計表で文字列のデータを確認
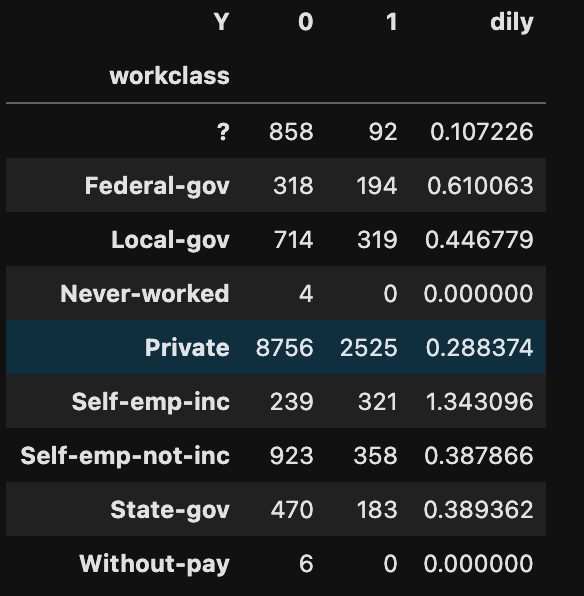
# 職業クラス
work = pd.crosstab(df['workclass'], df['Y'])
work['dily'] = work[1] / work[0]
print(work)
他のデータも確認したけど、よくわからなかったので、「dily」の値が近いものをまとめてみた。
?,nev,pri,with = 0
fed,loca,self,state = 1
self_emp_inc = 2
データの前処理
# まとめにくいものを削除
drop_list = ['occupation', 'native-country']
df = df.drop(drop_list, axis = 1)

# 文字列データを数値に変換しつつ、「dily」の値が近いものをまとめる。

#職業クラス
df= df.replace({'workclass':['?', 'Never-worked', 'Private', 'Without-pay']}, 0)
df= df.replace({'workclass':['Federal-gov', 'Local-gov', 'Self-emp-not-inc', 'State-gov']}, 1)
df= df.replace({'workclass':['Self-emp-inc']}, 2)

#教育
df = df.replace({'education': ['10th', '11th', '12th', '1st-4th', '5th-6th', '7th-8th', '9th', 'HS-grad', 'Preschool']}, 0)
df = df.replace({'education': ['Assoc-acdm', 'Assoc-voc', 'Bachelors', 'Prof-school', 'Some-college']}, 1)
df = df.replace({'education': ['Doctorate', 'Masters', 'Prof-school']}, 2)

# 配偶者の有無
df = df.replace({'marital-status': ['Divorced', 'Married-spouse-absent', 'Never-married', 'Separated', 'Widowed']},0)
df = df.replace({'marital-status': ['Married-AF-spouse', 'Married-civ-spouse']}, 1)

# 関係
df = df.replace({'relationship': ['Not-in-family', 'Other-relative', 'Own-child', 'Unmarried']}, 0)
df = df.replace({'relationship': ['Husband', 'Wife']}, 1)

# 人種
df = df.replace({'race': ['Amer-Indian-Eskimo', 'Black', 'Other']}, 0)
df = df.replace({'race': ['Asian-Pac-Islander', 'White']}, 1)

# 性別
df['sex'] = df['sex'].replace('Female', 0).replace('Male', 1)
訓練データと評価データに分類
from sklearn.model_selection import train_test_split

train_set, test_set = train_test_split(df, test_size = 0.2, random_state = 4)

#訓練データを説明変数(X_train)と目的変数(y_train)に分割
X_train = train_set.drop('Y', axis=1)
y_train = train_set['Y']

#評価データを説明変数(X_train)と目的変数(y_train)に分割
X_test = test_set.drop('Y', axis=1)
y_test = test_set['Y']
最適モデルの検討
# 必要なライブラリのインポート
from sklearn.linear_model import LogisticRegression
from sklearn.ensemble import RandomForestClassifier
from sklearn.svm import SVC
# 正解率
from sklearn.metrics import accuracy_score

# 空のリストを用意
model_list = []

# リストにモデルを追加。
# ロジスティック回帰
model_list.append(LogisticRegression(solver='lbfgs'))
#ランダムフォレスト
model_list.append(RandomForestClassifier(n_estimators=100))
# サポートベクターマシン
model_list.append(SVC(gamma='scale'))

# for文でリストからモデルを取り出し、学習と予測、F1値での評価を行う
for i in model_list:
    i.fit(X_train, y_train)
    pred = i.predict(X_test)
    print(accuracy_score(y_test, pred))
出力結果は以下のとおり。
0.7954545454545454
0.8498157248157249
0.7757985257985258
ランダムフォレストの精度が一番良いですね!!
パラメータの最適化(グリットサーチ)
# グリットサーチ
from sklearn.model_selection import GridSearchCV

# 試すパラメータを指定
search_gs = {
"max_depth": [5, 10, 15],
"n_estimators":[50, 100],
"min_samples_split": [4, 6],
"min_samples_leaf": [3, 5],
}

# ランダムフォレストの定義
model_gs = RandomForestClassifier()

# グリットサーチの定義
gs = GridSearchCV(model_gs,
                  search_gs,
                  cv = 3, # 交差検証の回数
                  )

# グリットサーチの実行
gs.fit(X_train, y_train)

# 最適なパラメータの表示
print(gs.best_params_)
最適なパラメータは以下のように表示されました。
{'max_depth': 10, 'min_samples_leaf': 3, 'min_samples_split': 4, 'n_estimators': 100}
再度学習の実施及び評価
clf_gs = RandomForestClassifier(max_depth=10,
                                min_samples_leaf= 3,
                                max_features  = 5,
                                min_samples_split= 4,
                                n_estimators= 100)
model_gs = clf_gs.fit(X_train, y_train)
pred_gs = model_gs.predict(X_test)

# モデルの評価
from sklearn import metrics
print(metrics.classification_report(y_test, pred_gs))
結果は以下のとおり
正解率86%!
まあまあかな。
結果の提出
# テストデータの読み込み
df1= pd.read_csv('test.tsv', delimiter = '\t')

# 訓練データとデータの形式を揃える
drop_list = ['id', 'occupation', 'native-country']
df1 = df1.drop(drop_list, axis = 1)

#職業クラス
df1= df1.replace({'workclass':['?', 'Never-worked', 'Private', 'Without-pay']}, 0)
df1= df1.replace({'workclass':['Federal-gov', 'Local-gov', 'Self-emp-not-inc', 'State-gov']}, 1)
df1= df1.replace({'workclass':['Self-emp-inc']}, 2)

#教育
df1 = df1.replace({'education': ['10th', '11th', '12th', '1st-4th', '5th-6th', '7th-8th', '9th', 'HS-grad', 'Preschool']}, 0)
df1 = df1.replace({'education': ['Assoc-acdm', 'Assoc-voc', 'Bachelors', 'Prof-school', 'Some-college']}, 1)
df1 = df1.replace({'education': ['Doctorate', 'Masters', 'Prof-school']}, 2)

# 配偶者の有無
df1 = df1.replace({'marital-status': ['Divorced', 'Married-spouse-absent', 'Never-married', 'Separated', 'Widowed']},0)
df1 = df1.replace({'marital-status': ['Married-AF-spouse', 'Married-civ-spouse']}, 1)

# 関係
df1 = df1.replace({'relationship': ['Not-in-family', 'Other-relative', 'Own-child', 'Unmarried']}, 0)
df1 = df1.replace({'relationship': ['Husband', 'Wife']}, 1)

# 人種
df1 = df1.replace({'race': ['Amer-Indian-Eskimo', 'Black', 'Other']}, 0)
df1 = df1.replace({'race': ['Asian-Pac-Islander', 'White']}, 1)

# 性別
df1['sex'] = df1['sex'].replace('Female', 0).replace('Male', 1)

# 学習済モデルで評価
pred_test = model_gs.predict(df1)

# 結果をDataFrameへ変換
test = pd.DataFrame(pred_test, columns = ['sample_submit'])
# 提出用の形式へ変換
test = test.replace({'sample_submit': {0: '<=50K', 1: '>50K'}})
# 提出用のIDを取得
df2= pd.read_csv('test.tsv', delimiter = '\t')
test = pd.concat([df2['id'], test], axis=1)
# csvデータで保存
test[['id', 'sample_submit']].to_csv('./submit.csv', header=False, index=False)
結果は『0.8610650』で197位!!
まとめ
前処理をもっと工夫するか、XGBoostを使ってみればもっと精度が上がるかな。。
次は多項分類に挑戦します!!!


