はじめに
統計や機械学習の多くは、パラメータを推定する際にその値のみを推定します。それらをまとめて点推定といいます。
最小二乗法や最尤推定、MAP推定は点推定です。
点推定は計算量が少なく速度が速いなどのメリットがありますが、推定した値がどれくらいの確信を持って推定されたのか直接はわかりません。
そこで、推定するパラメータ自体が別の確率分布から発生したと仮定して、その確率分布の形(確率分布を形作るパラメータの値)を推定します。この推定法は分布推定といいます。
推定した確率分布を用いる事で、パラメータの値やその不確実性が同時にわかります。
ベイズ推定は分布推定です。
今回は、データが多変量正規分布から発生するとしたときに、その分布のパラメータにも確率分布を仮定して、パラメータの事後分布を推定します。
真のパラメータを設定し、そこからデータを発生させ、データから真のパラメータを復元します。
ベイズ推定に必要な式の整理
ベイズ推定は、
- 事象を発生させるモデルとパラメータの事前分布を設定
- 観測データを用いてパラメータの事後分布を導出
- パラメータの事後分布とモデルを用いて未知の事象に対する予測分布を計算
という3つのステップを踏みます。
それぞれの段階で必要な式を整理します。
モデルとパラメータの事前分布
2次元の多変量正規分布を仮定します。
平均パラメータには同じく2次元の多変量正規分布、分散パラメータには逆ウィシャート分布を仮定します。
実際は、これらの同時分布であるNormal-inverse-Wishart Distributionを用います。
x \sim N(x | \mu, \Sigma) \\
p(\mu, \Sigma) = NIW(\mu, \Sigma | m, \beta, \nu, W) = N(\mu | m, \frac{\Sigma}{\beta})W^{-1}(\Sigma | \nu, W)
ただし、$\nu$ > D-1, Dは次元数です。
パラメータの事後分布の導出
それぞれのパラメータの事後分布の更新式は以下のようになります。
導出はややこしいので参考文献などを参照してください。
p(\mu | \Sigma, X) = N(\mu | \hat{m}, \frac{\Sigma}{\hat{\beta}}) \\
\hat{\beta} = N + \beta \\
\hat{m} = \frac{1}{\hat{\beta}}\left( \Sigma_{n=1}^{N} x_{n} + \beta m \right) \\
p(\Sigma | X) = W^{-1}(\Sigma | \hat{\nu}, \hat{W}) \\
\hat{\nu} = N + \nu \\
\hat{W} = \Sigma_{n=1}^{N}x_n x_n^{\mathrm{T}} + \beta m m^{\mathrm{T}} - \hat{\beta} \hat{m} \hat{m}^{\mathrm{T}} + W \\
予測分布の構築
未知のデータ$x$を予測する式は以下のようになります。
x \sim p(x) = \iint p(x | \mu, \Sigma) p(\mu, \Sigma) d \mu d \Sigma
そのまま積分を計算するのは大変ですが、ベイズの定理を使うと積分を回避出来ます。
しかも、データを発生させる確率分布とパラメータの確率分布を上手く設定する事で、予測分布も綺麗な形になります。
\begin{equation}
 \begin{split}
 p(x) &= \frac{p(\mu, \Sigma)p(x | \mu, \Sigma)}{p(\mu, \Sigma | x)} \\
 &= St(x | \mu_s, \Sigma_s, \nu_s)
 \end{split}
\end{equation}
スチューデントのt分布のパラメータは以下のようになります。
 \mu_s = m \\
 \Sigma_s = \frac{1 + \beta}{(1 - D + \nu) \beta} W \\
 \nu_s = 1 - D + \nu
事前分布を用いて予測を行いたいときは$m, \beta, \nu, W$に事前分布のパラメータを代入します。
事後分布を用いて予測を行いたいときは$m, \beta, \nu, W$に事後分布のパラメータを代入します。
実装
# ライブラリのインポート
import pandas as pd
import numpy as np
import matplotlib.pyplot as plt
import seaborn as sns
from tqdm import tqdm_notebook as tqdm

np.random.seed(1234)
pd.set_option('display.max_columns', None)
sns.set_style('darkgrid')

from matplotlib.animation import PillowWriter
from scipy.stats import invwishart, multivariate_normal
from celluloid import Camera
仮想データの作成
真の分布を設定して、データを発生させます。
mu_true = np.array([10, 20])
Sigma_true = np.array([[1, 0.5], [0.5, 1]])

T = 5000
x_data = np.random.multivariate_normal(mu_true, Sigma_true, T)

%matplotlib inline
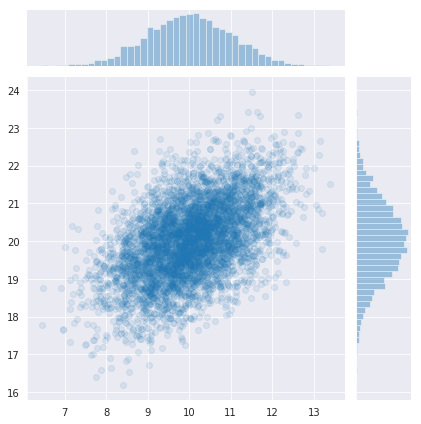
sns.jointplot(x_data[:,0], x_data[:,1], kind='scatter', alpha=0.1);

真の分布は、平均[10, 20], 分散[1,1], 共分散0.5の正規分布です。
パラメータの事前分布を設定
# 事前分布の初期値
m0 = np.zeros(2)
beta0 = 1 # beta0が小さいと時々めっちゃ外れる値が出てくる
nu0 = 2 # 2以上を指定、大きいほど散らばりが大きくなる
W0 = np.eye(2)

%matplotlib nbagg

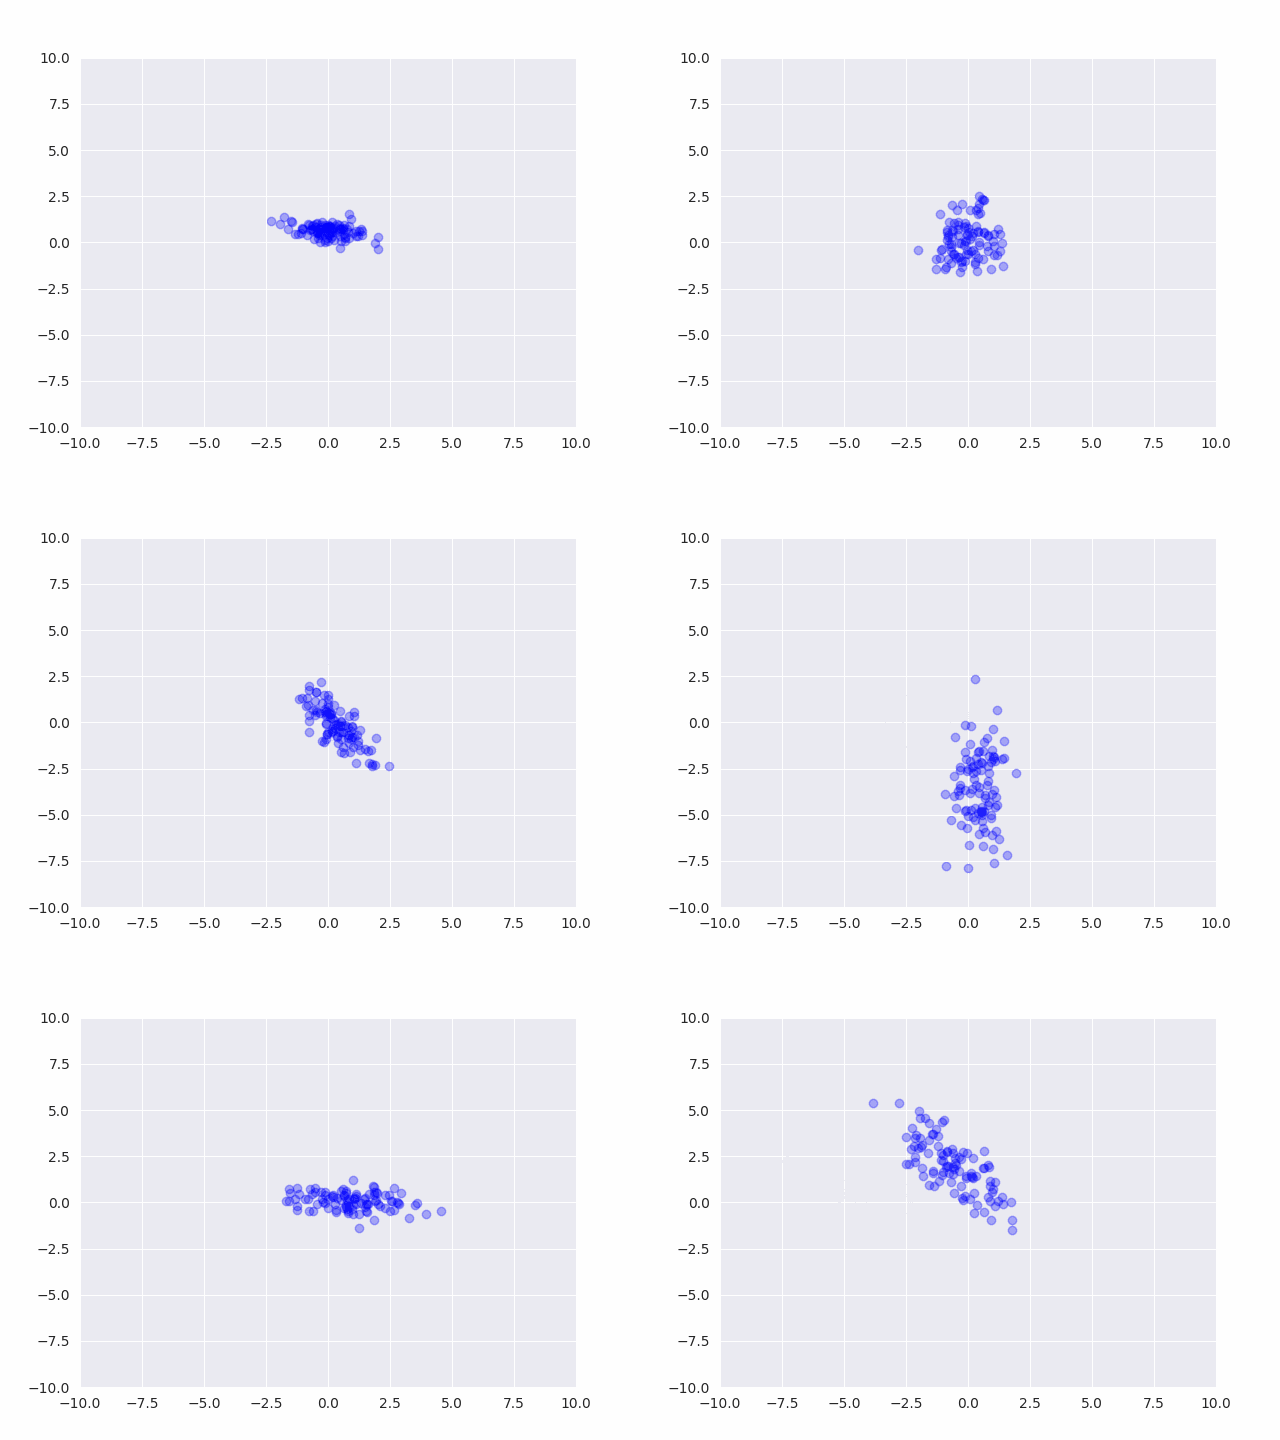
# 初期値からのサンプリング結果
# beta0が小さいせいで平均が時々大きく外れる
camera = Camera(plt.figure())
for _ in range(50):
    Sigma0 = invwishart(nu0, W0).rvs()
    mu0 = multivariate_normal(m0, Sigma0/beta0).rvs()
    x0 = multivariate_normal(mu0, Sigma0).rvs(100)
    plt.scatter(x0[:,0], x0[:,1], c="blue", alpha=0.3)
    plt.ylim(-10, 10)
    plt.xlim(-10, 10)
    camera.snap()
anim = camera.animate()
# anim.save('../output/prior_sampling.gif', writer=PillowWriter()) # 予め pip install Pillow しておく
クリックで再生↓

事前分布からサンプルを発生させると、平均も分散もバラバラなデータが発生する事がわかります。
パラメータの値を色々変えて実際にサンプリング結果を確認する事は、モデルの挙動を理解する上でとても大切です。
ベイズ更新
一括で更新してもつまらないので、データを1つずつ与えてパラメータを逐次で更新します。
与えるデータが増えるほど推定精度が上がっていく事が期待されます。
# 結果を格納するarray
m_result = np.zeros((T, 2))
beta_result = np.zeros(T)
nu_result = np.zeros(T)
W_result = np.zeros((T, 2, 2))

# 事後分布を元にパラメータを更新していく
def update(t, x, m_b, beta_b, nu_b, W_b):
    assert x.ndim == 2, print("x must be 2 dim")
    n = x.shape[0]
    # パラメータ更新
    beta_a = n + beta_b
    m_a = 1/ beta_a * (np.sum(x, axis=0) + beta_b * m_b)
    nu_a = n + nu_b
    W_a = x.T @ x + beta_b * np.outer(m_b, m_b) - beta_a * np.outer(m_a, m_a) + W_b
    # 格納
    m_result[t] = m_a
    beta_result[t] = beta_a
    nu_result[t] = nu_a
    W_result[t] = W_a

# ベイズ更新を実施
for t in range(T):
    if t == 0:
        update(t, x_data[t:t+1], m0, beta0, nu0, W0)
    else:
        update(t, x_data[t:t+1], m_result[t-1], beta_result[t-1], nu_result[t-1], W_result[t-1])
ベイズ推定結果の確認
ベイズ推定の結果がどうなったか、実際に図を描いて確認します。
モデル全体の確認
冒頭に定義した予測分布と推定したパラメータを用いて実際にサンプルを発生させます。
多変量t分布がnumpyやscipyにないので、自分で定義します。
def multivariate_t_rvs(m, S, df=np.inf, n=1):
    # from https://github.com/statsmodels/statsmodels/blob/master/statsmodels/sandbox/distributions/multivariate.py
    '''generate random variables of multivariate t distribution
    Parameters
    ----------
    m : array_like
        mean of random variable, length determines dimension of random variable
    S : array_like
        square array of covariance  matrix
    df : int or float
        degrees of freedom
    n : int
        number of observations, return random array will be (n, len(m))
    Returns
    -------
    rvs : ndarray, (n, len(m))
        each row is an independent draw of a multivariate t distributed
        random variable
    '''
    m = np.asarray(m)
    d = len(m)
    if df == np.inf:
        x = 1.
    else:
        x = np.random.chisquare(df, n)/df
    z = np.random.multivariate_normal(np.zeros(d),S,(n,))
    return m + z/np.sqrt(x)[:,None]   # same output format as random.multivariate_normal

# パラメータの事後分布をいい感じに見せられないので、モデルからデータをサンプリングして散布図をプロットする
# 最尤推定やMAP推定ではパラメータの推定値をデータが発生する分布に入れる事で予測分布を作るが、
# ベイズ推定の枠組みではパラメータの事後分布を周辺化する(積分する)事で、未知のデータに対する予測分布を作る
fig, ax = plt.subplots()
camera = Camera(fig)
for t in range(0, 1001, 50):
    S = (1 + beta_result[t]) / ((1 - 2 + nu_result[t]) * beta_result[t]) * W_result[t]
    x = multivariate_t_rvs(m_result[t], S, nu_result[t], 1000)
    ax.scatter(x_data[:,0], x_data[:,1], color="orange", alpha=0.1)
    ax.scatter(x[:,0], x[:,1], color="blue", alpha=0.05)
    ax.set_xlim(5, 15)
    ax.set_ylim(10, 30)
    ax.legend([f'iter {t}'])
    camera.snap()
anim = camera.animate(interval=1000, repeat=True)
anim.save('../output/posterior_sampling.gif', dpi=100, writer=PillowWriter()) # 予め pip install Pillow しておく
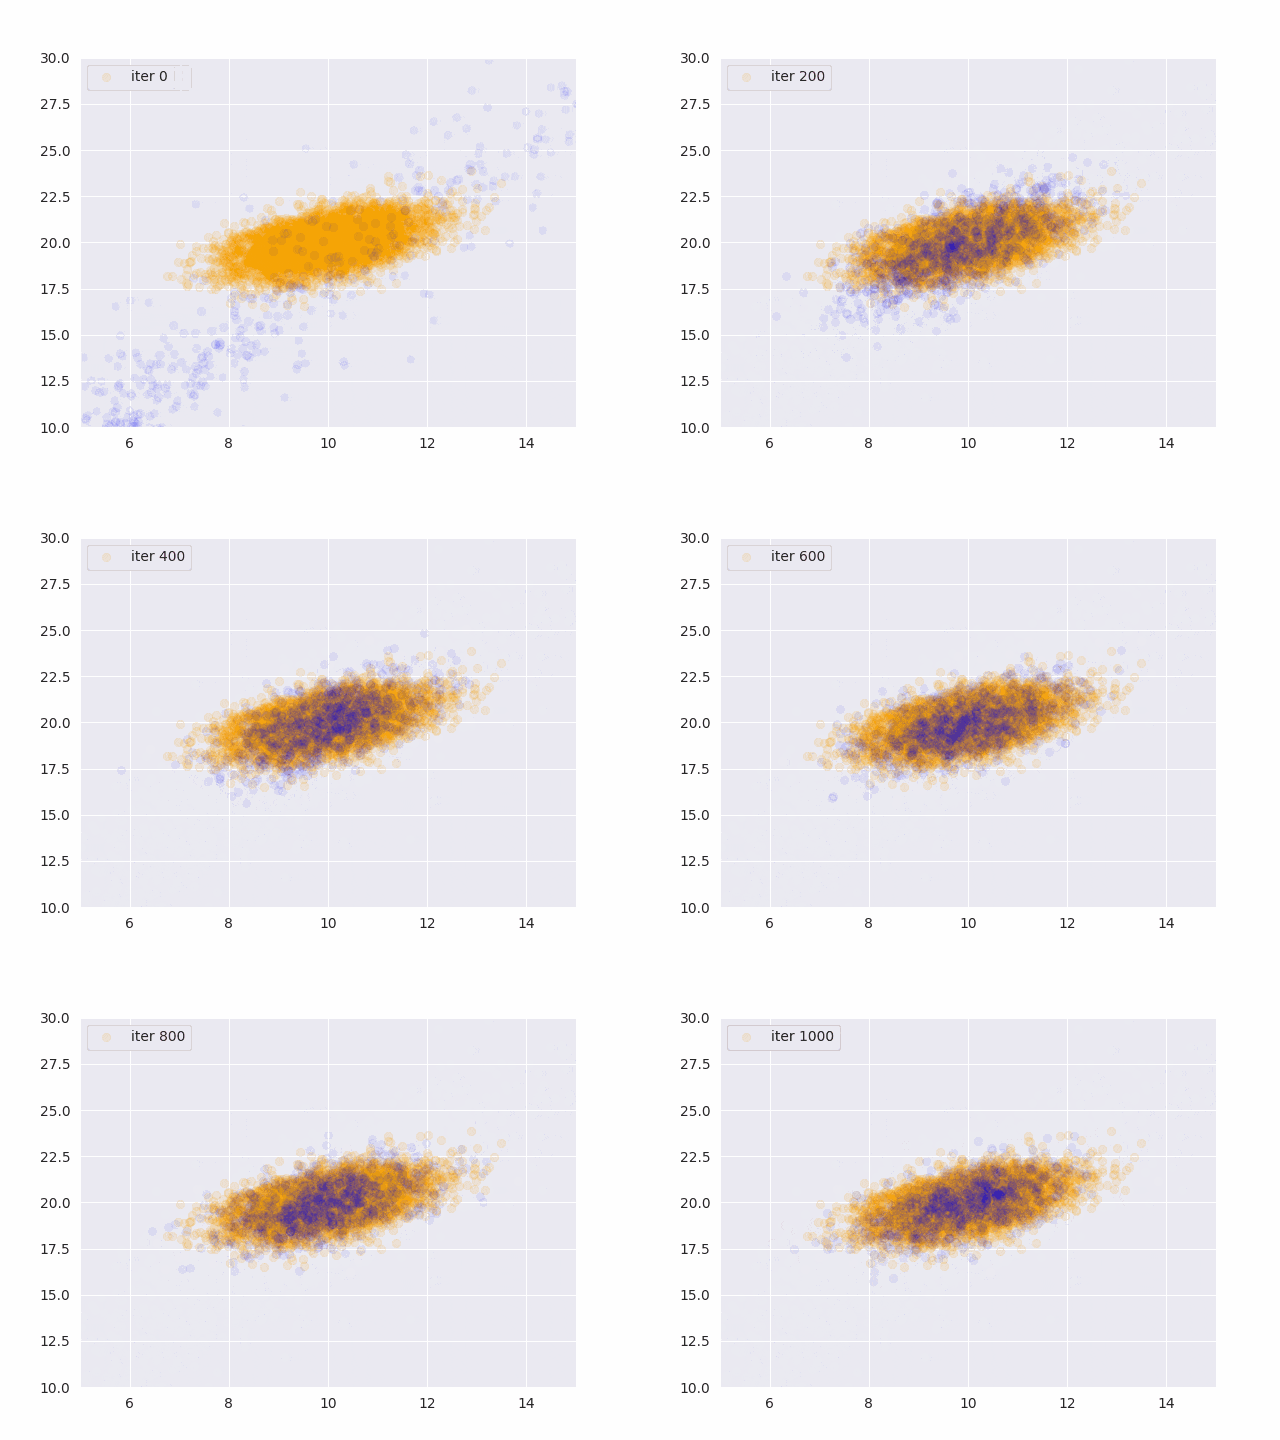
オレンジが真の分布から発生したデータ、青が推定したパラメータから発生したサンプルです。
更新データを増やす度に真の分布に近づいていることがわかります。
推定パラメータが真値と一致するか確認
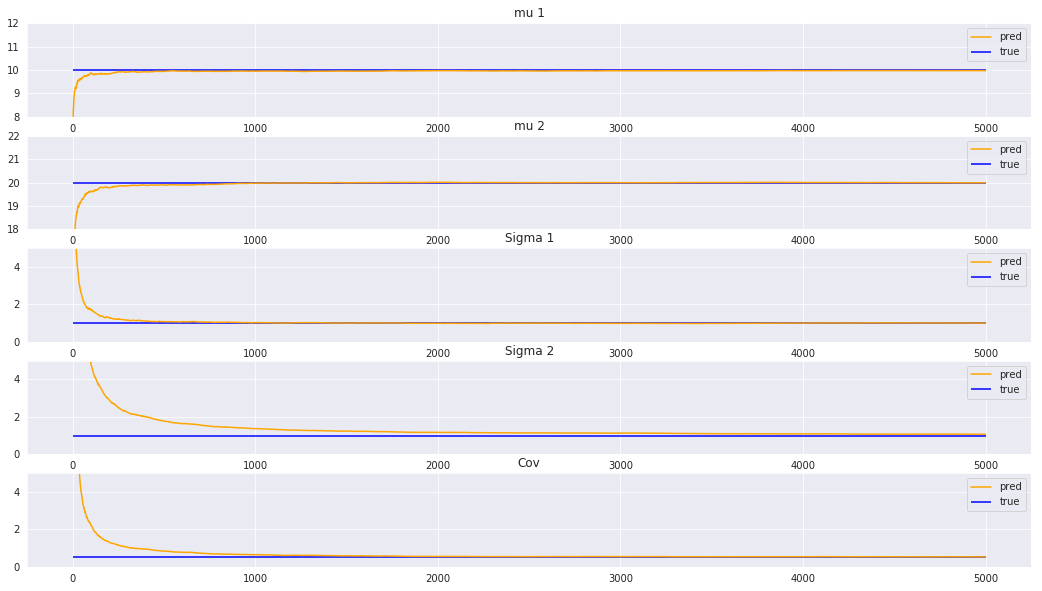
最後に、平均、分散パラメータが真値に収束しているかを確認します。
真値と予測値を比較したいのですが、ベイズ推定はパラメータの値ではなく分布を推定しているため、直接は比較できません。
そこで、MAP推定量を用いて、パラメータの事後分布からモデルの事後分布が最も大きくなるようなパラメータの値を取り出します。
パラメータの事後分布の平均を計算してしまうと、事後分布が左右非対称ではなかった場合に値が少しずれてしまいます。
\mu_{MAP} = \hat{m} \\
\Sigma_{MAP} = \frac{\hat{W}}{\hat{\nu} - D}
mu_plot = m_result
tmp = nu_result - 2
Sigma_plot = W_result / np.broadcast_to(tmp[:,np.newaxis,np.newaxis], W_result.shape)

%matplotlib inline

fig, axes = plt.subplots(nrows=5, figsize=(18, 10))
axes[0].plot(mu_plot[:,0], color="orange", label="pred")
axes[0].hlines(10, xmin=0, xmax=T, colors="blue", label="true")
axes[1].plot(mu_plot[:,1], color="orange", label="pred")
axes[1].hlines(20, xmin=0, xmax=T, colors="blue", label="true")
axes[2].plot(Sigma_plot[:,0,0], color="orange", label="pred")
axes[2].hlines(1, xmin=0, xmax=T, colors="blue", label="true")
axes[3].plot(Sigma_plot[:,1,1], color="orange", label="pred")
axes[3].hlines(1, xmin=0, xmax=T, colors="blue", label="true")
axes[4].plot(Sigma_plot[:,0,1], color="orange", label="pred")
axes[4].hlines(0.5, xmin=0, xmax=T, colors="blue", label="true")

axes[0].set_ylim(8, 12)
axes[1].set_ylim(18, 22)
axes[2].set_ylim(0, 5)
axes[3].set_ylim(0, 5)
axes[4].set_ylim(0, 5)
axes[0].set_title("mu 1")
axes[1].set_title("mu 2")
axes[2].set_title("Sigma 1")
axes[3].set_title("Sigma 2")
axes[4].set_title("Cov")
axes[0].legend(loc="upper right")
axes[1].legend(loc="upper right")
axes[2].legend(loc="upper right")
axes[3].legend(loc="upper right")
axes[4].legend(loc="upper right")
plt.show()
どのパラメータも上手く復元出来ています。
今回の設定では、平均より分散や共分散の方が復元しにくかったです。
まとめ
- ベイズ推定はパラメータの推定値やその不確実性を同時に推定できる
- ベイズ推定は、モデルの構築→事後分布の計算→予測分布を用いて予測、という流れ
- 多変量正規分布のベイズ推定をnumpyで実装した

