TL;DR
共変量が時変の生存時間分析を行いたい場合、離散時間ロジスティック回帰という手法を使うことが出来ます。
離散時間ロジスティック回帰の紹介と、stanによる実装を行います。
始めに
大学の成績の推移から、留年せずに卒業するための要因を推定したい、といった状況を考えます。
生徒$i$,学年$t$の成績を$X_{i,t}$、学年tで無事進級出来たかを$Y_{i,t}$と置きます。
進級に成功し続ける状態を「生存」と捉えると、これは生存時間分析の枠組みで捉えられます。
$X_{i,t}$が進級に与える要因の大きさは、学年によって大きく異なることが想定されます。例えば、1~2年生は単位が多少取れなくても後から挽回可能なので留年しづらく、3~4年生の成績は卒業要件を満たさなければならないため留年につながりやすい、といった状況が考えられます。
留年せずに卒業出来るか、という枠組みを考えるときにまず思い浮かぶのは、薬学などで用いられる比例ハザードモデルなどがあります。
しかし、比例ハザードモデルは共変量が時によって変化しないと仮定しているため、$X_{i,t}$が時と共に変化する場合はよく吟味する必要があります。
そこで、離散時間ロジスティック回帰モデルを使用します。
離散時間ロジスティック回帰モデル
生存時間分析では、生存関数$S(t)$(t期間以上生存する確率)とハザード関数$h(t)$(時点tまで生存したとして時点tで亡くなる確率)を以下のように定義します。
$$
S(t) = P(T>t) = \int_{x}^{\infty} f(t)dt \
h(t) = \lim_{\Delta \rightarrow \infty} \frac{P(t \leq T < t+\Delta t | T \geq t)}{\Delta t} \
$$
離散時間ロジスティック回帰モデルでは、ハザード関数を以下のように表します。
$$
h(x,t) = \frac{1}{1 + \exp(-z(x,t))} \
z(x,t) = \alpha + \beta_t * X_{t} \
$$
これは、通常のロジスティック回帰と同じものになります。
$\beta_t$は時点による共変量の効き具合の差を表します。
z(x,t)の関数の形は、状況に応じてよしなに変えてください。
stanの実装例
ユーザーが毎時点、複数の選択肢の中から1つを選び続けることを想定します。
どの選択肢が一番離脱を防止するか、選択肢による効果が時点でどう変わるかを推定します。
モデル
stan_code = '''
// 参考: https://www.slideshare.net/akira_11/dt-logistic-regression
data {
  int T_max;
  int ST;
  int C;
  int X_T[ST];
  matrix[ST, C] X_score;
  int Y[ST];
}

parameters {
  matrix[T_max, C-1] beta;
  real alpha; // 定数項
}

model {
  vector[ST] zeros = rep_vector(0.0, ST); // 係数推定時に、0に固定するためのベクトル
  vector[C] ones = rep_vector(1.0, C); // 列に対して和をとるための行列
  vector[ST] mu = alpha + (X_score .* append_col(zeros, beta[X_T, :])) * ones; // 離脱確率ベクトル

  for (st in 1:ST) {
    target += bernoulli_logit_lpmf(Y[st] | mu[st]); // 離脱を予測する2値分類モデル
  }
}
'''
仮想データ生成
def logistic_func(array):
    """-∞~∞の入力値をlogistic functionに則って[0,1]に変換して返す"""
    return 1/(1+np.exp(-array))

# データの生成, 右打ち切りにする
S = 10000
C = 3
alpha = -1 # logistic関数掛ける前のデフォルトの離脱率、これで約20%くらい
T_max = 6
beta = np.array([[0,i,j] for i, j in zip(list(range(-3, 3)), list(range(-3, 3))[::-1])]) * 0.2 # Rに合わせて列を増やすこと, 係数の効き具合は最後の値で調整
stan_dict = dict()
stan_dict["T_max"] = T_max
stan_dict["C"] = C
stan_dict["class"] = list()
stan_dict["rate"] = list()
stan_dict["X_T"] = list()
stan_dict["X_score"] = list() # これは中にarrayを格納するので注意
stan_dict["Y"] = list()
stan_dict["S"] = list() # デバッグ用

for s in range(S):
    idx = 0

    class_ = np.random.choice(list(range(C)), size=1)[0]
    x_score = np.zeros((C))
    x_score[score] = 1.0
    rate = logistic_func(alpha+beta[idx,score])

    stan_dict["class"].append(score)
    stan_dict["rate"].append(rate)
    stan_dict["X_T"].append(idx+1)
    stan_dict["X_score"].append(x_score)

    while True: # 生存判定
        if int(np.random.binomial(n=1, p=rate, size=1)):
            y = 1
            stan_dict["Y"].append(y)
            stan_dict["S"].append(idx+1)
            break
        elif idx >= T_max-1: # 一定以上になったら打ち切り
            y = 0
            stan_dict["Y"].append(y)
            stan_dict["S"].append(idx+1)
            break
        y = 0
        stan_dict["Y"].append(y)
        idx += 1
        score = np.random.choice(list(range(R)), size=1)[0]
        x_score = np.zeros((R))
        x_score[score] = 1.0
        rate = logistic_func(alpha+beta[idx,score])

        stan_dict["class"].append(score)
        stan_dict["rate"].append(rate)
        stan_dict["X_T"].append(idx+1)
        stan_dict["X_score"].append(x_score)
betaの真の値はこのように設定しました。

真ん中の選択肢は序盤に選ぶと生存率を高めますが、終盤は真ん中の選択肢より右の選択肢を選んだ方が生存率が上がります。
推定
# stanに与えるデータの後処理
stan_dict["ST"] = np.sum(stan_dict["S"])
stan_dict["X_score"] = np.array(stan_dict["X_score"])

# モデル立てて推論
sm = pystan.StanModel(model_code = stan_code)
fit = sm.sampling(stan_dict, iter=1000, chains=4)
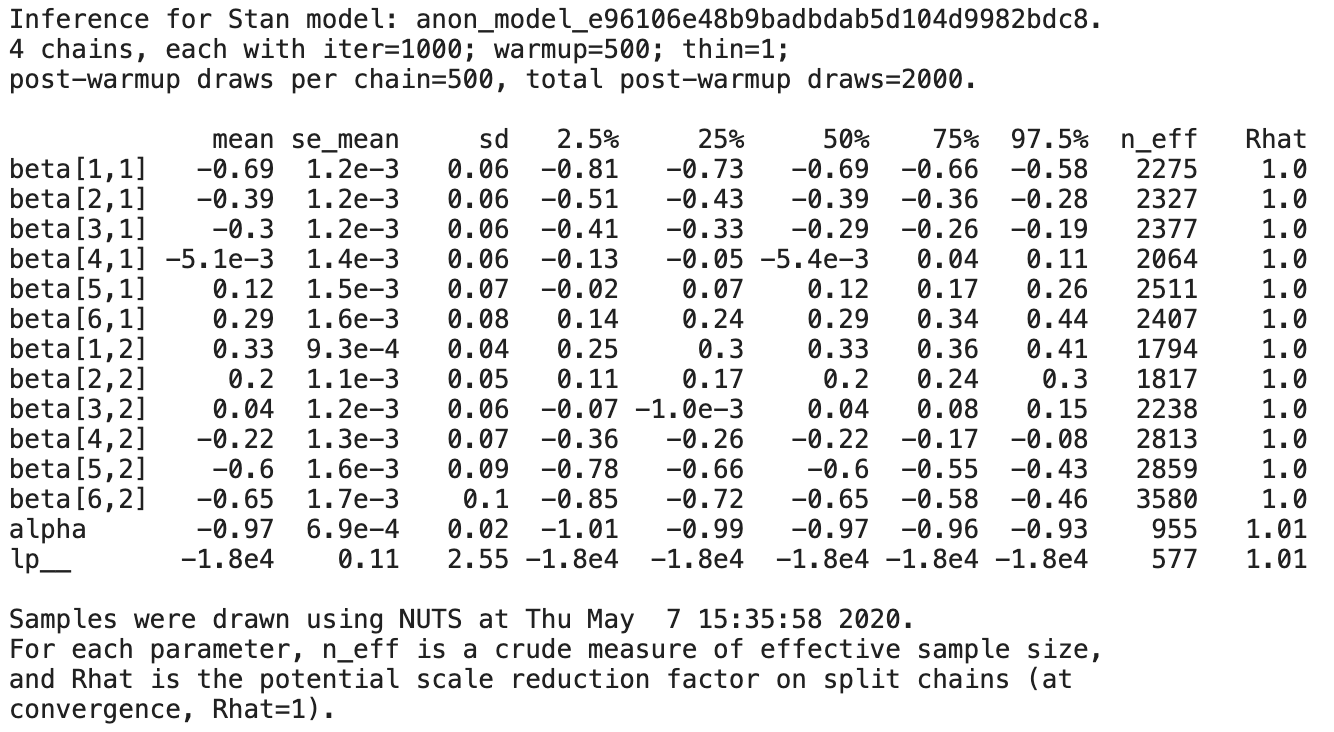
print(fit)

Rhatが1.1を超えていないので収束していそうです。
結果の確認
大体近い値になりました。ただし、生存期間の後半の方が推定精度が悪くなっています。
参考

