fig, ax = subplotsについて
目的図
富士下山問題にて
いつもpltを使用していたためグラフの数が膨大となるが、この様な表示に挑戦
やり方 コード
イメージはfigと名前をつけたキャンパスにaxと名前をつけた図を配列で書いていくイメージ
figsize等は変更したほうが綺麗
軸共有とかもっと綺麗にする方法は無限にありそうだけれども、視覚的にわかる様に今回は記載
使い分け大事
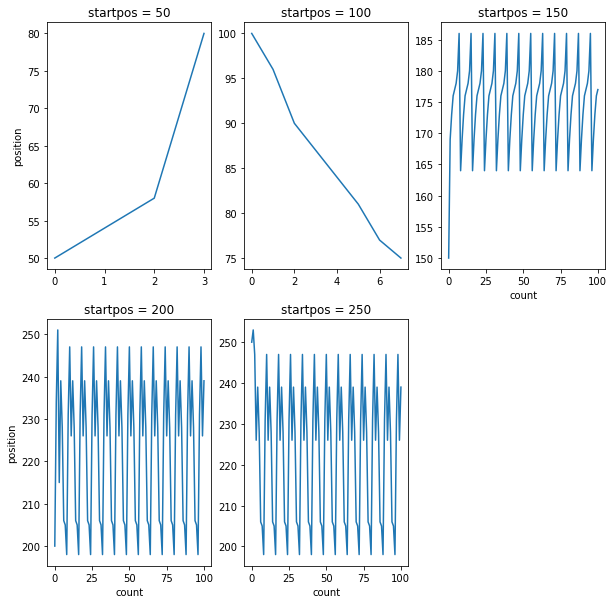
fig, ax = plt.subplots(2, 3, figsize=(10,10))
ax[0, 0].plot(c_test1, p_test1)
ax[0, 1].plot(c_test2, p_test2)
ax[0, 2].plot(c_test3, p_test3)
ax[1, 0].plot(c_test4, p_test4)
ax[1, 1].plot(c_test5, p_test5)
ax[1, 2].axis('off') # 使用していない領域の削除

ax[0, 0].set_title("startpos = 50")
ax[0, 1].set_title("startpos = 100")
ax[0, 2].set_title("startpos = 150")
ax[1, 0].set_title("startpos = 200")
ax[1, 1].set_title("startpos = 250")

ax[0, 2].set_xlabel('count')
ax[1, 0].set_xlabel('count')
ax[1, 1].set_xlabel('count')

ax[0, 0].set_ylabel('position')
ax[1, 0].set_ylabel('position');