to_graphvizメソッド
xgboostにはto_graphvizのメソッドによって作成された木を可視化することができる。
しかしそのグラフのノードには変数名でなく、"f0"や"f1"のように表示されてしまい、これらを照らし合わせながら分析するのは少々煩わしい。
plot_importanceには変数名をkey、そのfeature_importanceをvalueにもつ辞書を渡せば"f1"などと表示されてしまう問題は解決できたのだが、どうやらto_graphvizにはないらしい。
そこでXgboost.poltting.pyの中身をのぞいて"f1"などを変数の名前に置き換えられる関数を作成した。
@DaigoKimuraさんの指摘を受けて修正しました。(2018.12.14)
ありがとうございます!
tree_plot.py
import re
from graphviz import Digraph

_NODEPAT = re.compile(r'(\d+):\[(.+)\]')
_LEAFPAT = re.compile(r'(\d+):(leaf=.+)')
_EDGEPAT = re.compile(r'yes=(\d+),no=(\d+),missing=(\d+)')
_EDGEPAT2 = re.compile(r'yes=(\d+),no=(\d+)')

def _parse_node(graph, text):
    match = _NODEPAT.match(text)
    if match is not None:
        node = match.group(1)
        graph.node(node, label=match.group(2), shape='circle')
        return node
    match = _LEAFPAT.match(text)
    if match is not None:
        node = match.group(1)
        graph.node(node, label=match.group(2), shape='box')
        return node
    raise ValueError('Unable to parse node: {0}'.format(text))

def _parse_edge(graph, node, text, yes_color='#0000FF', no_color='#FF0000'):
    """parse dumped edge"""
    try:
        match = _EDGEPAT.match(text)
        if match is not None:
            yes, no, missing = match.groups()
            if yes == missing:
                graph.edge(node, yes, label='yes, missing', color=yes_color)
                graph.edge(node, no, label='no', color=no_color)
            else:
                graph.edge(node, yes, label='yes', color=yes_color)
                graph.edge(node, no, label='no, missing', color=no_color)
            return
    except ValueError:
        pass
    match = _EDGEPAT2.match(text)
    if match is not None:
        yes, no = match.groups()
        graph.edge(node, yes, label='yes', color=yes_color)
        graph.edge(node, no, label='no', color=no_color)
        return
    raise ValueError('Unable to parse edge: {0}'.format(text))

def to_graphviz(XGB,X_cols,num_trees=0):
    tree = XGB._Booster.get_dump()[num_trees]
    yes_color = "red"
    no_color = "blue"
    for i,col in enumerate(X_cols):
        tree = tree.replace('f{0}'.format(i),col)
    tree = tree.split()
    graph = Digraph()
    for i, text in enumerate(tree):
        if text[0].isdigit():
            node = _parse_node(graph, text)
        else:
            if i == 0:
                # 1st string must be node
                raise ValueError('Unable to parse given string as tree')
            _parse_edge(graph, node, text, yes_color=yes_color,no_color=no_color)
    return graph

def plot_tree(XGB,X_cols,num_trees=0,ax=None):
    if ax is None:
        _,ax = plt.subplots(figsize=(25, 25))

    g = to_graphviz(XGB,X_cols,num_trees=num_trees)

    s = BytesIO()
    s.write(g.pipe(format='png'))
    s.seek(0)
    img = image.imread(s)

    ax.imshow(img)
    ax.axis('off')
    return ax
xgboost.plottingの必要なところをコピペしてきて、to_graphvizとplot_treeの内容を少々変更。
僕はプロットさえできれば十分なので、argsは省略して色は青と赤に設定。
*変数名に空白があると動かないので注意
tree_plot.plot_treeの引数XGBはxgboost.XGBClassifierもしくはXGBRegressorオブジェクト。
X_colsは変数名の入ったリストで、num_treesは本家と同様、何番目の木をプロットするか。
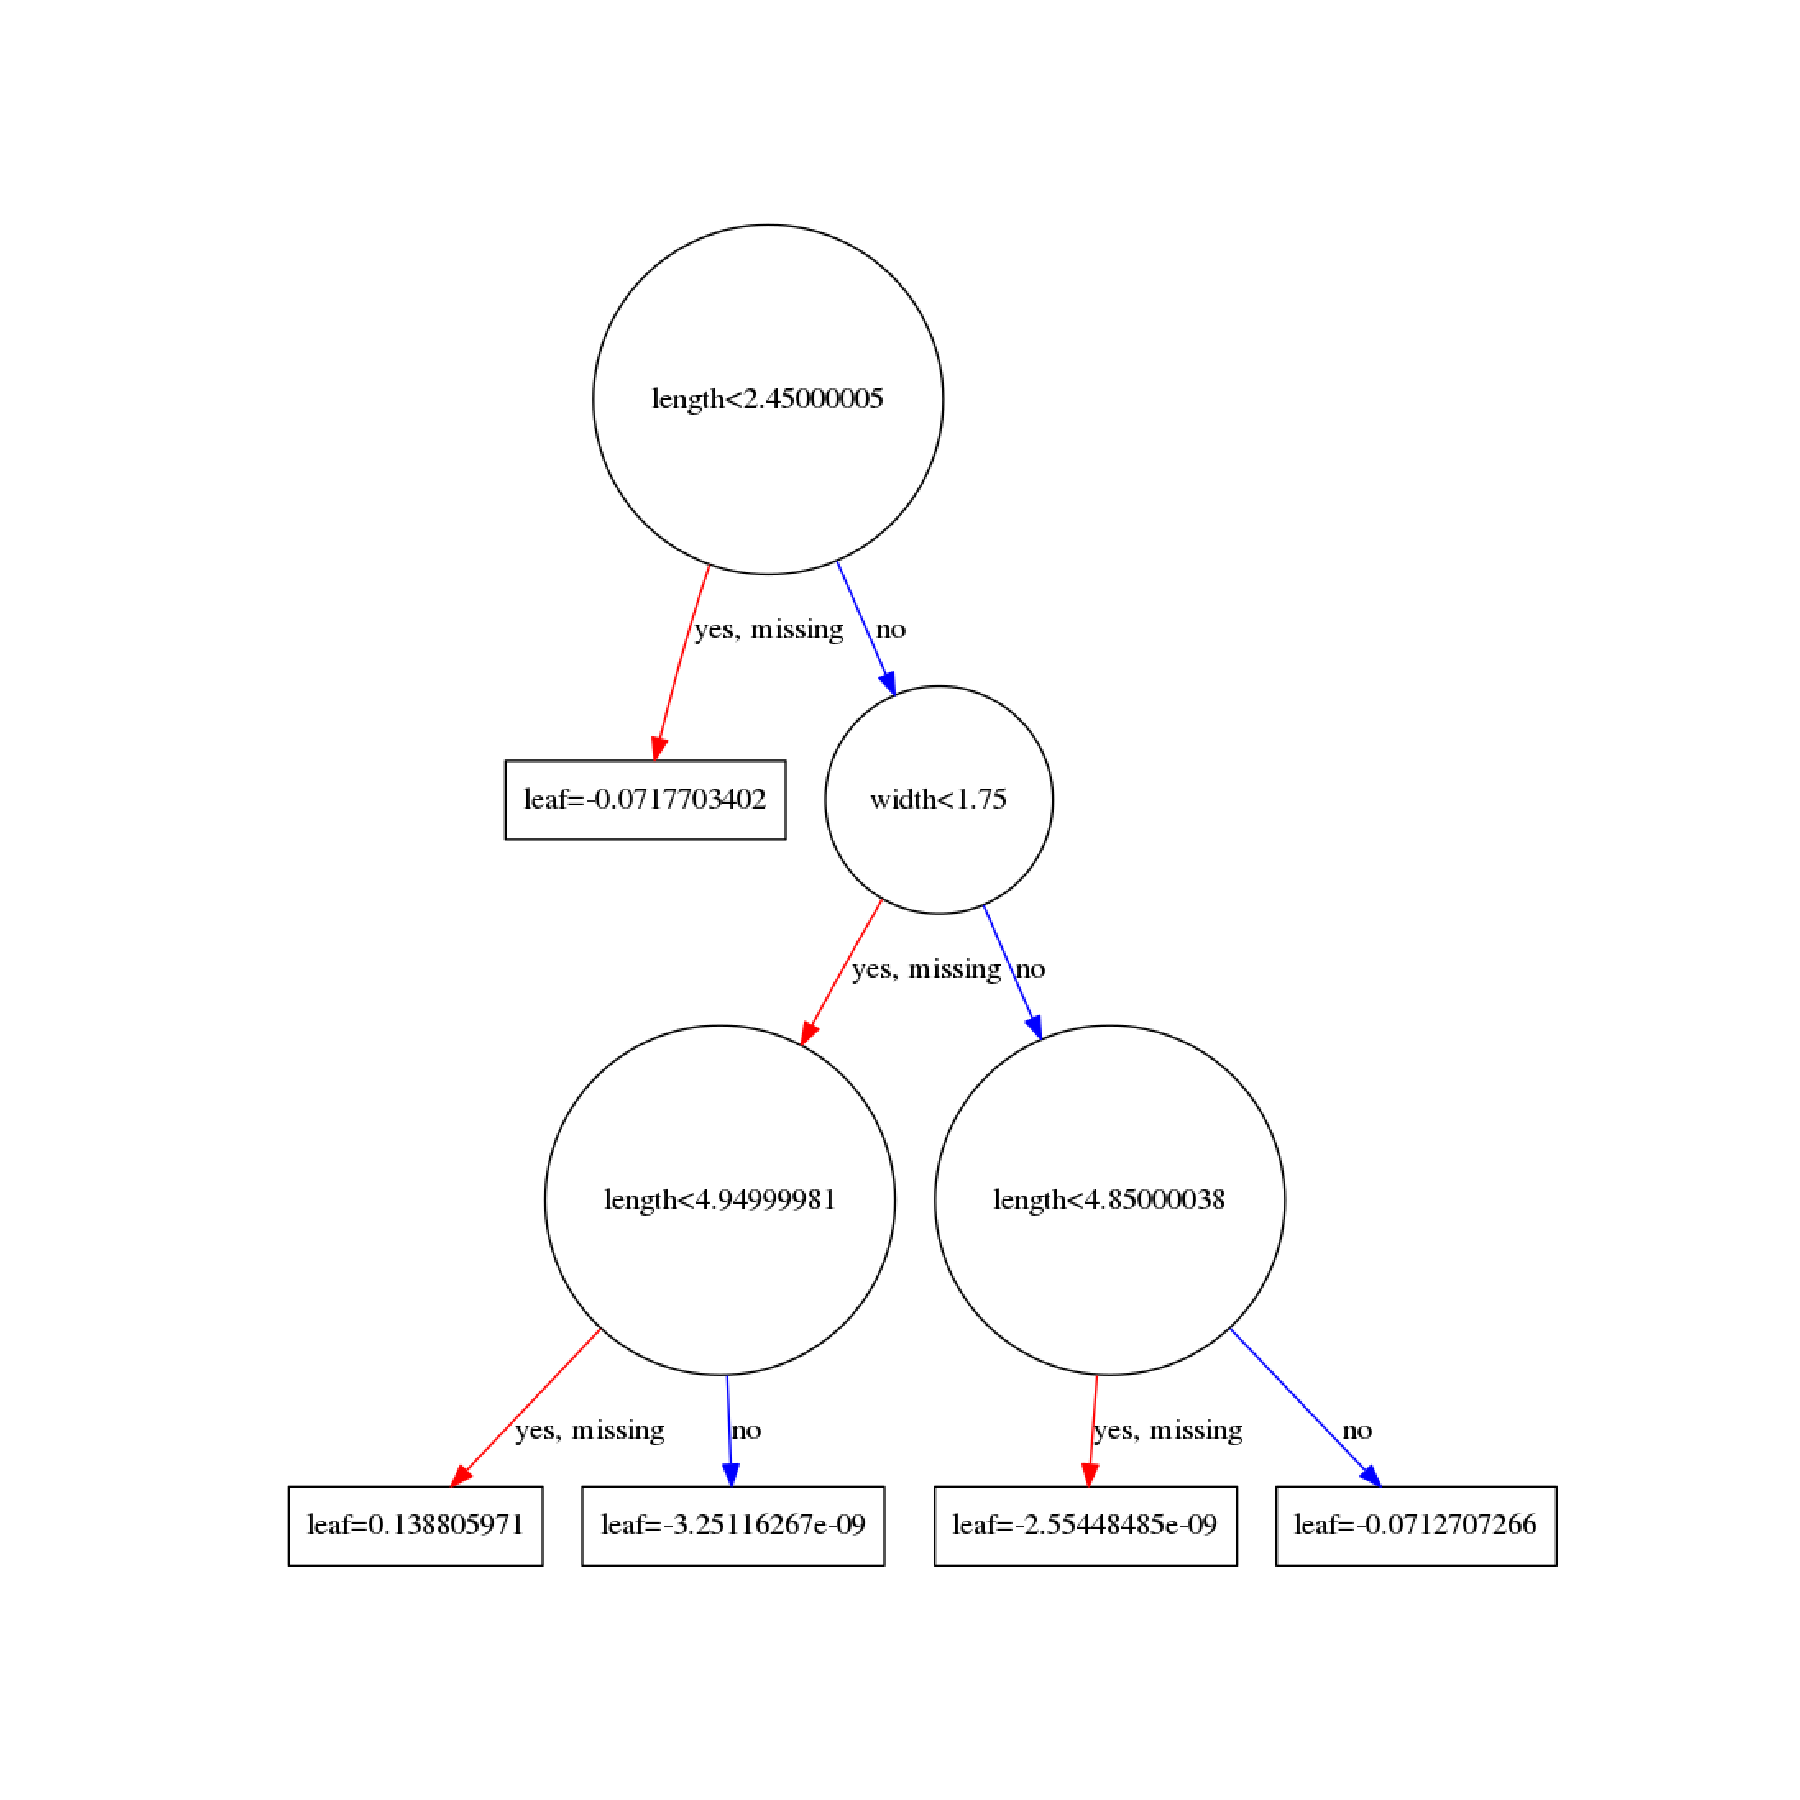
以下のように実行するとちゃんとノードの中に変数名が表示される。
main.py
import xgboost as xgb
import matplotlib.pyplot as plt
import sklearn.datasets as sk_data
import tree_plot
%matplotlib inline

X,y,X_cols = sk_data.load_iris()["data"],sk_data.load_iris()["target"],sk_data.load_iris()["feature_names"]
# str.split()を用いるため変数名に空白があるとエラーが出る
X_cols = [i[6:-5] for i in X_cols]

XGB = xgb.XGBClassifier()
XGB.fit(X,y)

tree_plot.plot_tree(XGB,X_cols,num_trees=1)
plt.savefig("plot_tree.png",format="png")
plt.close()