はじめに
いま話題のかんたん機械学習ライブラリのPycaretをPower BI上で使用してみます。

Pythonの環境セットアップ
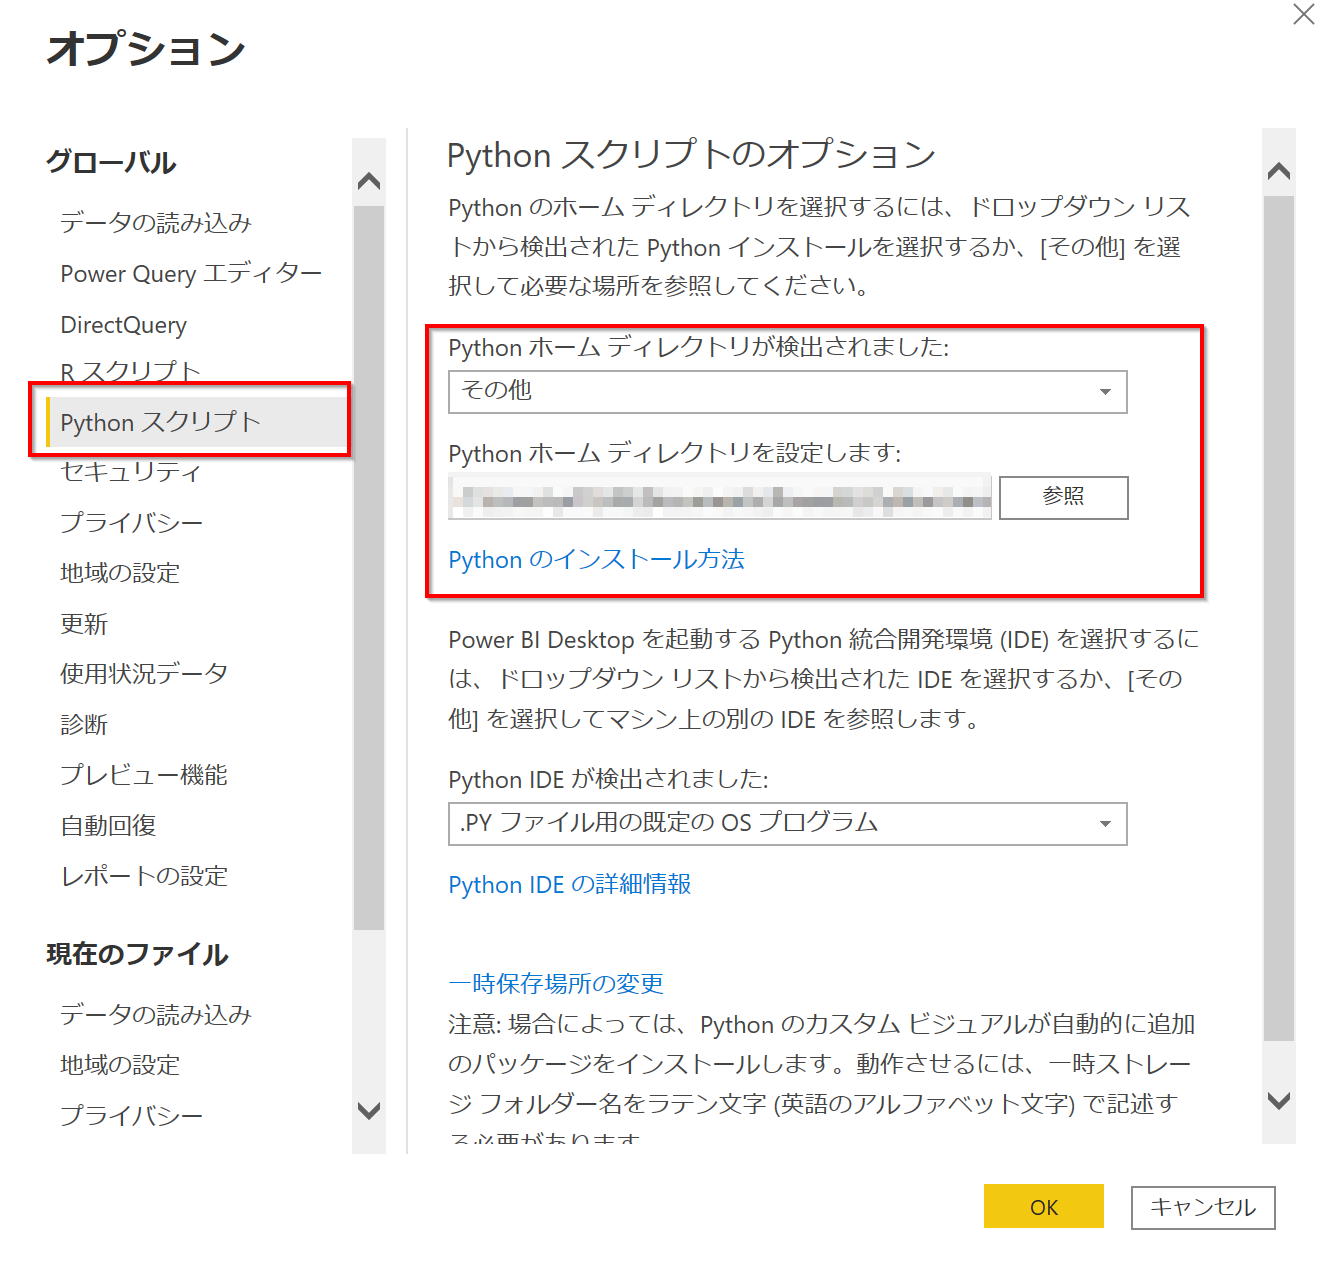
Power BI DesktopでPythonを使用できるように設定します。環境はPower BI用に構築するのがいいと思います。
https://docs.microsoft.com/ja-jp/power-bi/connect-data/desktop-python-scripts
anacondaを使用している場合
下記のように指定すればOKでした。
C:\Anaconda3\envs\"環境名"
venvを使用している場合
こちらは下記のようにScriptフォルダーを指定すればOKでした。
C:\Users\PowerBI_Python\venv\Scripts
サンプルデータ
Pycaretが用意してくれているファイルを使用します。
サンプルデータ/Jewelry
https://raw.githubusercontent.com/pycaret/pycaret/master/datasets/jewellery.csv
Webから取得
データを取得 -> WEB

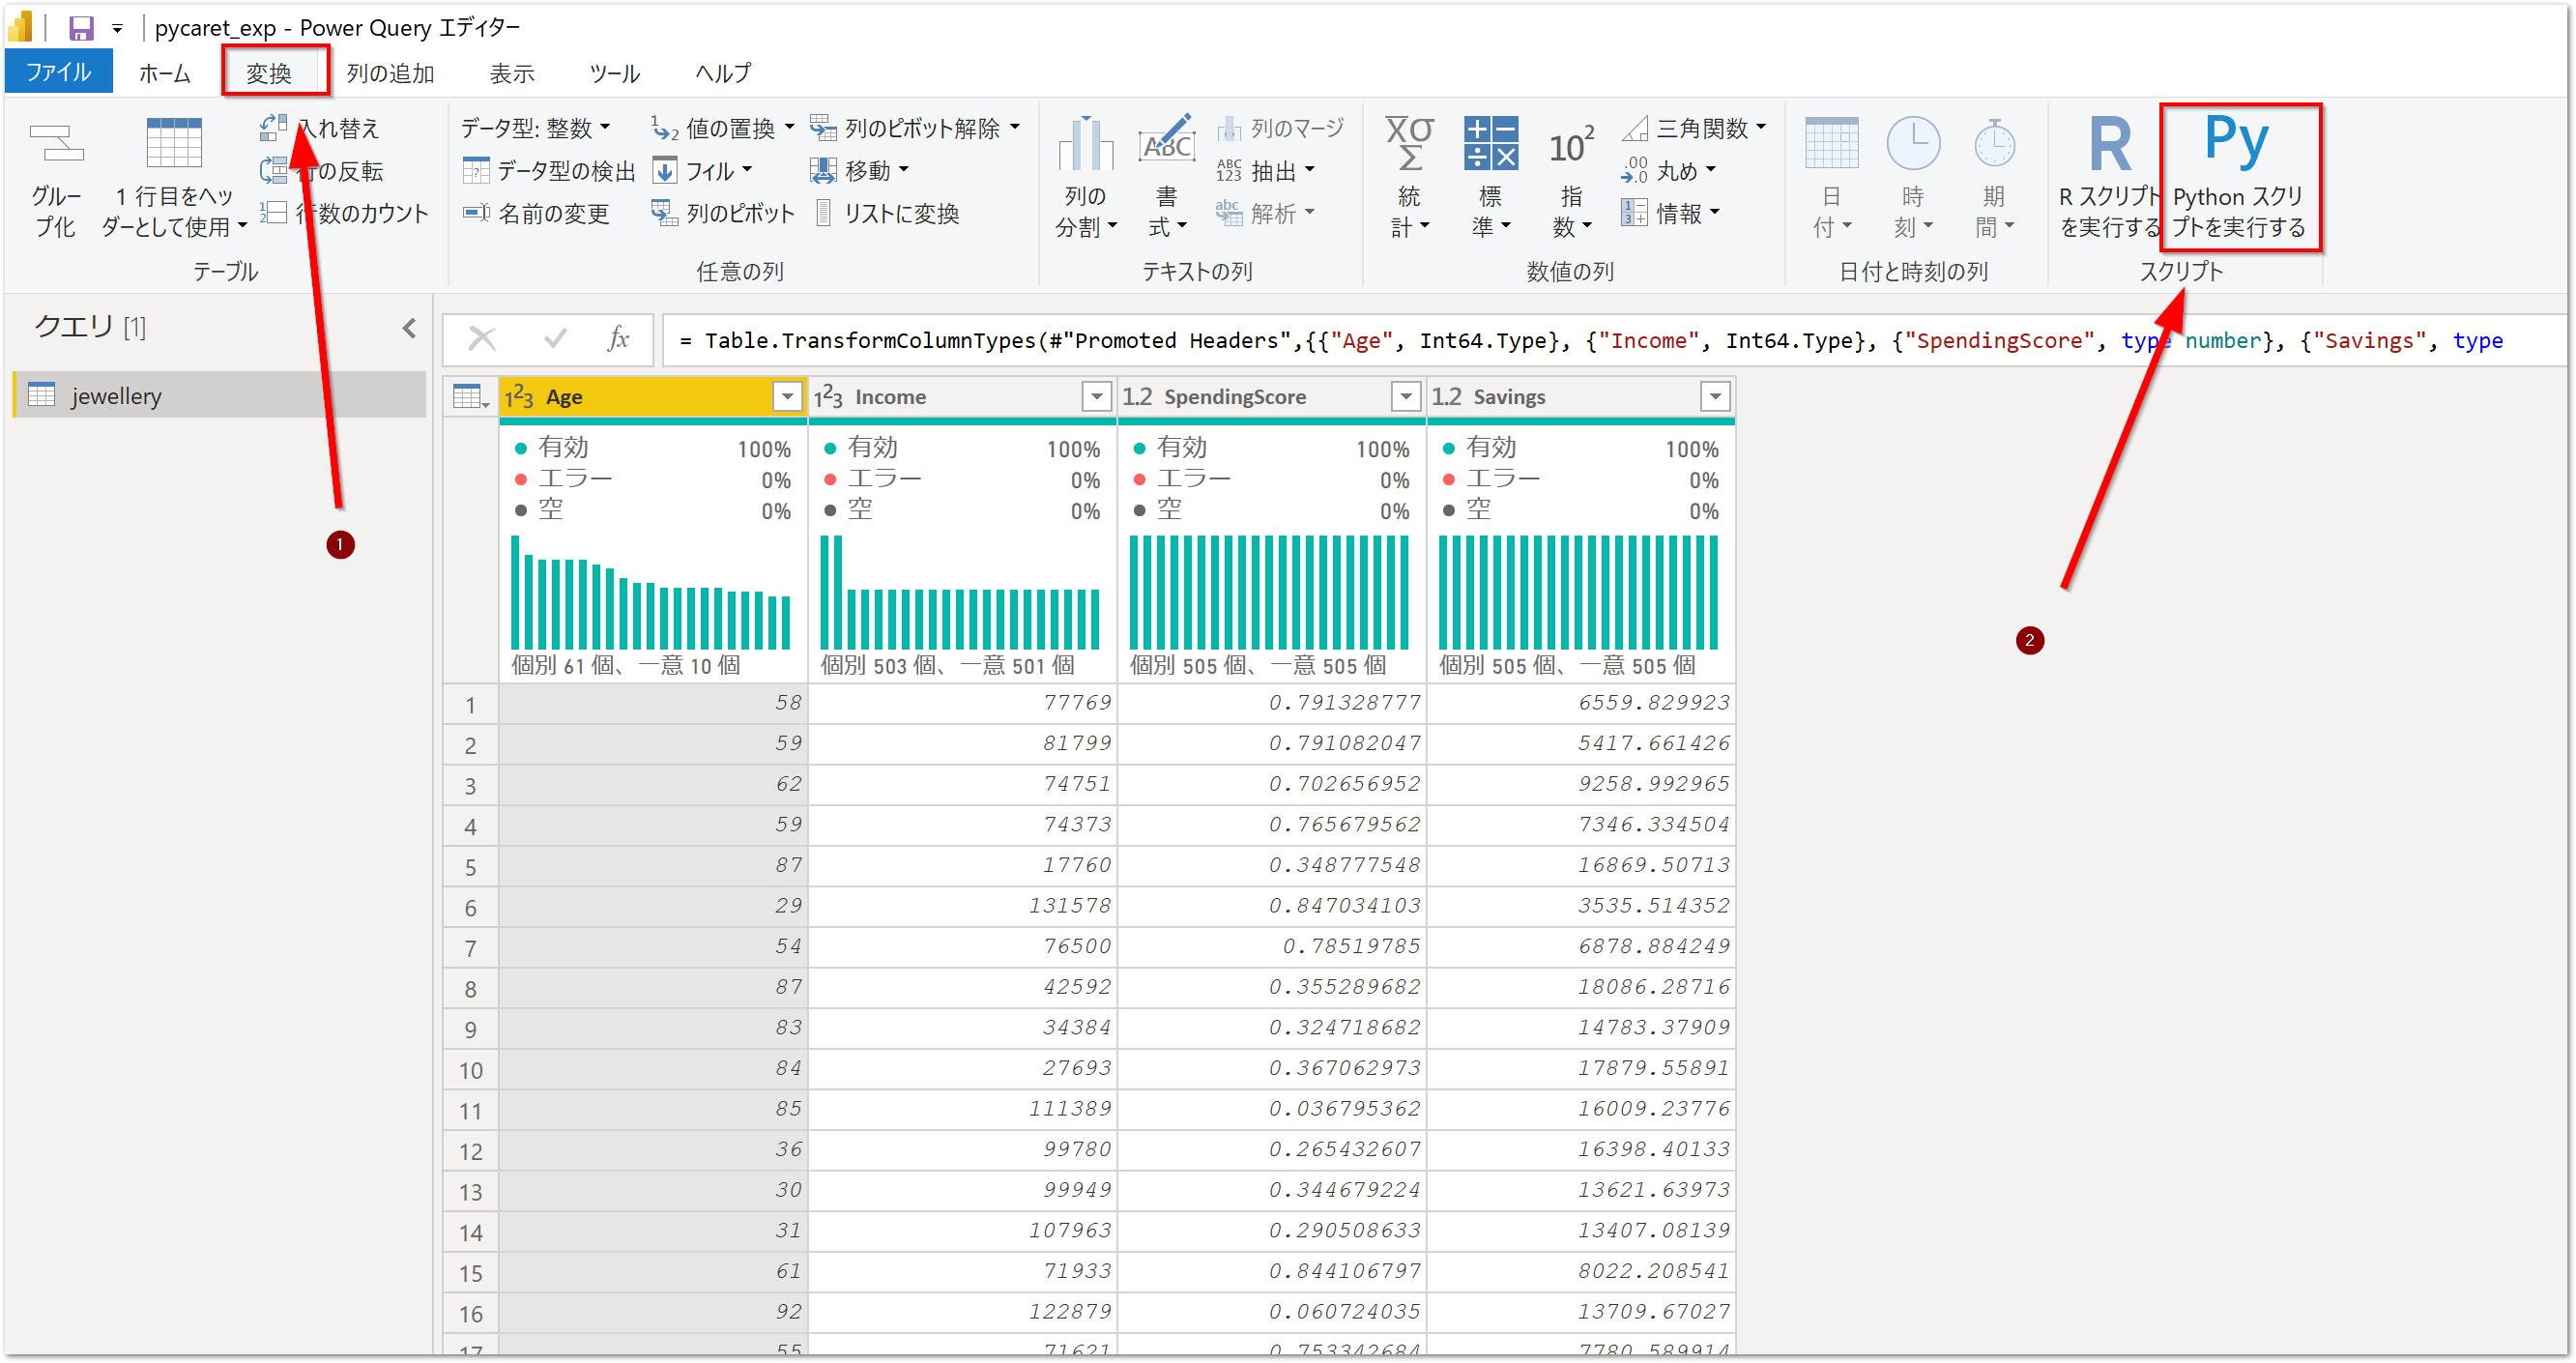
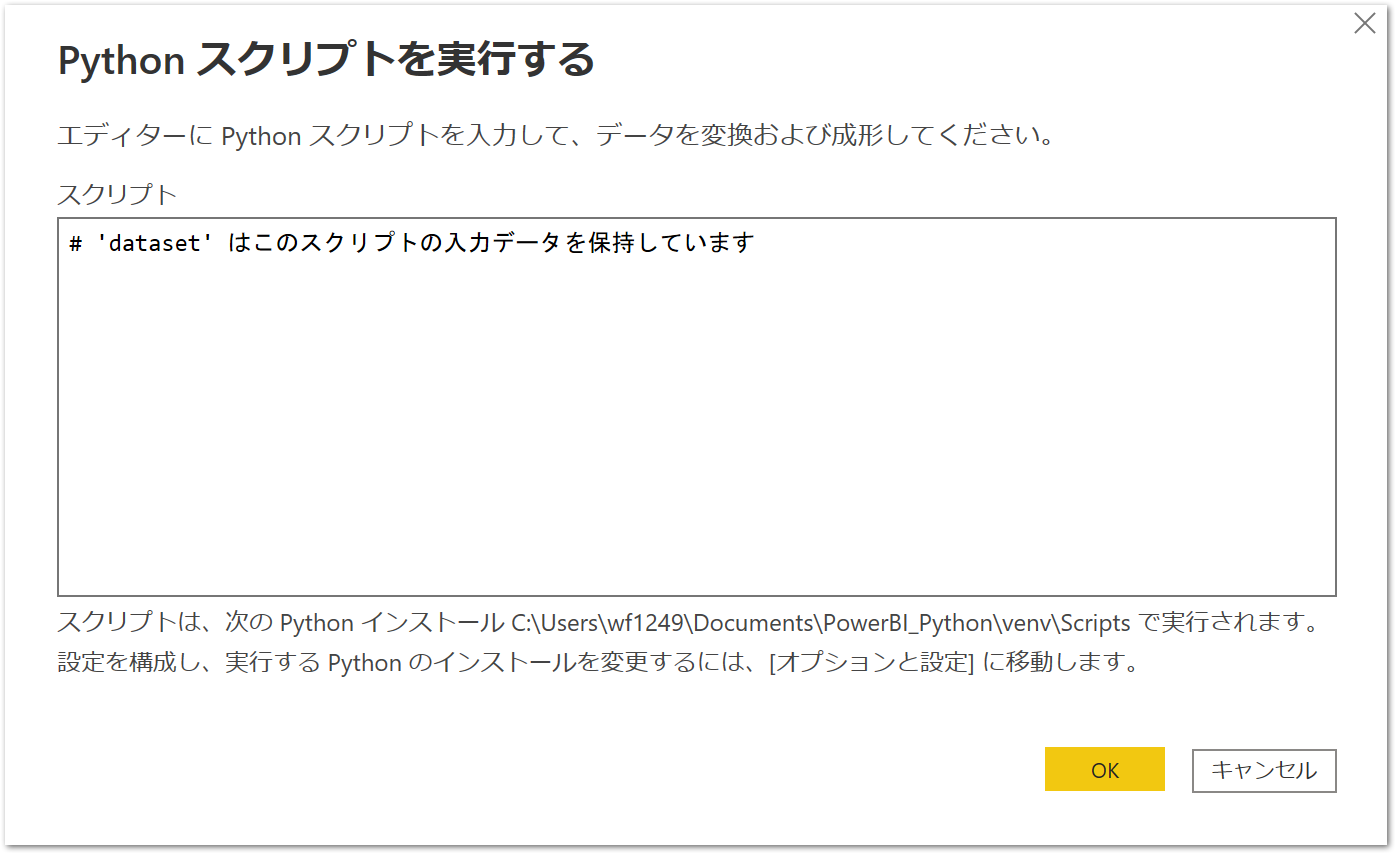
Pythonコードを記述
# 'dataset' はこのスクリプトの入力データを保持しています
と書いてある入力ボックスが出てきます。
先ほどとりこんだデータはdatasetという変数名でpandas.DataFrameになっています。
Pycaretでクラスタリングをする
ここまできたら、Pycaretでクラスタリングをするコードを記述します。クラスタリングモジュールをインポートしたあとに、最低限ではありますが、1行記述するだけでOKです。
from pycaret.clustering import *
dataset = get_clusters(data = dataset)
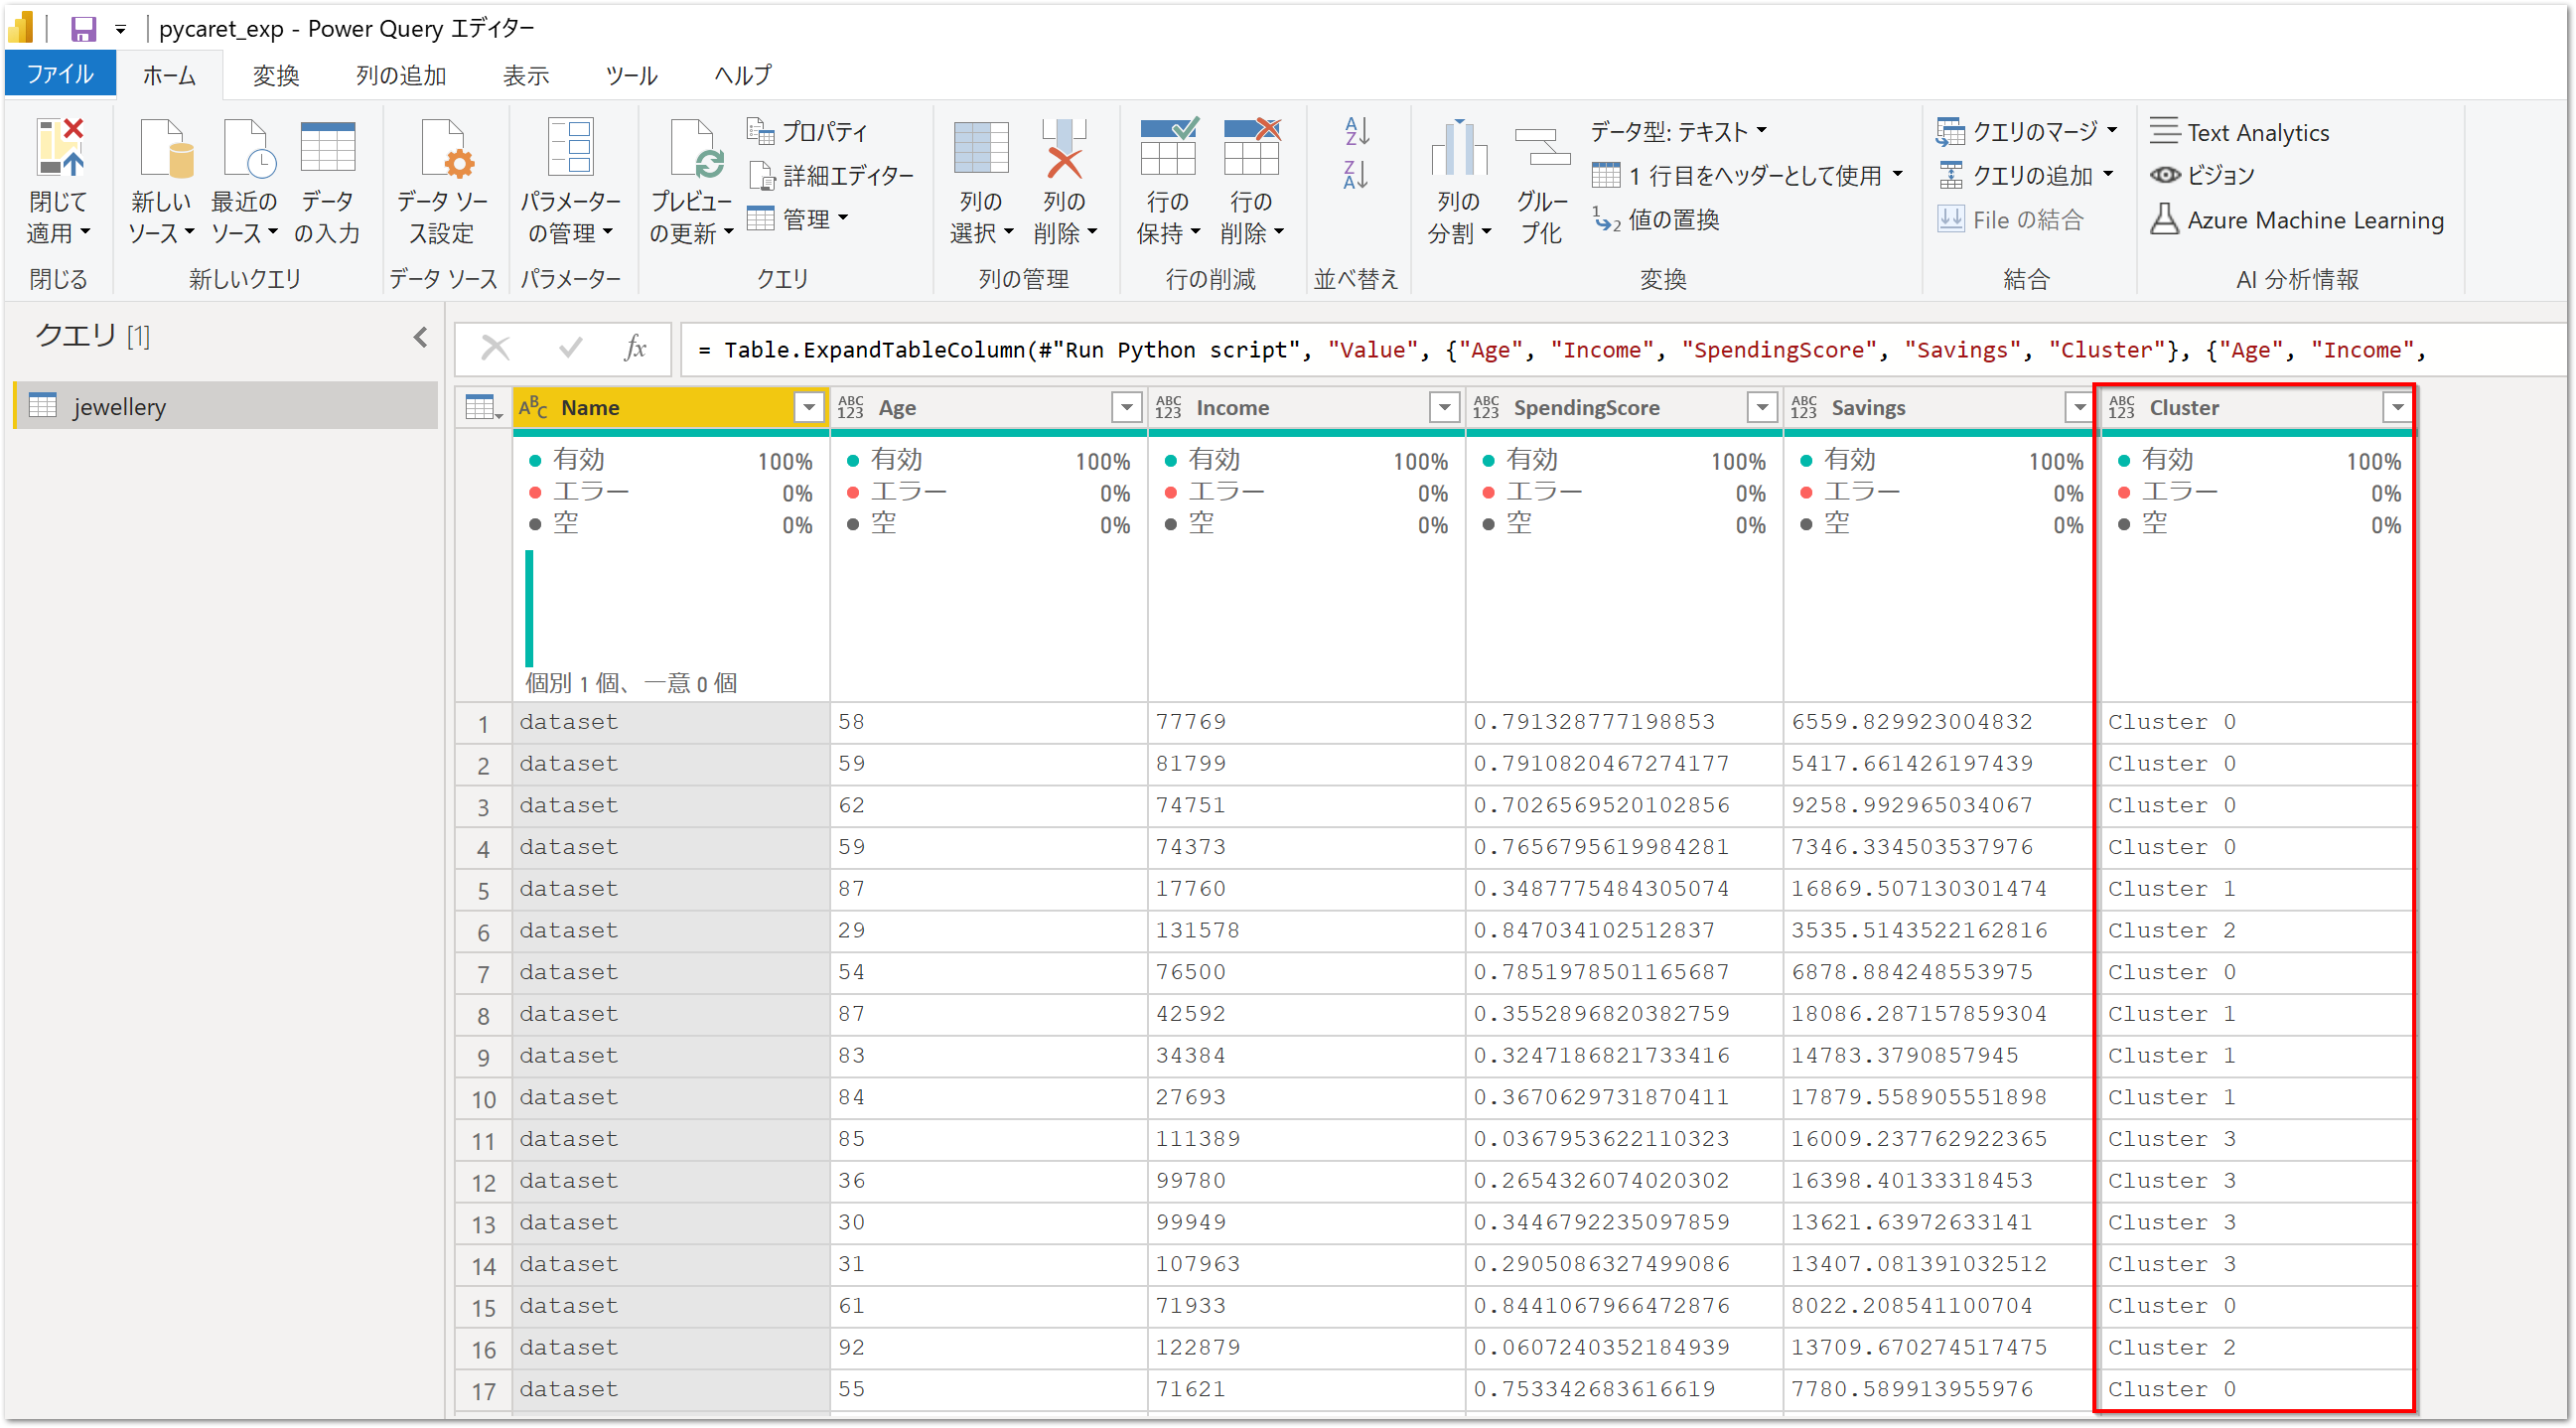
このコードを記述して、OKボタンをおせばクラスタリングが実行されます。
Cluster列が作成されました。
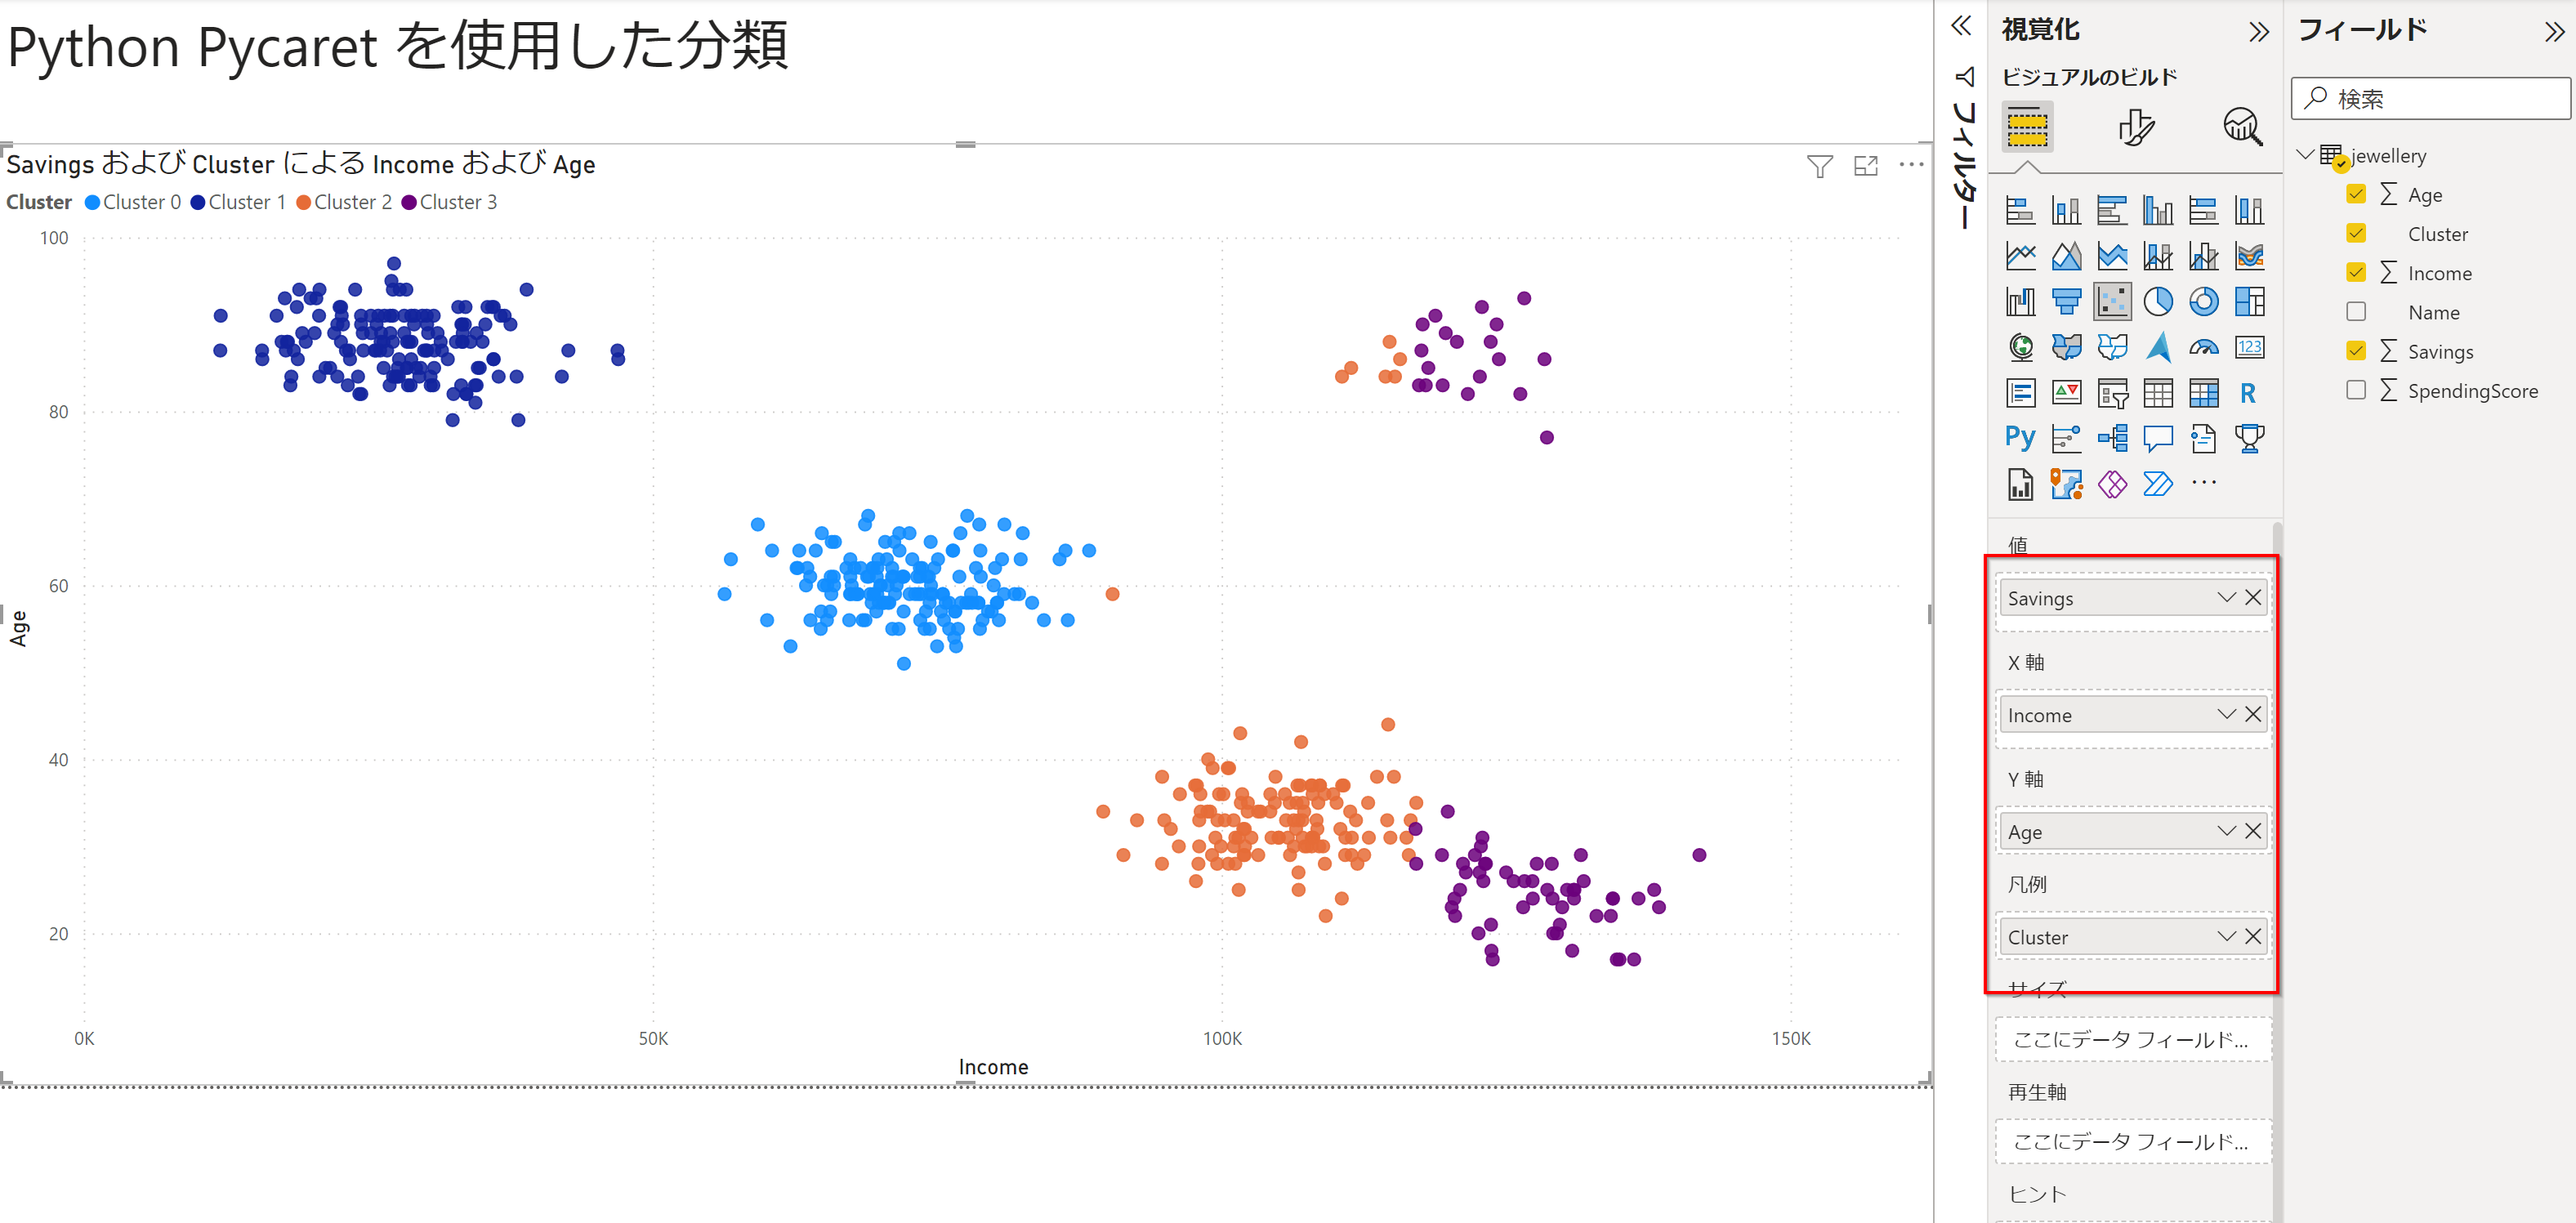
散布図を作成する
凡例にクラスターをいれるときれいに色分けされます。
Pycaretのデフォルト設定を調べる
get_clusters()はデフォルトでは、
- モデルはk-means
- クラスター数は4
となっています。
設定可能な項目一覧
https://pycaret.readthedocs.io/en/latest/api/clustering.html#pycaret.clustering.get_clusters
pycaret.clustering.get_clusters(
    data,
    model: Union[str, Any] = 'kmeans',
    num_clusters: int = 4,
    ground_truth: Optional[str] = None,
    round: int = 4,
    fit_kwargs: Optional[dict] = None,
    preprocess: bool = True,
    imputation_type: str = 'simple',
    iterative_imputation_iters: int = 5,
    categorical_features: Optional[List[str]] = None,
    categorical_imputation: str = 'mode',
    categorical_iterative_imputer: Union[str, Any] = 'lightgbm',
    ordinal_features: Optional[Dict[str, list]] = None,
    high_cardinality_features: Optional[List[str]] = None,
    high_cardinality_method: str = 'frequency',
    numeric_features: Optional[List[str]] = None,
    numeric_imputation: str = 'mean',
    numeric_iterative_imputer: Union[str, Any] = 'lightgbm',
    date_features: Optional[List[str]] = None,
    ignore_features: Optional[List[str]] = None,
    normalize: bool = False,
    normalize_method: str = 'zscore',
    transformation: bool = False,
    transformation_method: str = 'yeo-johnson',
    handle_unknown_categorical: bool = True,
    unknown_categorical_method: str = 'least_frequent',
    pca: bool = False,
    pca_method: str = 'linear',
    pca_components: Optional[float] = None,
    ignore_low_variance: bool = False,
    combine_rare_levels: bool = False,
    rare_level_threshold: float = 0.1,
    bin_numeric_features: Optional[List[str]] = None,
    remove_multicollinearity: bool = False,
    multicollinearity_threshold: float = 0.9,
    remove_perfect_collinearity: bool = False,
    group_features: Optional[List[str]] = None,
    group_names: Optional[List[str]] = None,
    n_jobs: Optional[int] = - 1,
    session_id: Optional[int] = None,
    log_experiment: bool = False,
    experiment_name: Optional[str] = None,
    log_plots: Union[bool, list] = False,
    log_profile: bool = False,
    log_data: bool = False,
    profile: bool = False,
    **kwargs
)
引数を入れて、カスタマイズしてみる
Power Query Editorから詳細エディターを開きます。
PythonはPower QueryのPython.Execute()関数のなかで実行されていることがわかります。
詳細エディターの中身
let
    Source = Csv.Document(File.Contents("C:\Users\******\Documents\GitHub\pycaret\datasets\jewellery.csv"),[Delimiter=",", Columns=4, Encoding=932, QuoteStyle=QuoteStyle.None]),
    #"Promoted Headers" = Table.PromoteHeaders(Source, [PromoteAllScalars=true]),
    #"Changed Type" = Table.TransformColumnTypes(#"Promoted Headers",{{"Age", Int64.Type}, {"Income", Int64.Type}, {"SpendingScore", type number}, {"Savings", type number}}),
    #"Run Python script" = Python.Execute("# 'dataset' はこのスクリプトの入力データを保持しています#(lf)#(lf)from pycaret.clustering import *#(lf)dataset = get_clusters(data = dataset,model='meanshift',num_clusters=5)",[dataset=#"Changed Type"]),
    #"Expanded {0}" = Table.ExpandTableColumn(#"Run Python script", "Value", {"Age", "Income", "SpendingScore", "Savings", "Cluster"}, {"Age", "Income", "SpendingScore", "Savings", "Cluster"}),
    #"Changed Type1" = Table.TransformColumnTypes(#"Expanded {0}",{{"Age", type number}, {"Income", type number}, {"SpendingScore", type number}, {"Savings", type number}, {"Cluster", type text}})
in
    #"Changed Type1"
get_clusters()関数の中身を下記のように書き換えて実行します :yawning_face:
クラスターの個数を5個に変更しています。
python get_clusters(data = dataset,num_clusters=5)
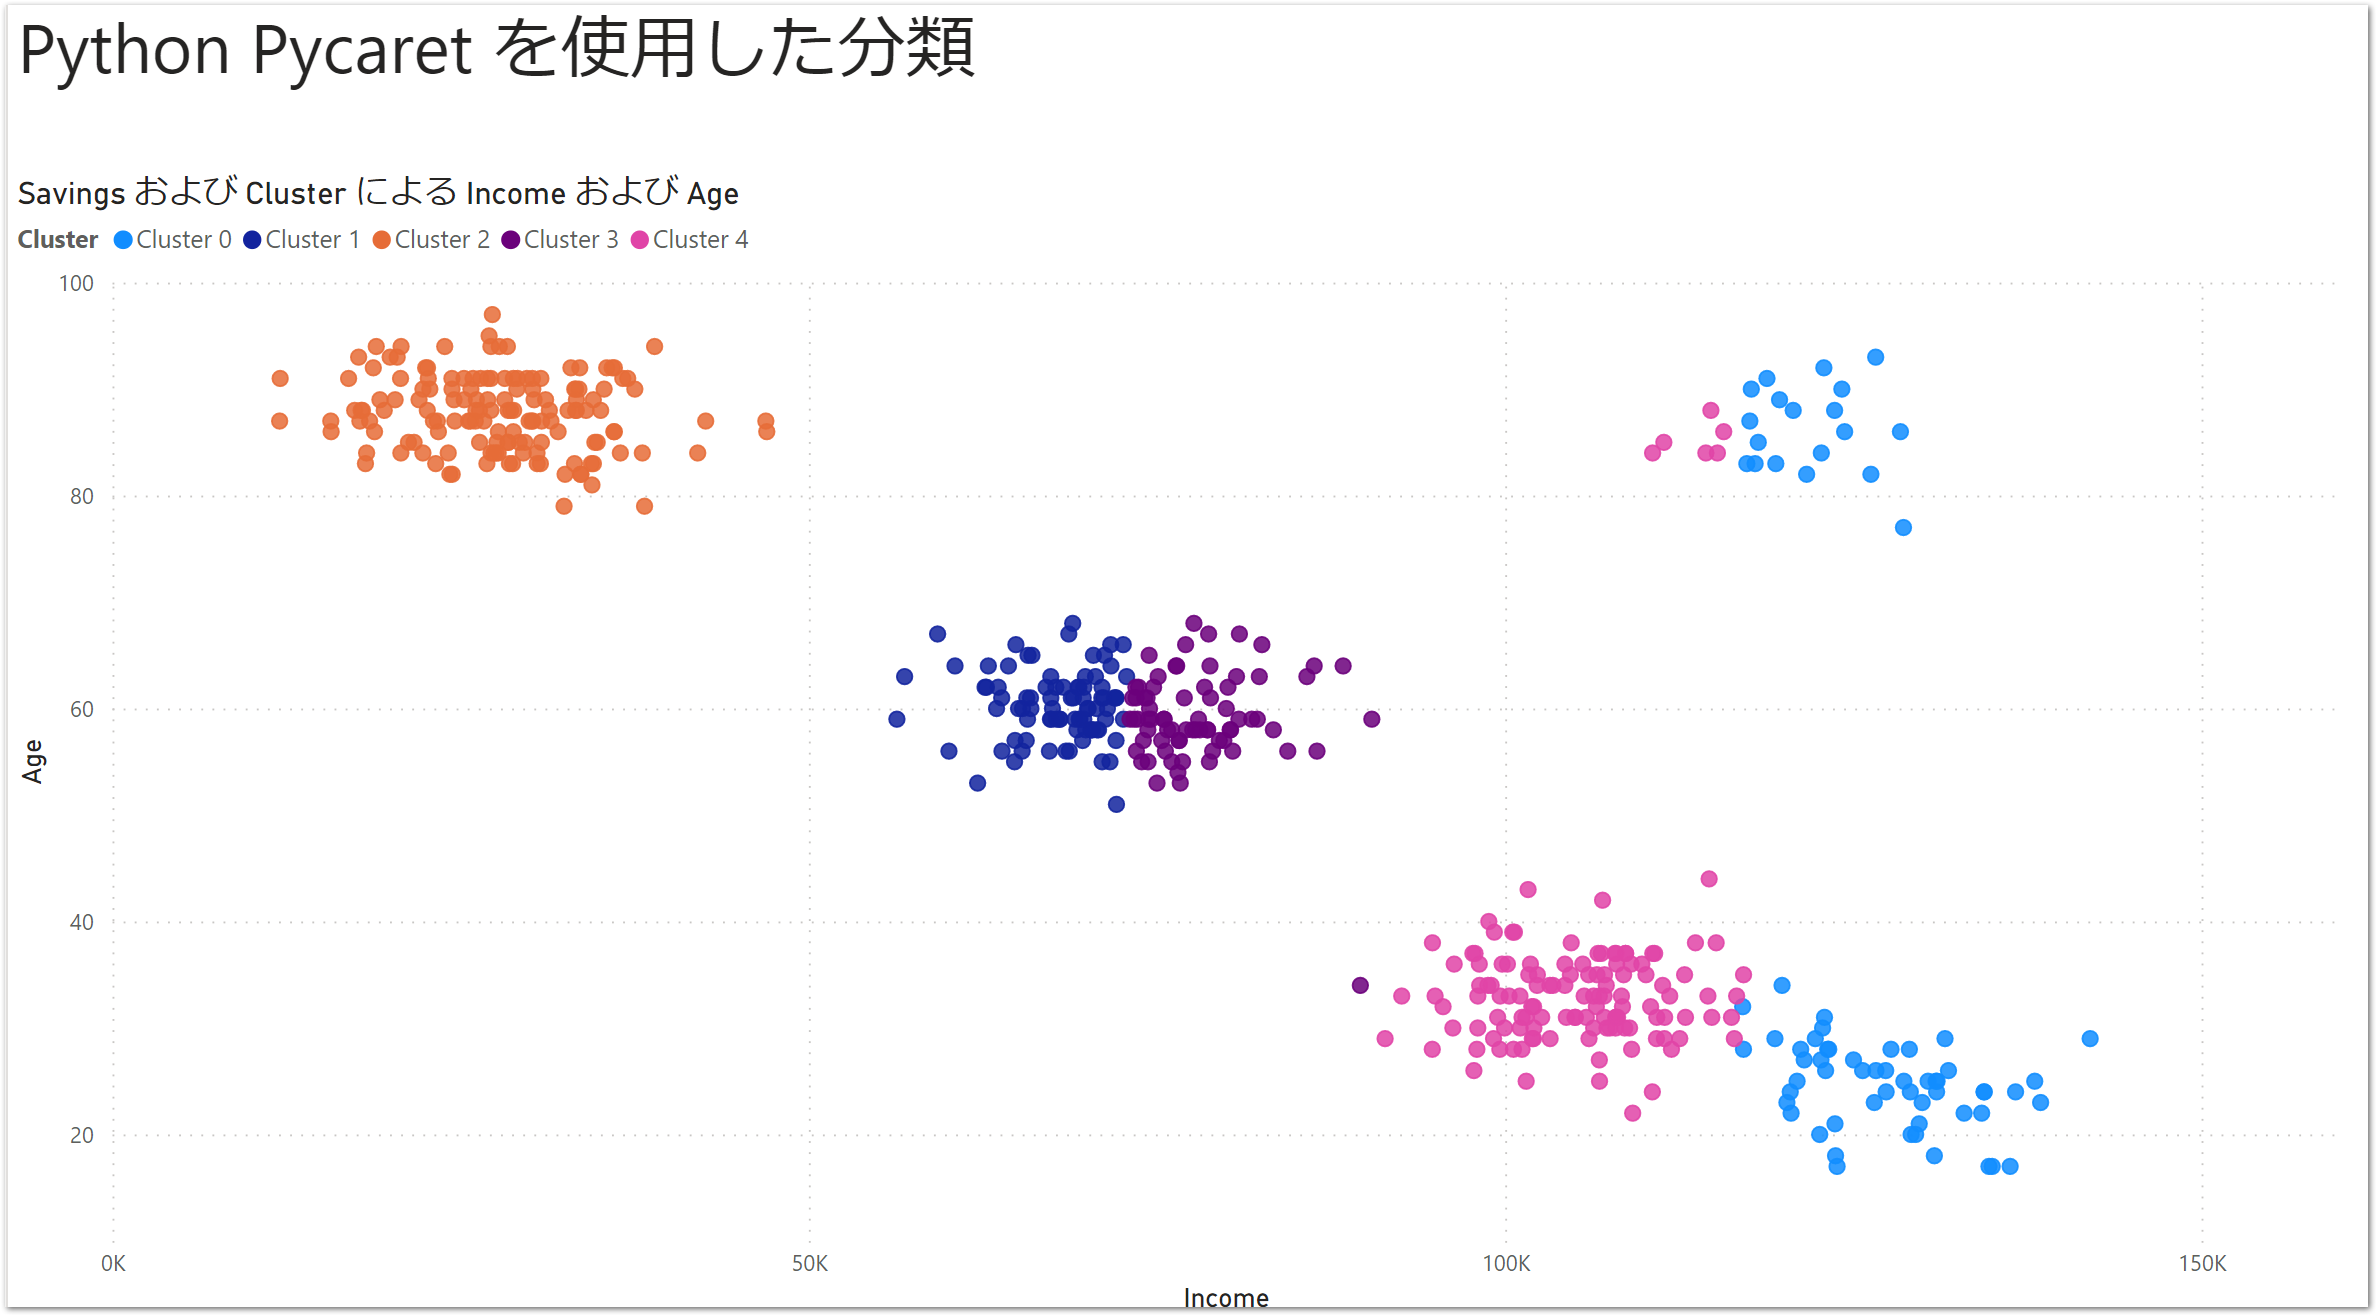
散布図の作成
クラスターが0~4までの5個に分かれました。
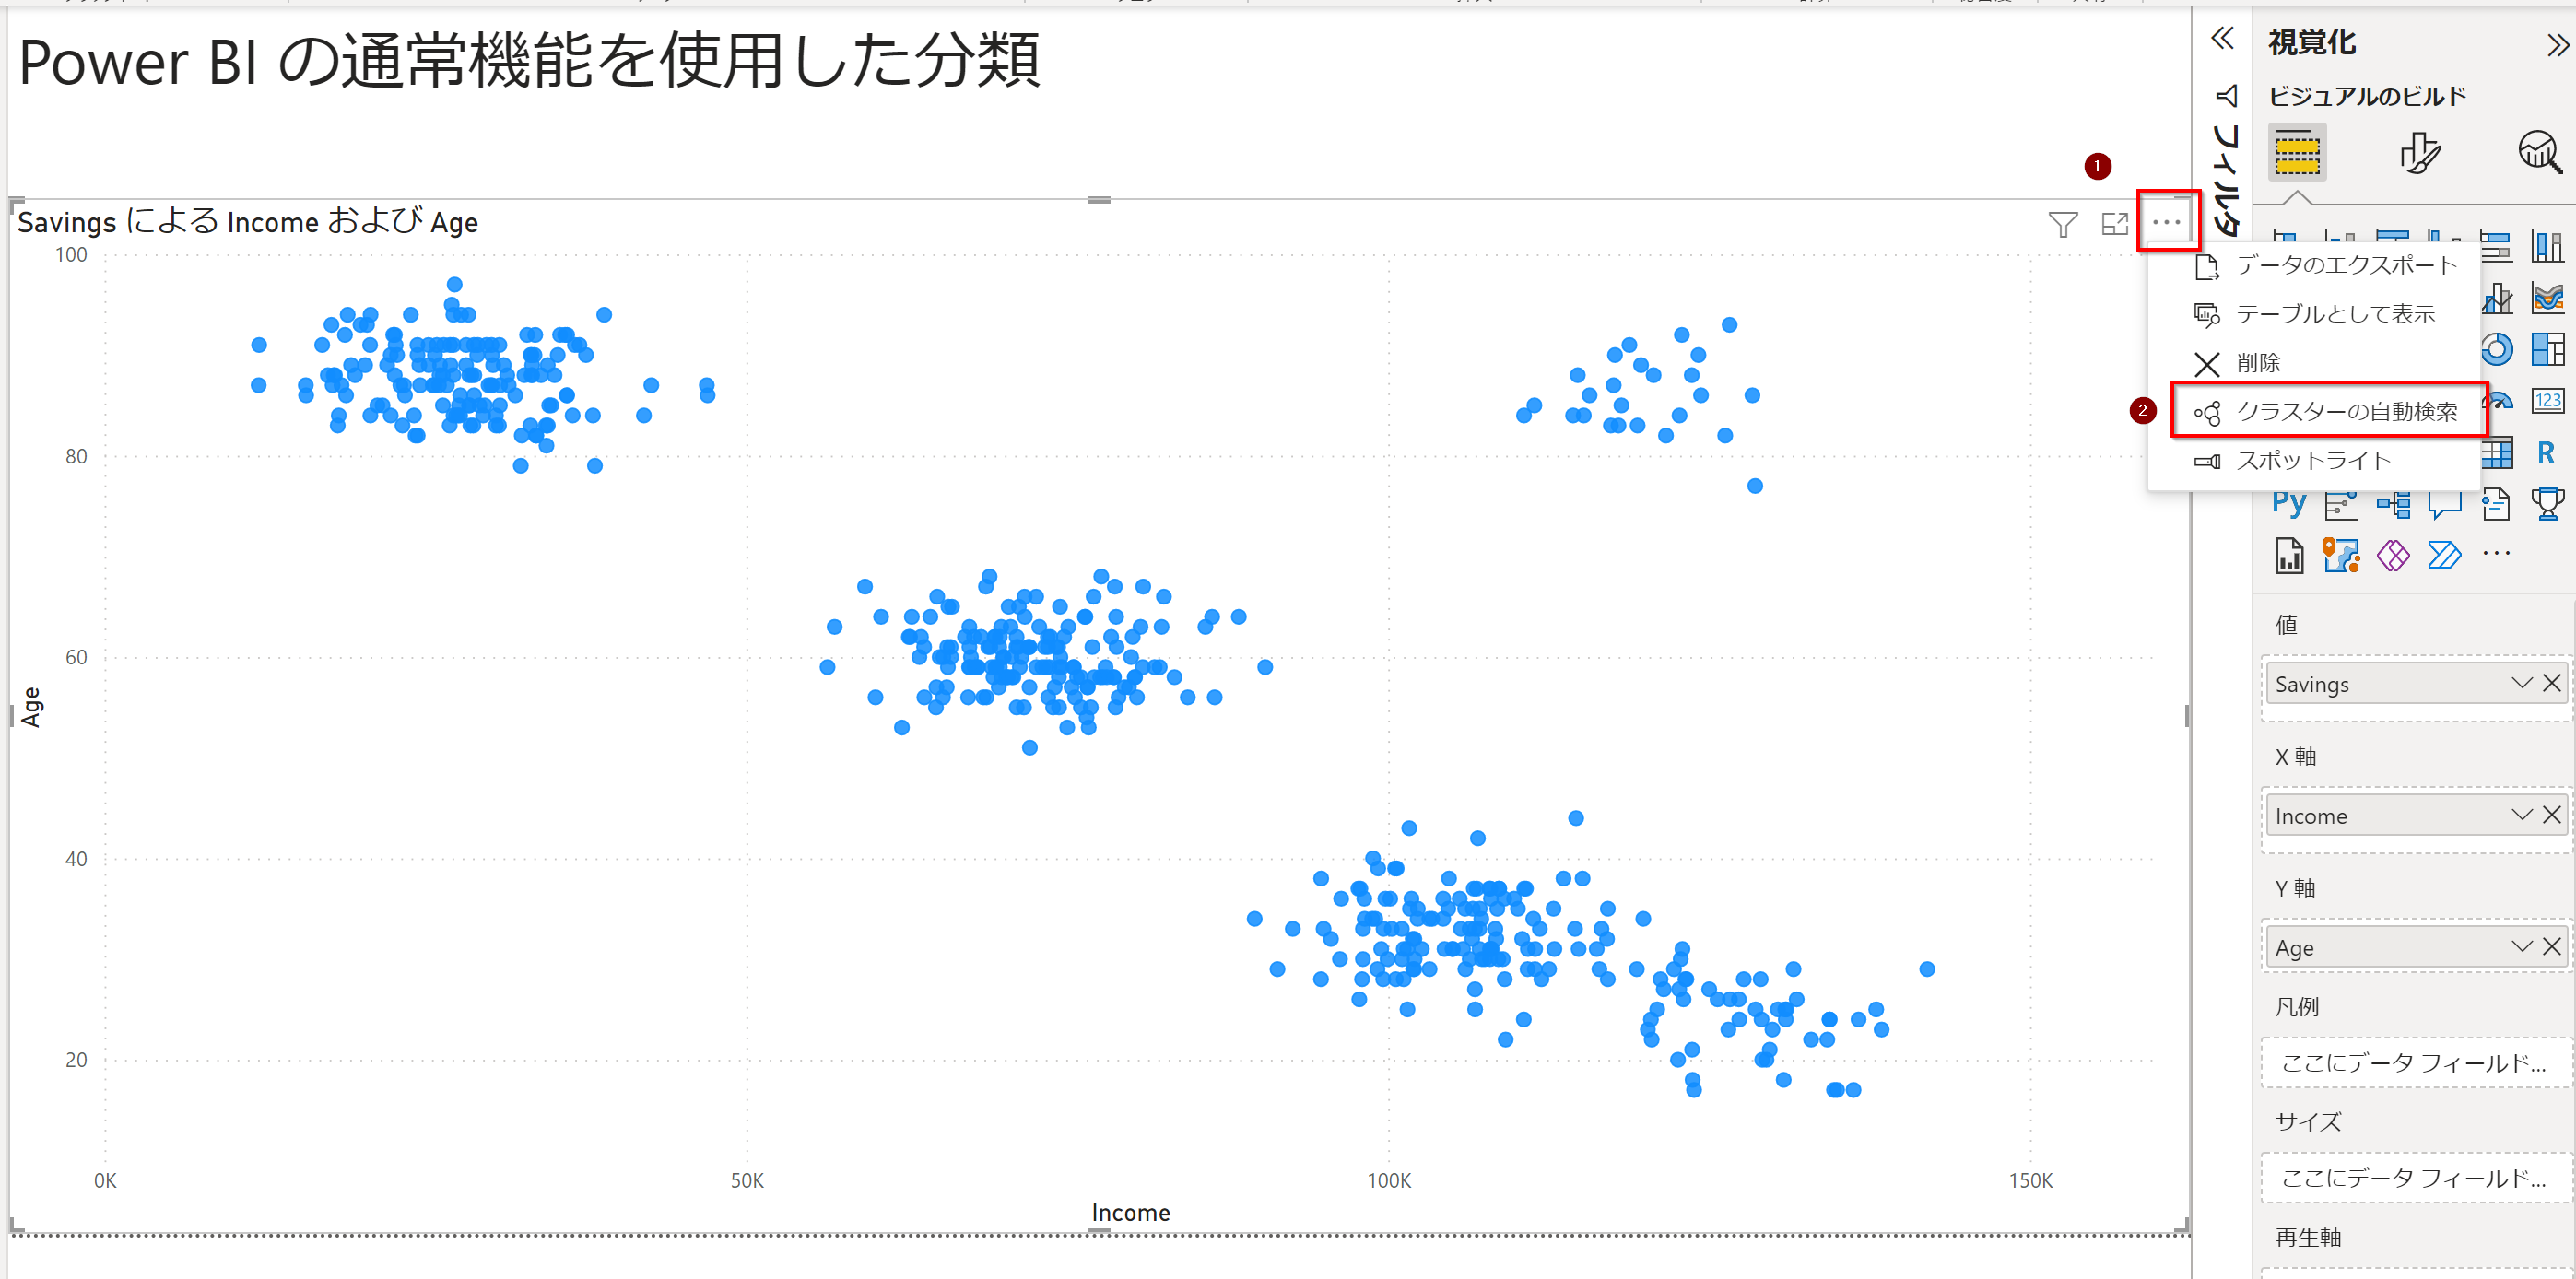
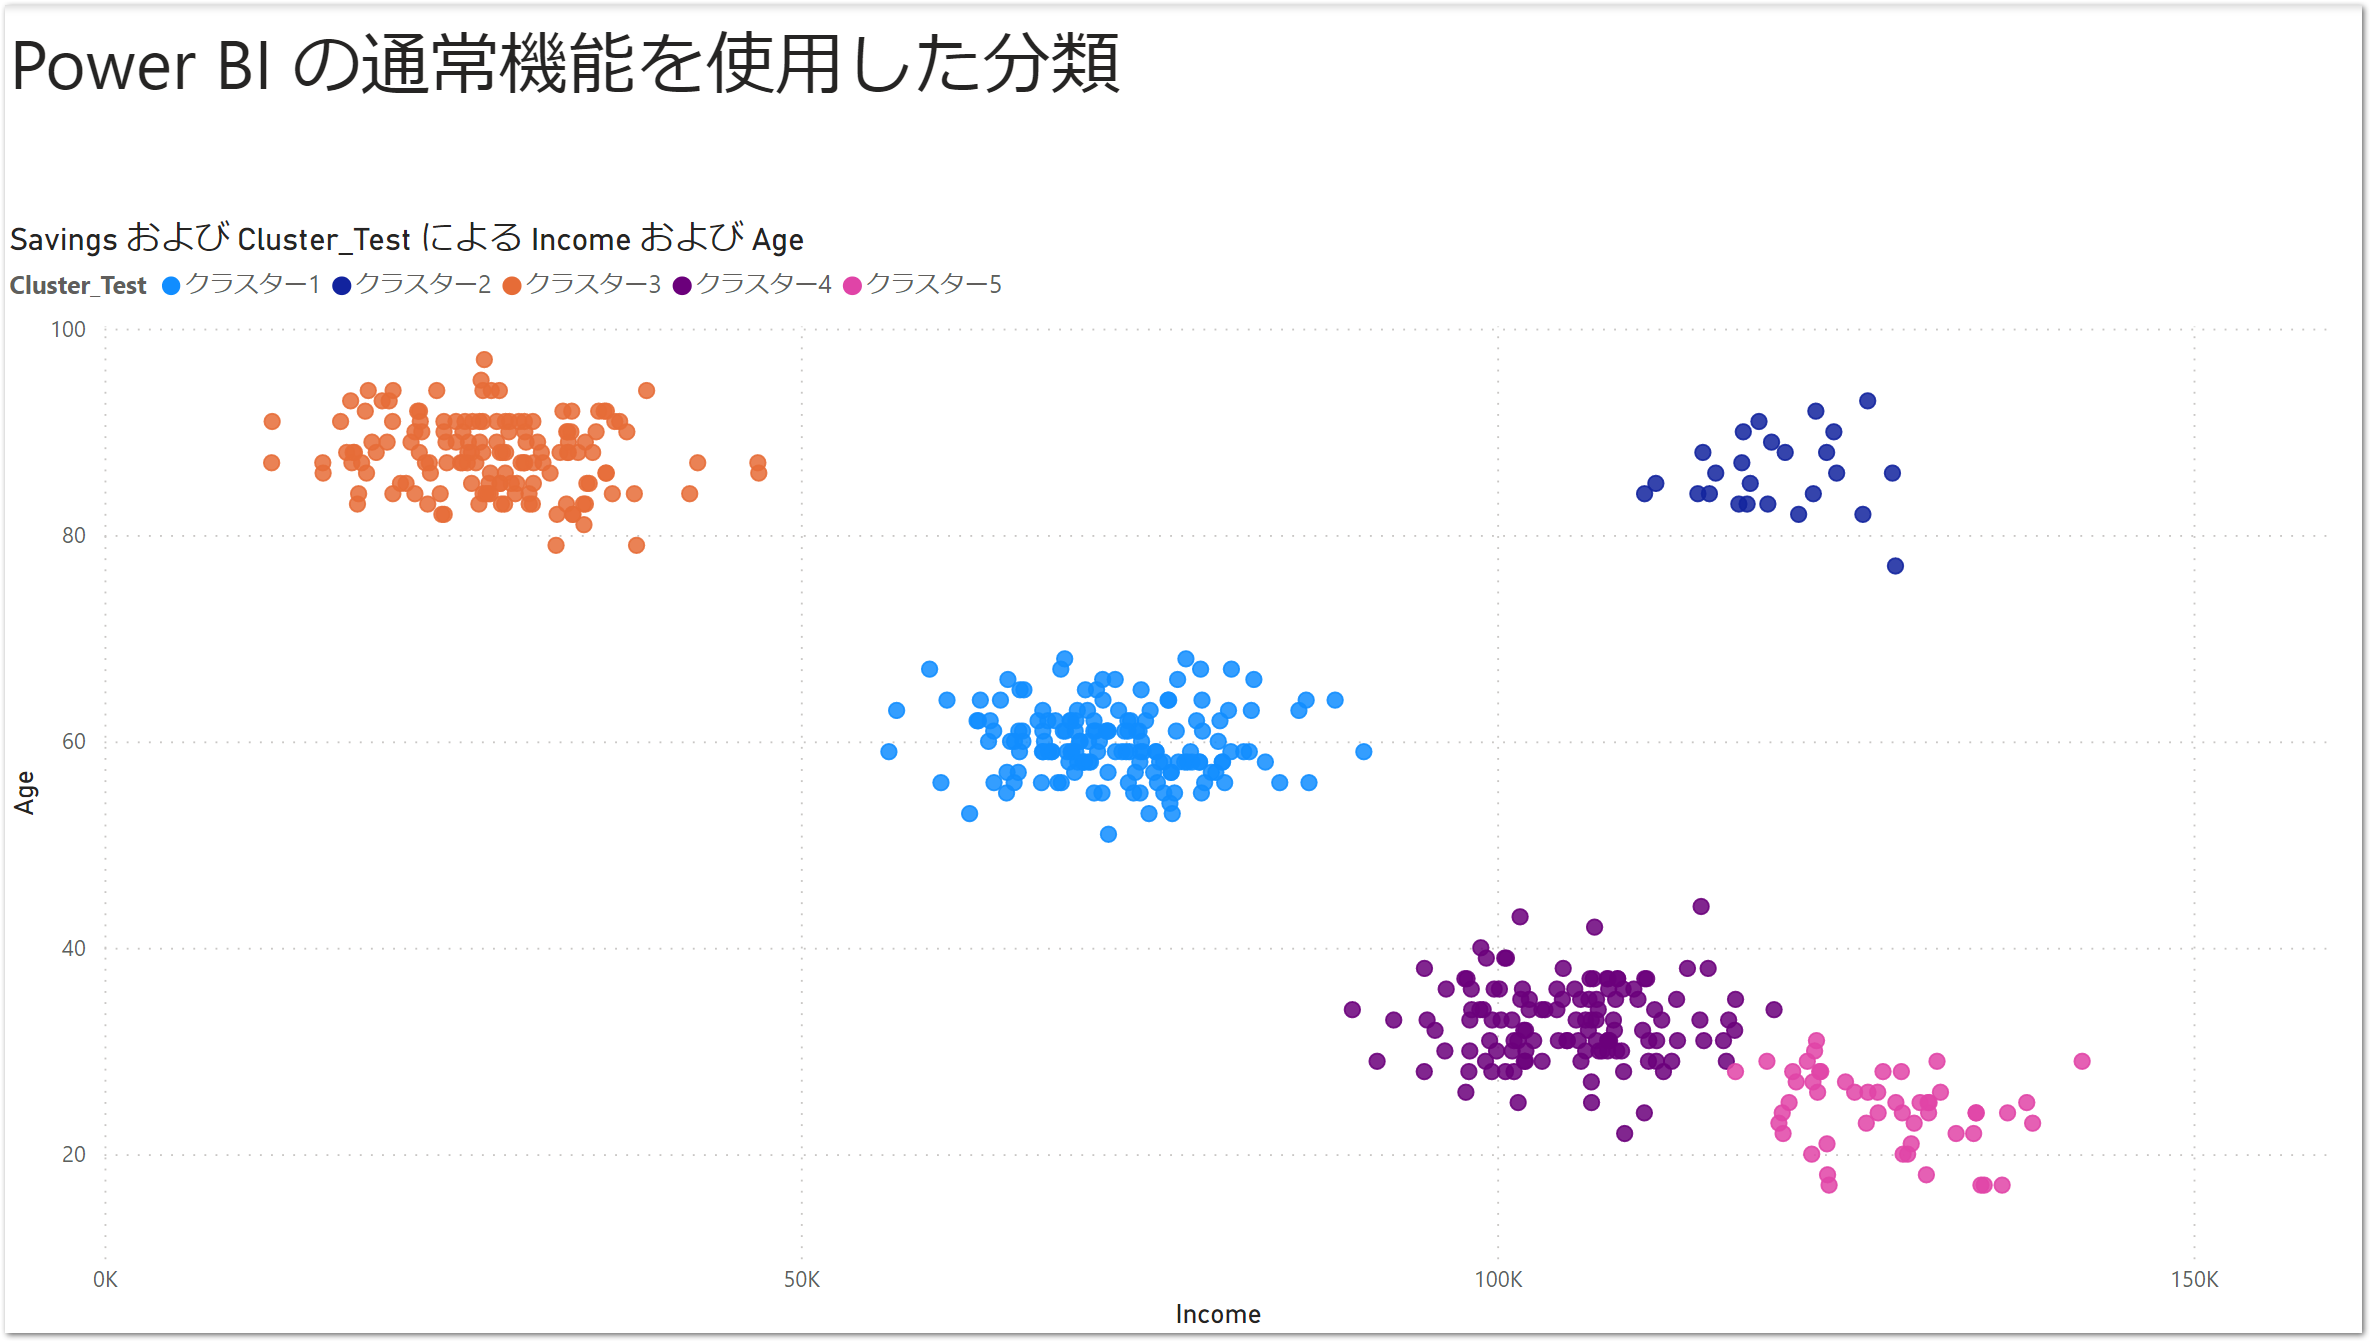
Power BIのデフォルト機能でクラスタリング
ここまでPycaretでクラスタリングをしていましたが、Power BI Desktopのデフォルトの機能にもクラスタリングがあります ![]()
散布図を作成
散布図を作成し、右上の三点リーダーをクリックすると、クラスターの自動検索というボタンが出てきます。
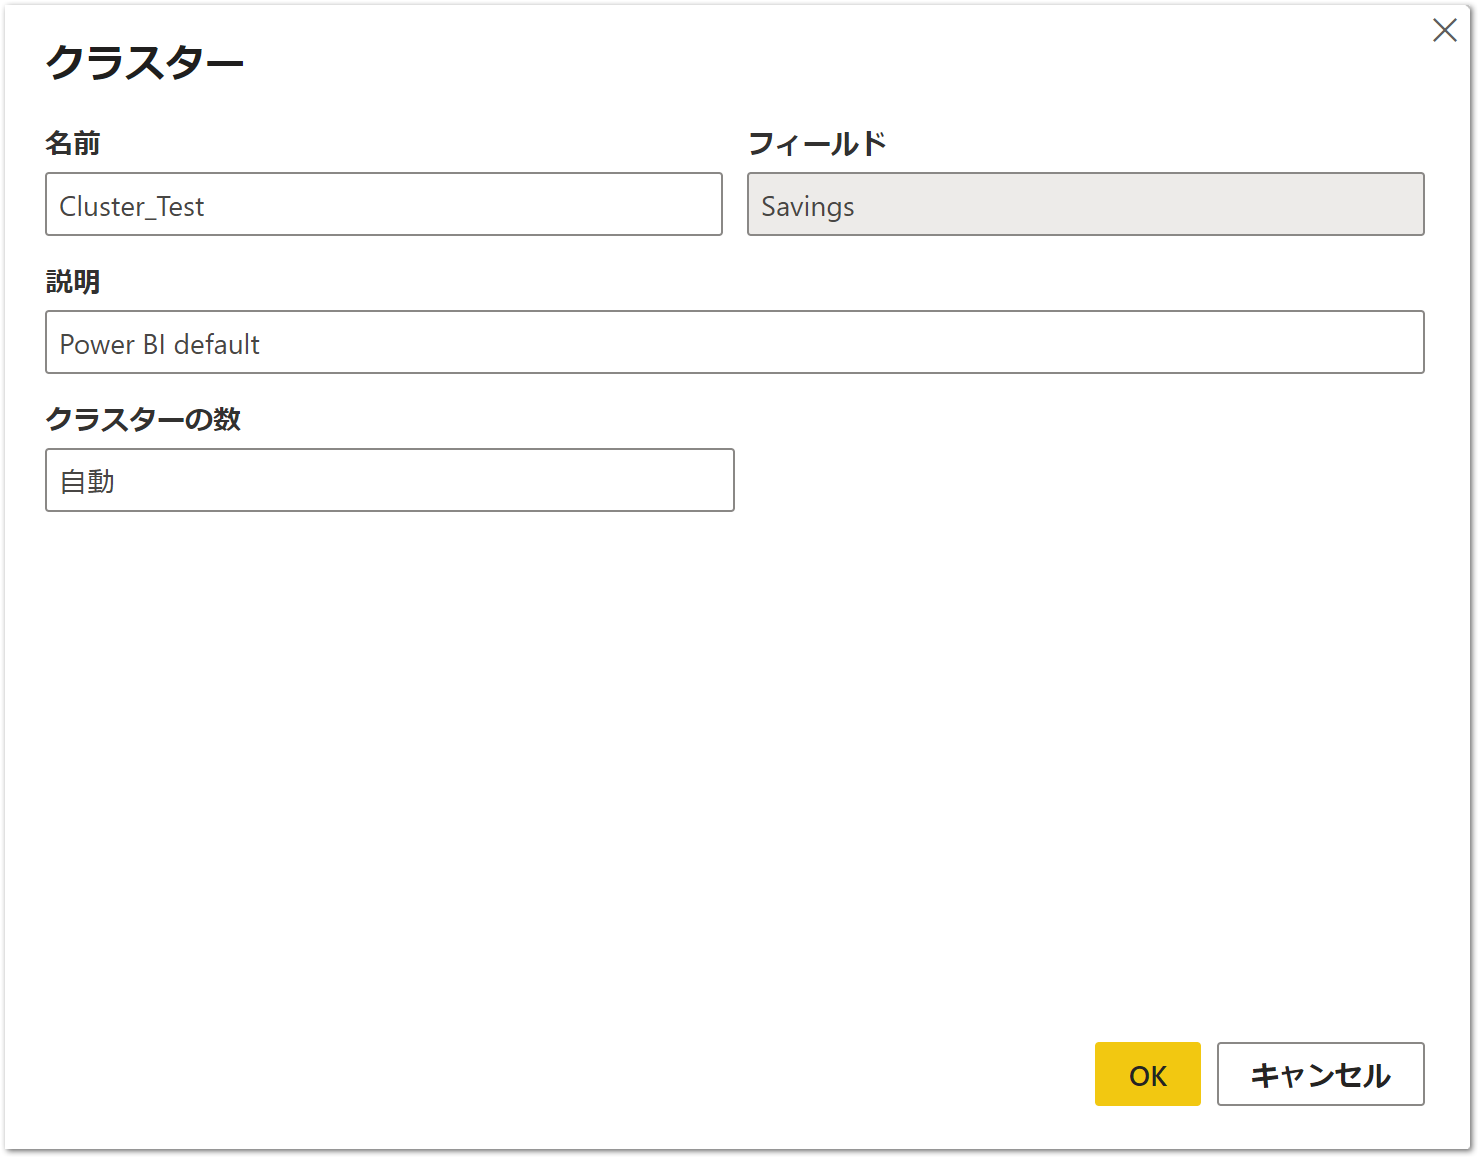
クラスターを作成
クラスターの数は自動検出してくれます。もちろん任意の数を指定することも可能。
完成
これで完成。簡単ですね。Pycaretで作成した散布図よりもクラスターの分かれ方が直感的になっています。Power BI Desktop優秀 ![]()
まとめ
Pycaretを使えば、分類・回帰・異常検知などさまざまな機械学習モデルを簡単にPower BIに導入できそう :woman_farmer:
今回の実験ではPower BI Desktopのデフォルト機能のほうが直感的なクラスター分類をできましたが、暗黙的な処理が多いです。Pycaretを使用すれば説明可能な実装ができるというメリットもあるかなと ![]()
Pythonでなにができるのか、デフォルトで何ができるのかを知っておくのは重要 ![]()
参考資料