0.About filebeat
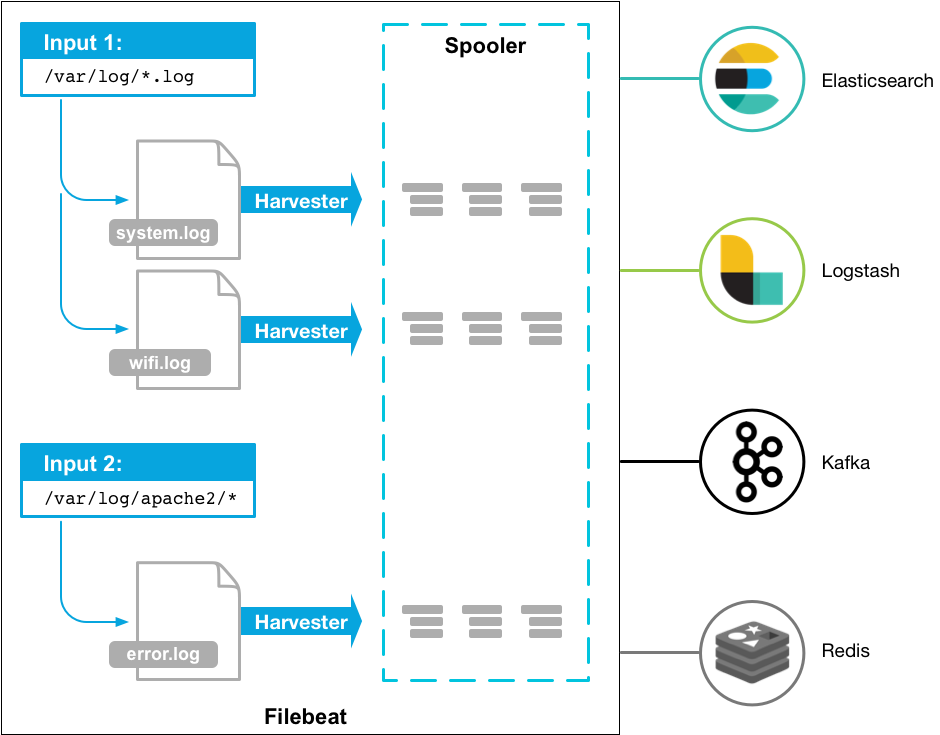
- Filebeat is a lightweight shipper for forwarding and centralizing log data. Installed as an agent on your servers, Filebeat monitors the log files or locations that you specify, collects log events, and forwards them to either to Elasticsearch or Logstash for indexing.
- To configure Filebeat, you edit the configuration file. The default configuration file is called filebeat.yml.
- Filebeat has a lot of module, which is quite easy installation for operator.
1.objective
Install Filebeat into EC2 instance(virtual machine on AWS) and create pre-defined visualization
2.Condition
- you have Instance on AWS which has installed the following instance
- elasticsearch
- Kibana
- apache2
3.Command
・Install filebeat
curl -L -O https://artifacts.elastic.co/downloads/beats/filebeat/filebeat-7.0.0-darwin-x86_64.tar.gz
tar xzvf filebeat-7.0.0-darwin-x86_64.tar.gz
cd filebeat-7.0.0-darwin-x86_64/
・run filebeat
systemctl start filebeat
・confirm the filebeat status
systemctl status filebeat
active means that your filebeat runs corectly
filebeat.service - Filebeat sends log files to Logstash or directly to Elasticsearch.
   Loaded: loaded (/usr/lib/systemd/system/filebeat.service; enabled; vendor preset: disabled)
   Active: active (running) since Fri 2019-08-30 03:02:53 UTC; 2h 34min ago
     Docs: https://www.elastic.co/products/beats/filebeat
Modify filebeat.yml(/etc/filebeat) to set the connection information:
# ============================== Kibana =====================================

# Starting with Beats version 6.0.0, the dashboards are loaded via the Kibana API.
# This requires a Kibana endpoint configuration.
setup.kibana:

  # Kibana Host
  # Scheme and port can be left out and will be set to the default (http and 5601)
  # In case you specify and additional path, the scheme is required: http://localhost:5601/path
  # IPv6 addresses should always be defined as: https://[2001:db8::1]:5601
  host: "localhost:5601"

# -------------------------- Elasticsearch output ------------------------------
output.elasticsearch:
  # Array of hosts to connect to.
  hosts: ["localhost:9200"]
- activate apache module
filebeat modules enable apache
filebeat has a lot of default modules. you can just remove .disable when using module(or run the above command).
apache.yml                  googlecloud.yml.disabled  kibana.yml.disabled    netflow.yml.disabled     redis.yml.disabled
auditd.yml.disabled         haproxy.yml.disabled      logstash.yml.disabled  nginx.yml.disabled       santa.yml.disabled
cisco.yml.disabled          icinga.yml.disabled       mongodb.yml.disabled   osquery.yml.disabled     suricata.yml.disabled
coredns.yml.disabled        iis.yml.disabled          mssql.yml.disabled     panw.yml.disabled        system.yml
elasticsearch.yml.disabled  iptables.yml.disabled     mysql.yml              postgresql.yml.disabled  traefik.yml.disabled
envoyproxy.yml.disabled     kafka.yml.disabled        nats.yml.disabled      rabbitmq.yml.disabled    zeek.yml.disabled
The setup command loads the Kibana dashboards. If the dashboards are already set up, omit this command.
./filebeat setup
./filebeat -e
restart filebeat
systemctl restart filebeat
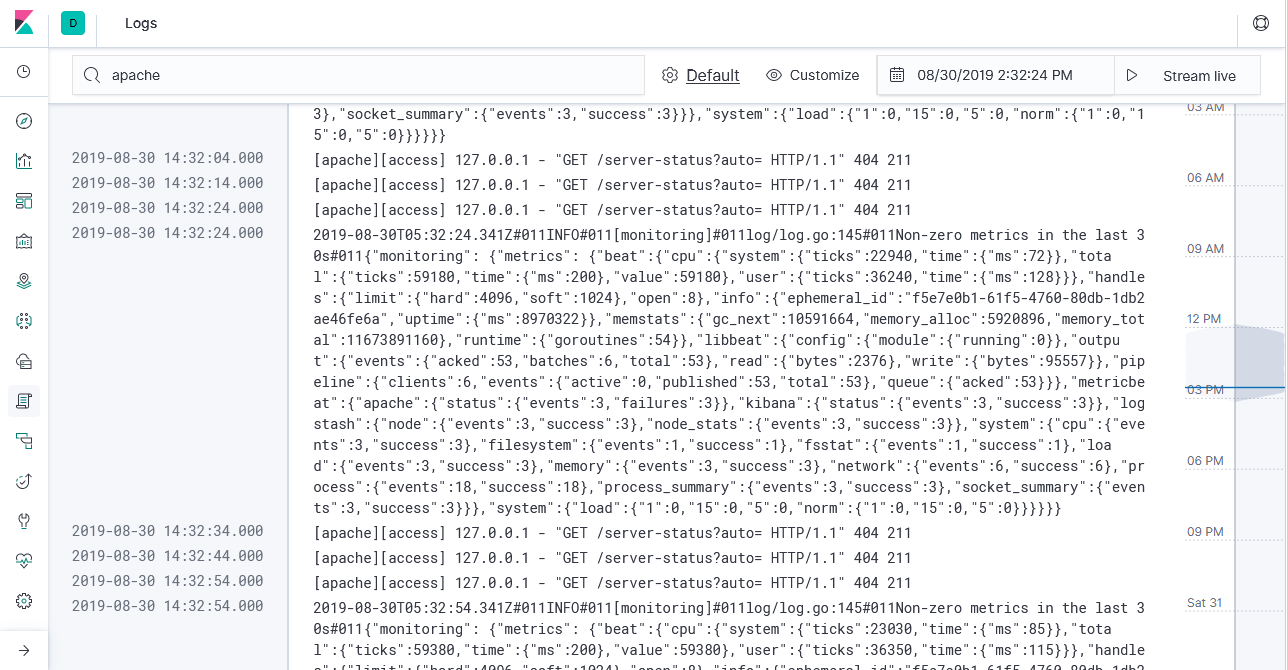
then you can find some visualization setting installed via your command
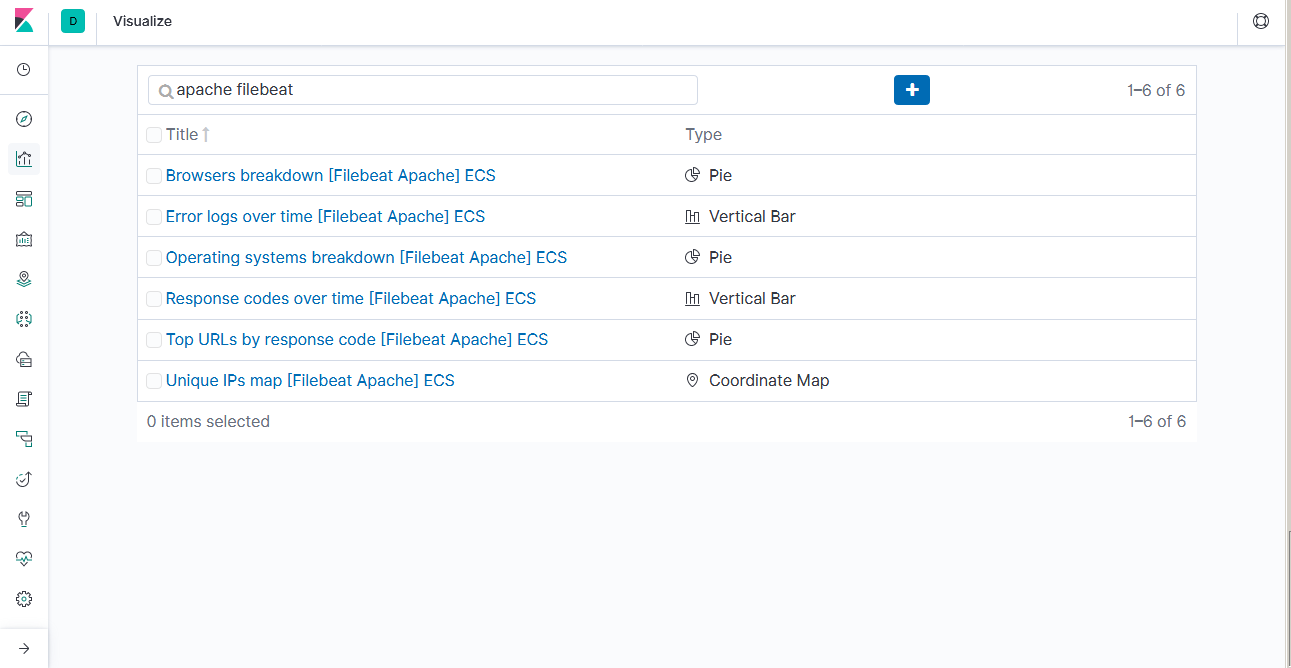
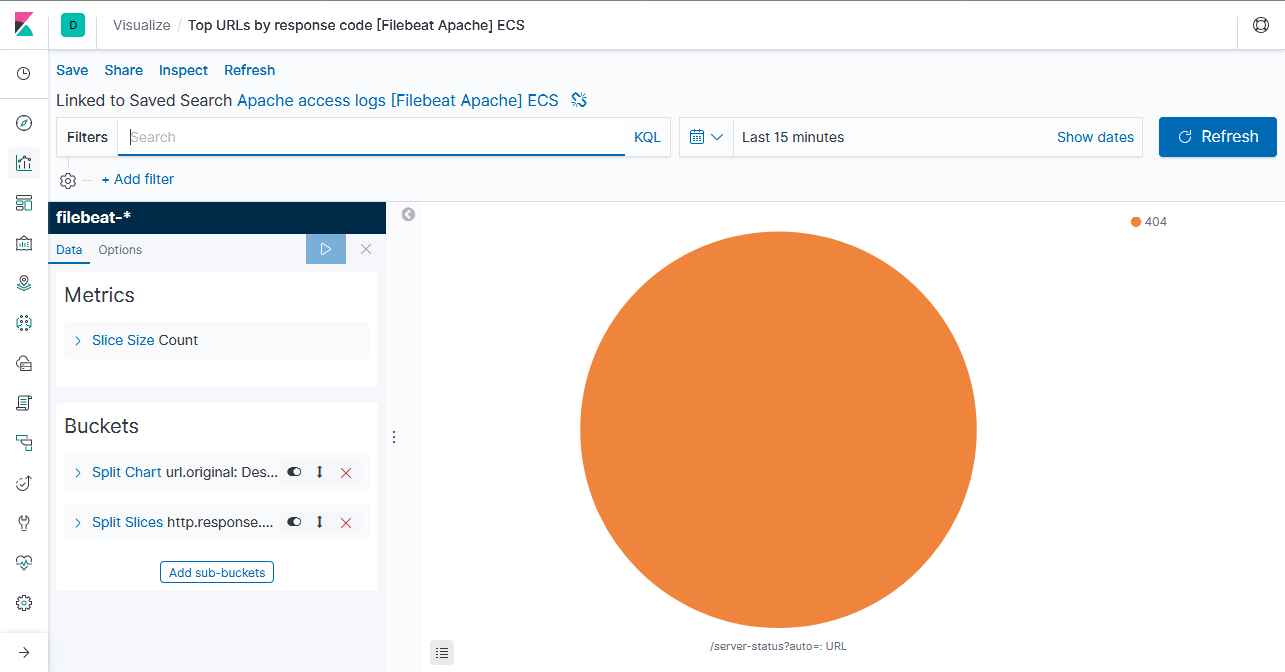
The following is the one of visualization example
and you can also confirm log message which is received to Elasticsearch.