Googleマップタイムラインのロケーション履歴とOpenStreetMapを組み合わせて、個人のロケーション履歴のマップアニメーションを作成する。
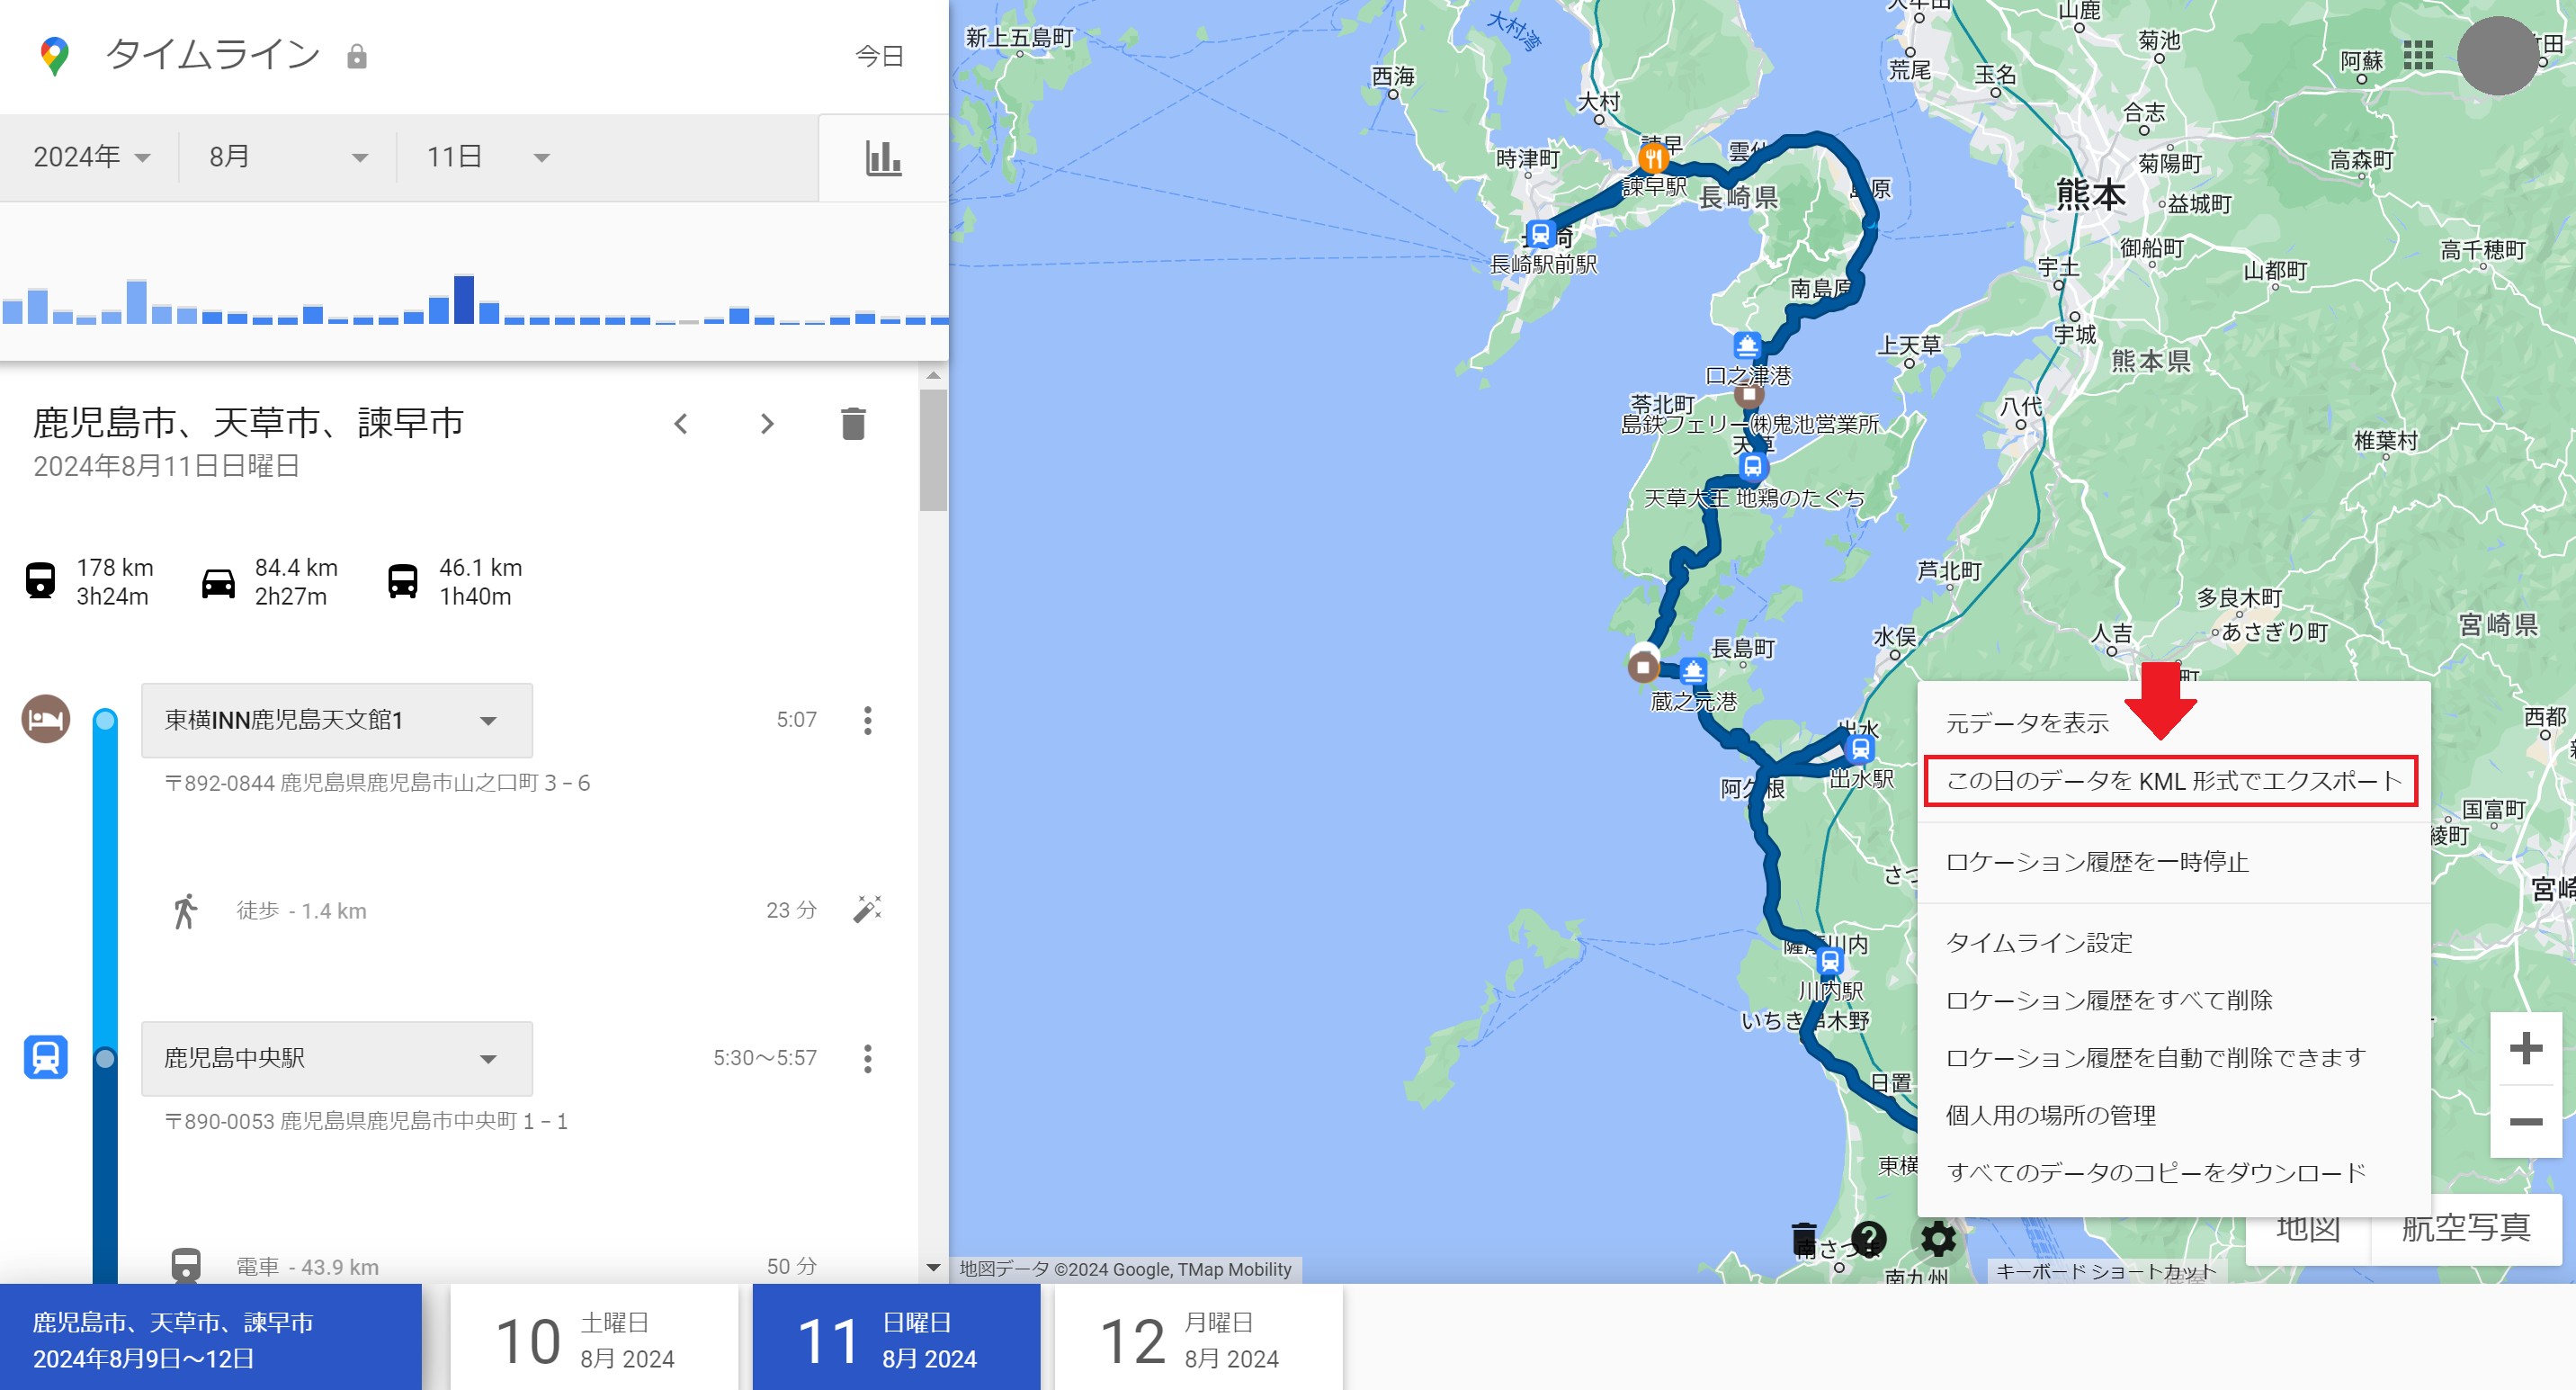
1. KMLデータのエクスポート
始めに、Googleマップタイムラインからアニメーション作成をしたい日のロケーション履歴をKML形式*でエクスポートする。
*KML形式 ... KML は、Google Earth、Google マップ、モバイル Google マップなどの Earth ブラウザで、地理データの表示に使用するファイル形式。KML(Keyhole Markup Language)
2. KMLファイル内のPlacemark要素を取得
以降のスクリプトはGoogle Colaboratoryで実行することを想定している。
ロケーション履歴の座標情報が含まれる、KMLファイル内のPlacemark要素をKMLファイルから抽出し、抽出した[緯度、経度、高度]の座標データを新しいリスト(下記コード内では"coordinates_coords")に格納する。
from xml.etree import ElementTree as ET

# KMLファイルのパスを指定
kml_file_path = '/content/drive/MyDrive/KML_mapanime/history-2024-08-11.kml'

# coordinatesの座標を保持するリストを作成
coordinates_coords = []

# KMLファイルの解析と座標の取得
tree = ET.parse(kml_file_path)
root = tree.getroot()

# KMLファイル内のPlacemark要素を取得し、座標をcoordinates_coordsに追加
for placemark in root.findall('.//{http://www.opengis.net/kml/2.2}Placemark'):
    coords_str = placemark.find('.//{http://www.opengis.net/kml/2.2}coordinates').text.strip()
    coords = [list(map(float, coord.split(','))) for coord in coords_str.split()]
    coordinates_coords.extend(coords)

# 結果の出力
print(coordinates_coords)
上記コードでは、最初に xml.etree.ElementTree をインポートしている。このモジュールは、XML(eXtensible Markup Language)ファイルを操作するための標準ライブラリであり、XMLの解析(パース)、生成、操作を簡単に行うことができる。(例えば、KMLやRSSフィードなどはXML形式で、地理情報やその他のデータがXMLタグで整理されている。)
3. 座標データのリストをJavaScriptの配列形式の文字列に変換する
座標データのリストをJavaScriptの配列形式の文字列に変換する。リスト内の高度の情報は不要なので変換対象とはしていない。
この変換により出力された文字列をJavaScriptのコード内に直接組み込むことができるようになる。
# coordinates_coordsをJavaScriptの配列形式の文字列に変換する関数
def to_js_array(coordinates_coords):
   js_array = "[" + ",".join([f"[{coord[0]},{coord[1]}]" for coord in coordinates_coords]) + "]"
   return js_array

# coordinates_coordsをJavaScriptの配列形式に変換
js_coords_str = to_js_array(coordinates_coords)

# 結果の表示
print("js_coords_str:", js_coords_str)
4. マップアニメーションを作成する
LeafletとJavaScriptのsetIntervalやanimate関数を併用しマップアニメーションを作成する。
下記スクリプトにより作成されるマップアニメーションでは、地図の中心が座標履歴と一緒に移動する。また、画像を指定することでアイコンを表示することもできる。
参考 → フライトマップ風の地図(マップアニメーション)をつくる
#マップアニメーションを表示する
#アニメーション時に地図の中心が移動(アイコン付き)
from google.colab import files

# HTMLファイルのテンプレート
html_template = """<!DOCTYPE html>
<html>
<head>
  <title>Great Circle Animation</title>
  <meta charset="utf-8" />
  <meta name="viewport" content="width=device-width, initial-scale=1.0">
  <link rel="stylesheet" href="https://unpkg.com/leaflet@1.7.1/dist/leaflet.css" />
  <script src="https://unpkg.com/leaflet@1.7.1/dist/leaflet.js"></script>
</head>
<body>
  <div id="map" style="height: 1020px; width: 1980px;"></div>

  <script>
    var map = L.map('map').setView([34.7101, 137.7259], 8); // 地図初期化時のマップ中心を指定

    L.tileLayer('https://{s}.tile.openstreetmap.org/{z}/{x}/{y}.png', {
      maxZoom: 18,
    }).addTo(map);

    var polyline = L.polyline([], { color: 'blue' }).addTo(map);
    var precalculatedPoints = %s; // Pythonで変換したJavaScriptの配列形式の文字列を挿入

    // マーカーの設定
    var markerIcon = L.icon({
      iconUrl: 'https://blog-imgs-174.fc2.com/m/a/k/makuragi24/unnamed.jpg',
      iconSize: [25, 41], // アイコンのサイズ
      iconAnchor: [12, 41], // アイコンのアンカー(位置)
      popupAnchor: [1, -34],
      shadowSize: [41, 41]
    });

    var marker = L.marker([34.7101, 137.7259], { icon: markerIcon }).addTo(map);

    function animateLineWithPreCalculatedPoints() {
      animate(0); // 最初の点からアニメーションを開始
    }

    function animate(index) {
      if (index < precalculatedPoints.length) {
        var point = precalculatedPoints[index];
        polyline.addLatLng(L.latLng(point[1], point[0]));
        marker.setLatLng(L.latLng(point[1], point[0])); // マーカーの位置を更新
        map.setView([point[1], point[0]], 12); // アニメーション時に地図の中心を移動させる
        setTimeout(function() {
          polyline.getLatLngs().push(L.latLng(point[1], point[0])); // ポリラインに座標を追加する
          polyline.redraw(); // ポリラインを再描画する
          animate(index + 1); // 次の点へ
        }, 100); // アニメーション速度を調整するための遅延(例えば5ミリ秒)
      }
    }

    animateLineWithPreCalculatedPoints(); // アニメーションを開始
  </script>
</body>
</html>
"""

# HTMLコードにJavaScriptの配列形式の文字列を埋め込む
html_with_coords = html_template % js_coords_str

# HTMLコードをファイルに保存する
file_path = "/content/drive/MyDrive/KML_mapanime/mapanime.html"  # 保存先のファイルパスを指定
with open(file_path, "w") as file:
    file.write(html_with_coords)

print(f"ファイルが保存されました: {file_path}")

# ファイルをダウンロードする
files.download(file_path)
実行結果をmp4化したものは以下の通り。
以上で、Googleマップタイムラインの履歴からマップアニメーションを作ることができた。
