TL;DR
xとf(x)が両方とも3次元なデータというと、
- 地球周辺の位置xと、そこの地磁気の磁場f(x)
- 空気中の位置xと、そこに吹く風f(x)
などなど無数にある。補間したくなるのは当たり前。まずはSciPyによる線形補間の例。
import numpy as np
import scipy.interpolate as itpl
from mpl_toolkits.mplot3d import Axes3D
import matplotlib.pyplot as plt

def show_points(x, y):
    fig = plt.figure()
    ax = fig.add_subplot(111, projection='3d')

    for xi, yi in zip(x, y):
        a, b, c = xi
        ax.scatter(a, b, c, c=yi, marker='o')

    ax.set_xlabel('X')
    ax.set_xlim(0, 1)
    ax.set_ylabel('Y')
    ax.set_ylim(0, 1)
    ax.set_zlabel('Z')
    ax.set_zlim(0, 1)

    plt.show()

def func(x):
    x0 = x + 0.1
    return x0 / np.linalg.norm(x0, axis=-1).reshape(-1, 1)

def gen_mesh(n_point):
    return np.mgrid[0:1:n_point * 1j, 0:1: n_point * 1j, 0:1: n_point * 1j].transpose(1,2,3,0).reshape(-1,3)

def main():
    n = 4
    x = gen_mesh(n)
    y = func(x)
    show_points(x, y)
    xi = gen_mesh(5)
    yi = itpl.griddata(x, y, xi, method ='linear')
    show_points(xi, yi)

if __name__=='__main__':
    main()
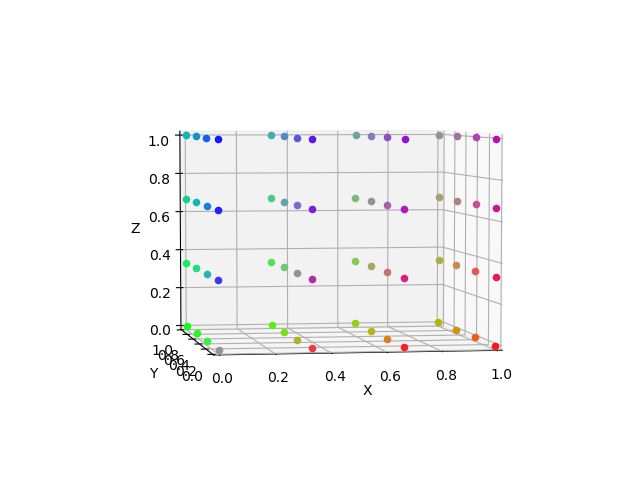
補間元
線形補間(SciPy)
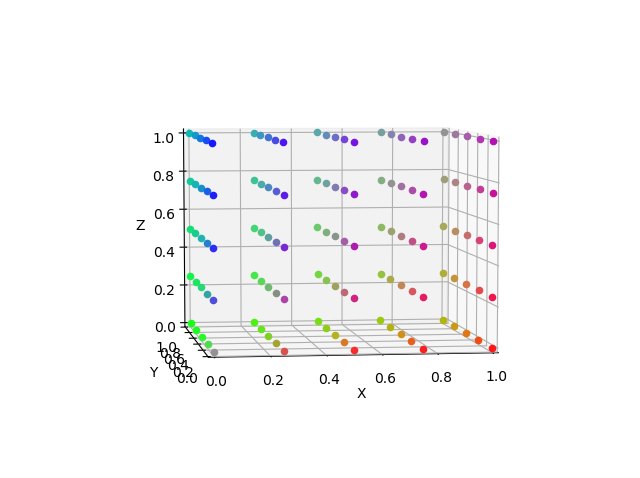
普通に補間できている。
tricubic補間
人生、線形補間だけでいいのか? スプラインしたくはないか?
しかしxが3次元以上のデータのスプライン補間は、なにやら難しいらしい。3次元では、tricubic interpolationという方法があり、Pythonではeqtoolsなるパッケージがある。eqtoolsはPython2限定なので、Python3で動くようにしたのがeqtools3だが、元のeqtoolsからしてユニットテストがバンバンfailするので、eqtools3もあまり信じないほうがいい。
import numpy as np
import scipy.interpolate as itpl
from mpl_toolkits.mplot3d import Axes3D
import matplotlib.pyplot as plt
from eqtools3.trispline import Spline

def show_points(x, y):
    fig = plt.figure()
    ax = fig.add_subplot(111, projection='3d')

    for xi, yi in zip(x, y):
        a, b, c = xi
        ax.scatter(a, b, c, c=yi, marker='o')

    ax.set_xlabel('X')
    ax.set_xlim(0, 1)
    ax.set_ylabel('Y')
    ax.set_ylim(0, 1)
    ax.set_zlabel('Z')
    ax.set_zlim(0, 1)

    plt.show()

def func(x):
    x0 = x + 0.1
    return x0 / np.linalg.norm(x0, axis=-1).reshape(-1, 1)

def gen_mesh(n_point):
    return np.mgrid[0:1:n_point * 1j, 0:1: n_point * 1j, 0:1: n_point * 1j].transpose(1,2,3,0).reshape(-1,3)

def main():
    n = 4
    x = gen_mesh(n)
    y = func(x)
    show_points(x, y)

    grid = np.linspace(0., 1., n)
    f0 = Spline(grid, grid, grid, y[:,0].reshape(n,n,n))
    f1 = Spline(grid, grid, grid, y[:,1].reshape(n,n,n))
    f2 = Spline(grid, grid, grid, y[:,2].reshape(n,n,n))
    xi = gen_mesh(5)
    yi0 = f0.ev(xi[:,0], xi[:,1], xi[:,2])
    yi1 = f1.ev(xi[:,0], xi[:,1], xi[:,2])
    yi2 = f2.ev(xi[:,0], xi[:,1], xi[:,2])
    show_points(xi, np.transpose([yi0, yi1, yi2], (1, 0)))

if __name__=='__main__':
    main()
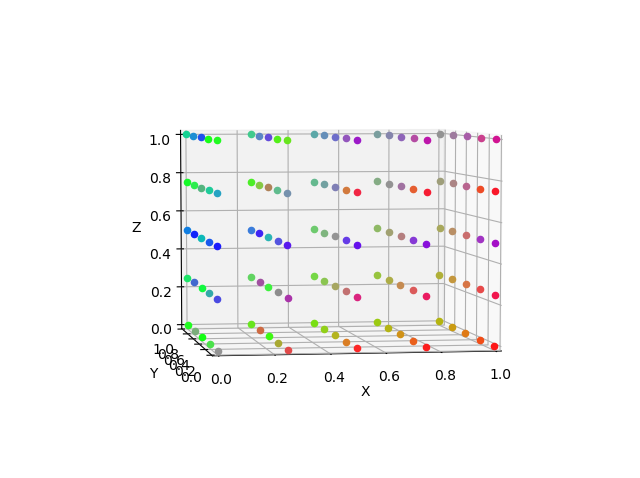
なんじゃこりゃあ…
スプライン補間はデータ点数が少ないと、変な値に吹っ飛ぶ性質がある。元のデータを6x6x6にしてみると、
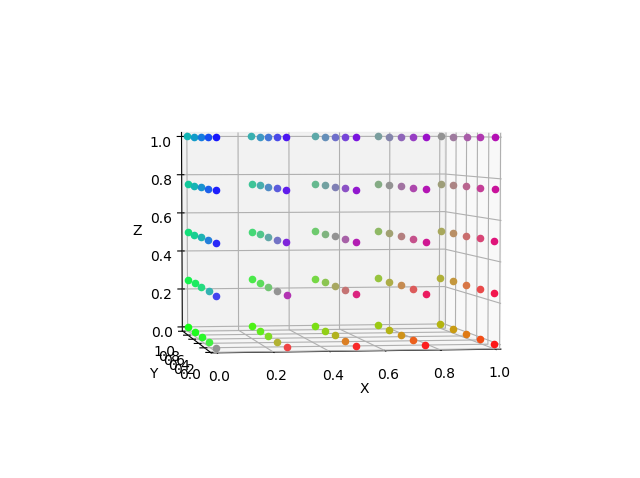
今度はベリーグッド。線形補間に比べてどれくらいグッドかというと、
import numpy as np
import scipy.interpolate as itpl
from eqtools3.trispline import Spline

def func(x):
    x0 = x + 0.1
    return x0 / np.linalg.norm(x0, axis=-1).reshape(-1, 1)

def gen_mesh(n_point):
    return np.mgrid[0:1:n_point * 1j, 0:1: n_point * 1j, 0:1: n_point * 1j].transpose(1,2,3,0).reshape(-1,3)

def main():
    n = 6
    x = gen_mesh(n)
    y = func(x)
    grid = np.linspace(0., 1., n)
    fs = np.apply_along_axis(lambda s : Spline(grid, grid, grid, s.reshape(n,n,n)), 0, y)
    xi = gen_mesh(5)
    l_yi = itpl.griddata(x, y, xi, method ='linear')
    q_yi = np.transpose([f.ev(xi[:,0], xi[:,1], xi[:,2]) for f in fs], (1, 0))
    y = func(xi)
    l_rms = np.linalg.norm(l_yi - y, axis=0).mean()
    q_rms = np.linalg.norm(q_yi - y, axis=0).mean()
    print(f'linear error:{l_rms}  triqubic error:{q_rms}')

if __name__=='__main__':
    main()
結果:
linear error:0.040595399704569025 triqubic error:0.016083663285396444
真の値に対する誤差(ノルムの平均)が1/3近くになった。
scipy.interpolate.Rbf
SciPyでは、xが3次元以上でのスプライン補間はこれしかない。
import numpy as np
import scipy.interpolate as itpl

def func(x):
    x0 = x + 0.1
    return x0 / np.linalg.norm(x0, axis=-1).reshape(-1, 1)

def gen_mesh(n_point):
    return np.mgrid[0:1:n_point * 1j, 0:1: n_point * 1j, 0:1: n_point * 1j].transpose(1,2,3,0).reshape(-1,3)

def main():
    n = 6
    x = gen_mesh(n)
    y = func(x)
    rbf_methods = ['multiquadric', 'inverse', 'gaussian', 'cubic', 'quintic', 'thin_plate']
    r_fs = {m : np.apply_along_axis(lambda s : itpl.Rbf(x[:,0], x[:,1], x[:,2], s, function=m), 0, y) for m in rbf_methods}
    xi = gen_mesh(5)
    l_yi = itpl.griddata(x, y, xi, method ='linear')
    r_yis = {m : np.transpose([f(xi[:,0], xi[:,1], xi[:,2]) for f in r_fs[m]], (1, 0)) for m in rbf_methods}
    y = func(xi)
    l_rms = np.linalg.norm(l_yi - y, axis=0).mean()
    r_rmss = {m : np.linalg.norm(r_yis[m] - y, axis=0).mean() for m in rbf_methods}
    print(f'linear error:{l_rms}')
    for m in rbf_methods:
        print(f'rbf method {m}:{r_rmss[m]}')

if __name__=='__main__':
    main()
結果:
linear error:0.040595399704569025
rbf method multiquadric:0.025856550471954256
rbf method inverse:0.03722481951469716
rbf method gaussian:0.15861526823472796
rbf method cubic:0.019392266671882787
rbf method quintic:0.01753359853260793
rbf method thin_plate:0.016937250215736225
Rbfのなかで一番いいのはthin_plateだが、それでもeqtools3のtricubicに負ける。ちなみに補間元のnを4にすると、
linear error:0.17569675718592714
rbf method multiquadric:0.10572091068989616
rbf method inverse:0.12686855165717628
rbf method gaussian:0.21166081421845273
rbf method cubic:0.0851008546325701
rbf method quintic:0.08189647891194658
rbf method thin_plate:0.11220548353601047
今度はquinticのほうがいい。しかし条件によってはルンゲ現象を起こすはず。
ちなみにこのscipy.interpolate.Rbf、補間元のxがグリッドになっていないunstructuredなデータでも使える。
結論
- 3次元のスプライン補間はPythonで使える
- tricubicとthin_plateが使える
- 条件がよければtricubicが一番いいが、条件が悪いと変な値に吹っ飛ぶ
- tricubicには、あまり信用できないパッケージが必要で、しかもpipで入らない
- 補間元のxがグリッドになっていない(unstructuredな)データなら、thin_plateしかない
- SciPyにもtricubic補間が欲しい!