こんにちは、 @haeena です。
この記事は NTTコミュニケーションズ Advent Calendar 2017 の14日目のようです
2017年10月にリリースされた Grafana 4.6より、Grafana自体にannotationを記録する事ができるようになりました1。今回はGrafanaのannotation機能を利用して、試験の結果のグラフをしこたま生成していこうと思います。PNG画像のexportもDashboardのSnapshotもあるよ。
この記事ではAPIを利用してannotationを付けていきますが、Dashboardから直にannotationをつけると上図のような感じになります 2
モチベーション
- パフォーマンス系の試験をしたくなった
- 計測系のsetupは楽にしたい
- Grafana + Prometheusが好き
- 見栄えのよい画像を生成したい時もあるじゃないですか3
- 結果はグラフが残っていれば、まぁいいや
- どちらかというと試験方法が再現可能なことが大事だよね
構成
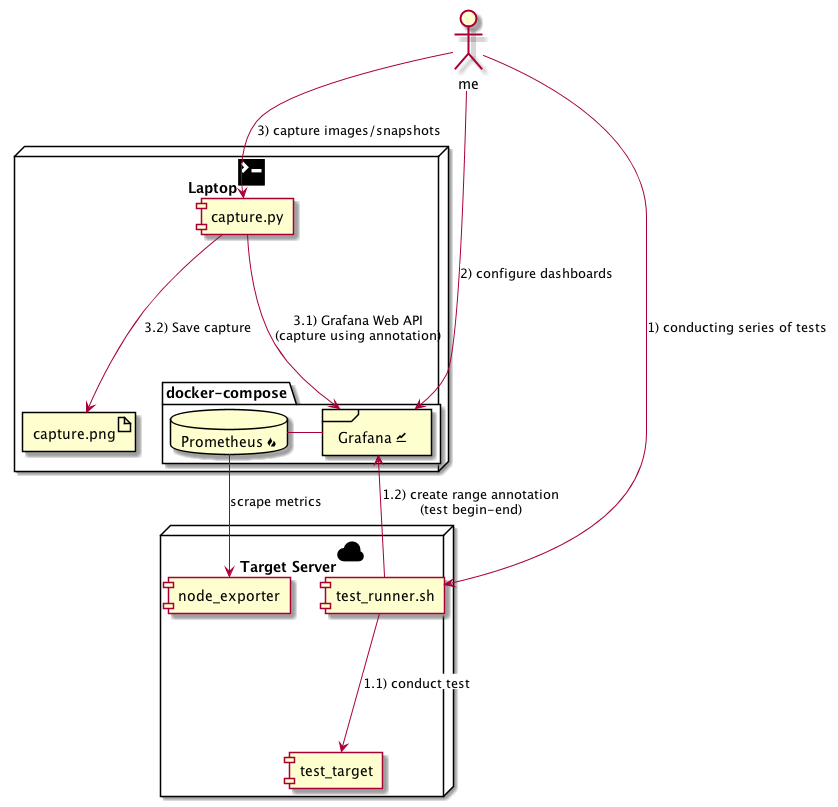
今回は上記のような構成を組んでみました。
試験サーバと計測サーバ(今回は手元のMac)を用意して、試験サーバで何かテストを行う想定です。
メトリクス収集(Grafanaのデータソース)にはPrometheus/node_exporterを使っています。
Prometheusがsetupがとても楽なのでちょっとした計測にも使っていきたいのですが、時間の経ったデータはそっと消してしまいがち4なところがあります。また、Prometheusはイベントの発生時刻を記録する機能がないので、それをGrafanaのannotation+snapshot/exportと組み合わせて補おうという構成です。
利用したソフトウェアのバージョンは下記の通りです。
Grafana 4.6.2
Prometheus 2.0
node_exporter 0.15.2
Laptop は macOS HighSierra に docker for Mac と docker-compose を導入したもの、
Target Server は Ubuntu 16.04 (x86_64) で動いております。
setup
計測サーバ側の設定
Grafana/Prometheusを上げる
さっくりとdocker-composeを使ってGrafana/Prometheusを上げます
version: '3'
services:
  grafana:
    image: grafana/grafana
    container_name: grafana
    ports:
      - 3000:3000
    env_file:
      - grafana.env
  prometheus:
    image: prom/prometheus
    container_name: prometheus
    volumes:
      - prometheus.yml:/etc/prometheus/prometheus.yml
    ports:
      - 9090:9090
GF_PATH_DATA=/var/lib/grafana/data
GF_SECURITY_ADMIN_PASSWORD=secret
GF_SERVER_ROOT_URL=http://localhost:3000
global:
  scrape_interval:     5s
  evaluation_interval: 5s
  external_labels:

rule_files:

scrape_configs:
  - job_name: 'prometheus'
    static_configs:
      - targets:
        - 'localhost:9090'
  - job_name: 'node'
    static_configs:
      - targets:
        - 'TARGET_SERVER_IP:9100'
TARGET_SERVER_IP は 計測対象サーバのIPにしといてください。
> pip install docker-compose
> docker-compose up -d
Grafana API tokenの取得、TAGの指定
> curl -X POST -H "Content-Type: application/json" -d '{"name":"apikey", "role": "Admin"}' http://admin:secret@localhost:3000/api/auth/keys
{"name":"apikey","key":"API_TOKEN"}
admin role の API token を発行し、後ほど使うために下記のようにファイルに記録しておきます
ついでに後程使う他の環境変数も定義してしまいましょう
GRAFANA_API_TOKEN=API_TOKEN
GRAFANA_BASE_URL=http://localhost:3000
TEST_NAME=nttcomadvent2017
TEST_TAG=test_tag
SERIES_TAG=series_tag
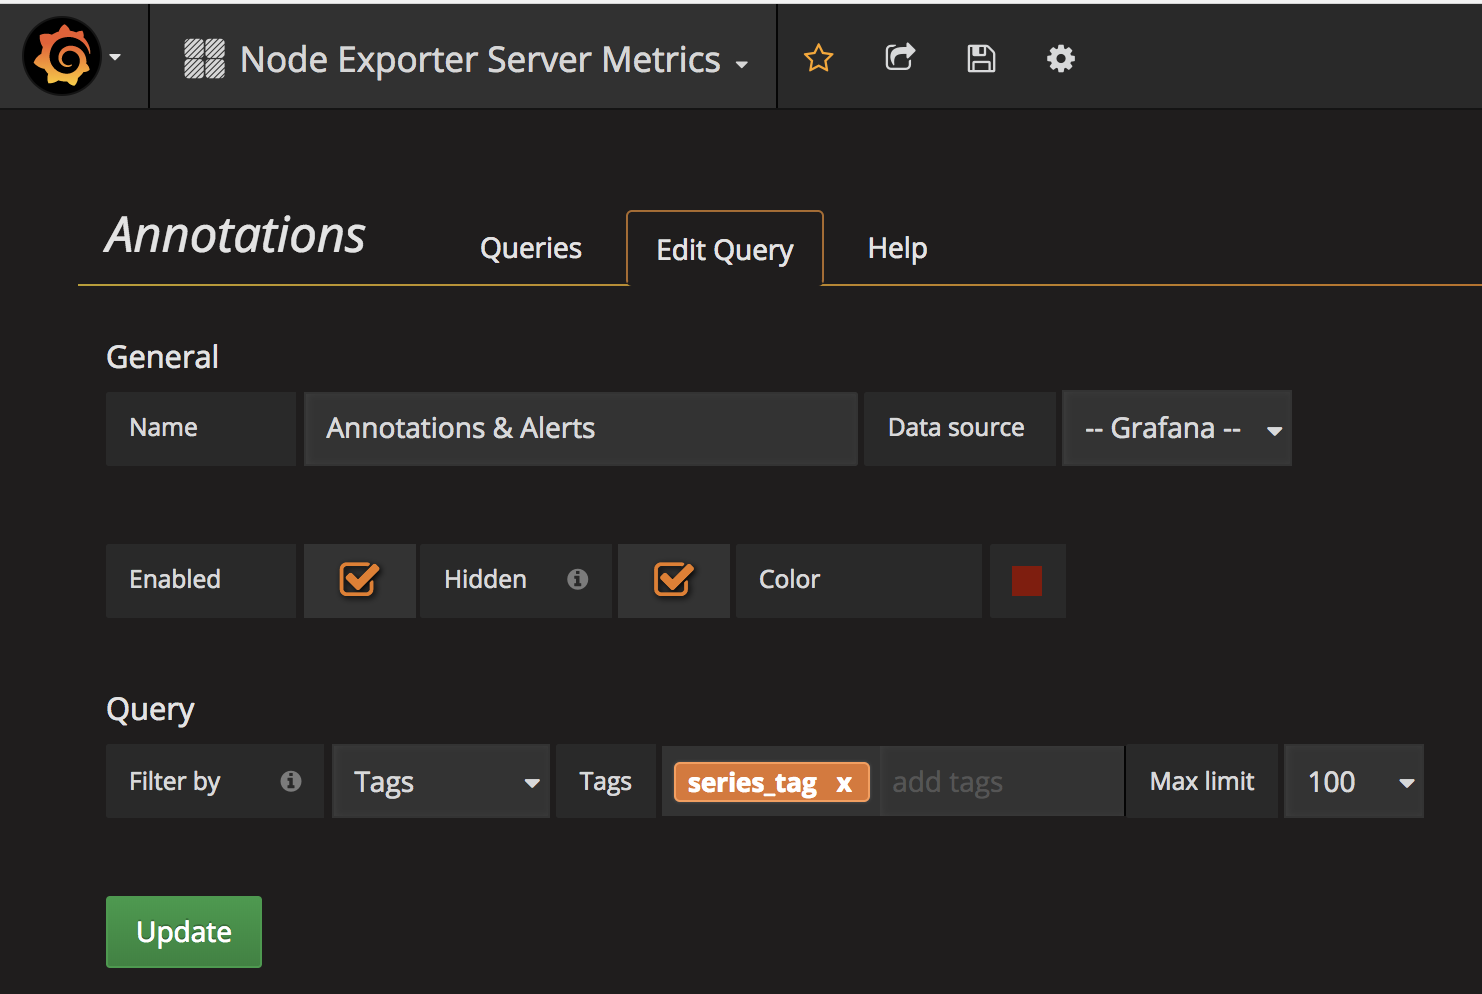
Dashboard の config (tagのひも付け)
まずはお好みのdashboardをconfigしてください。
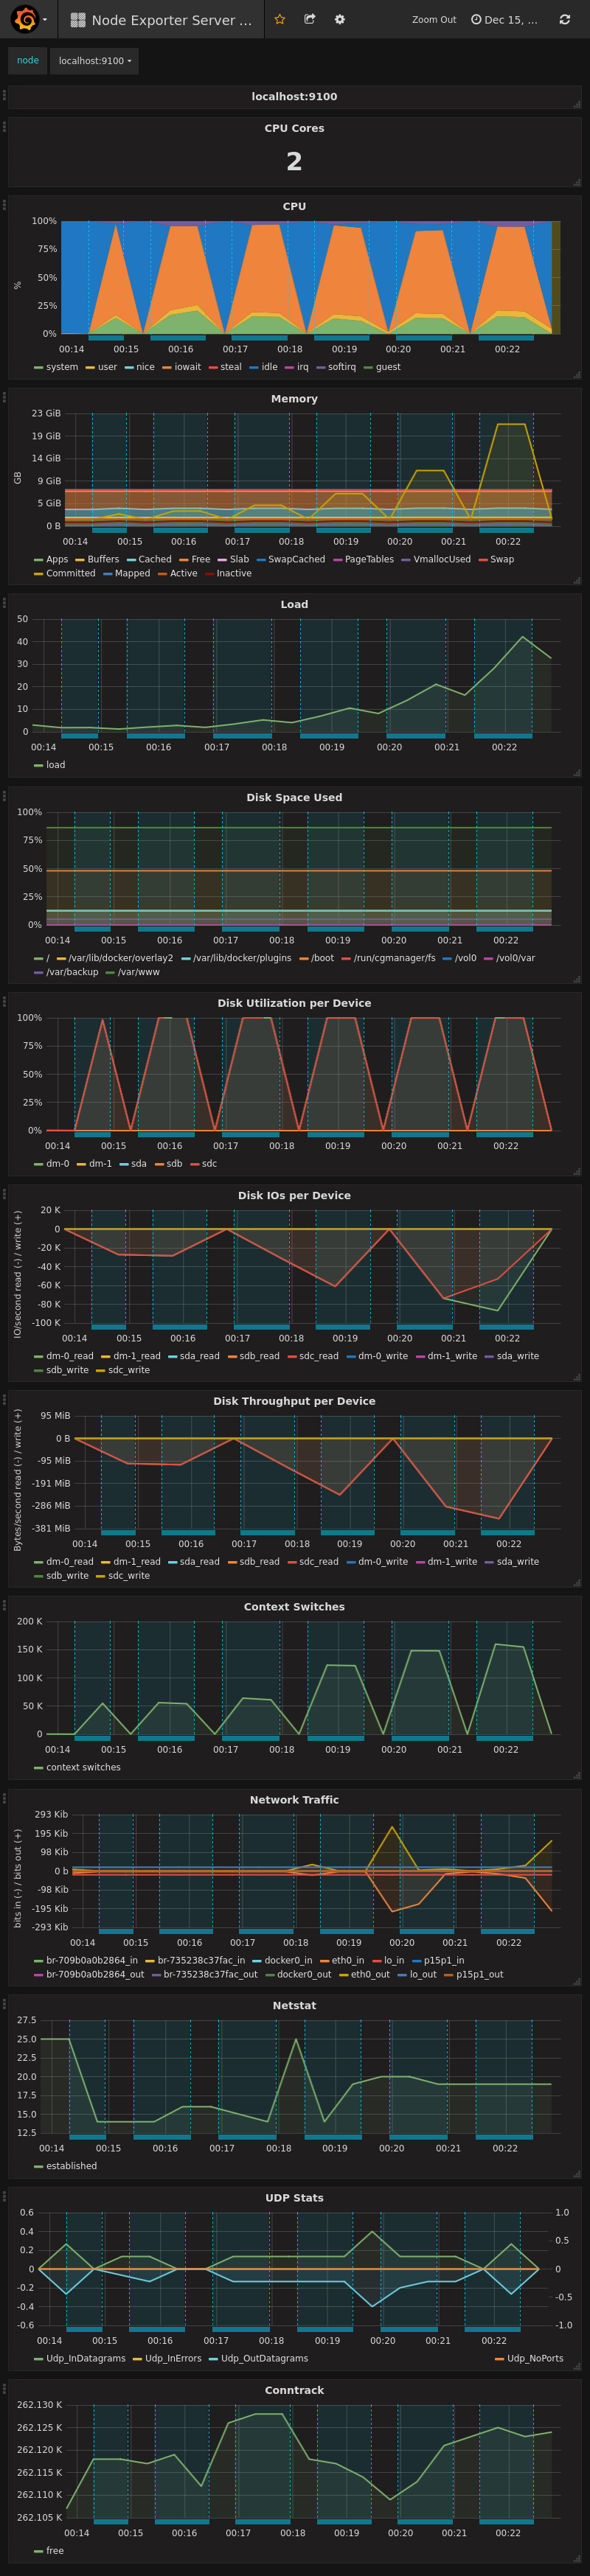
とりあえず今回は node_exporter で最もDL数の多かったら [Node Exporter Server Metrics(https://grafana.com/dashboards/405) を importして使うことにします。
データをとってざっと見てみた後で、物足りない感じを受けたので、 Node Exporter Full も importしてみました。
importしたdashbaord自体にtagをつけます(上記の環境変数のTEST_TAGと合わせる)。
capture対象のdashboardを指定するために用います。今回は一つのdashboardのみ設定しますが、ここで複数のdashboardにtagを設定しておくと、後ほどのcaptureでまとめて画像生成ができます。
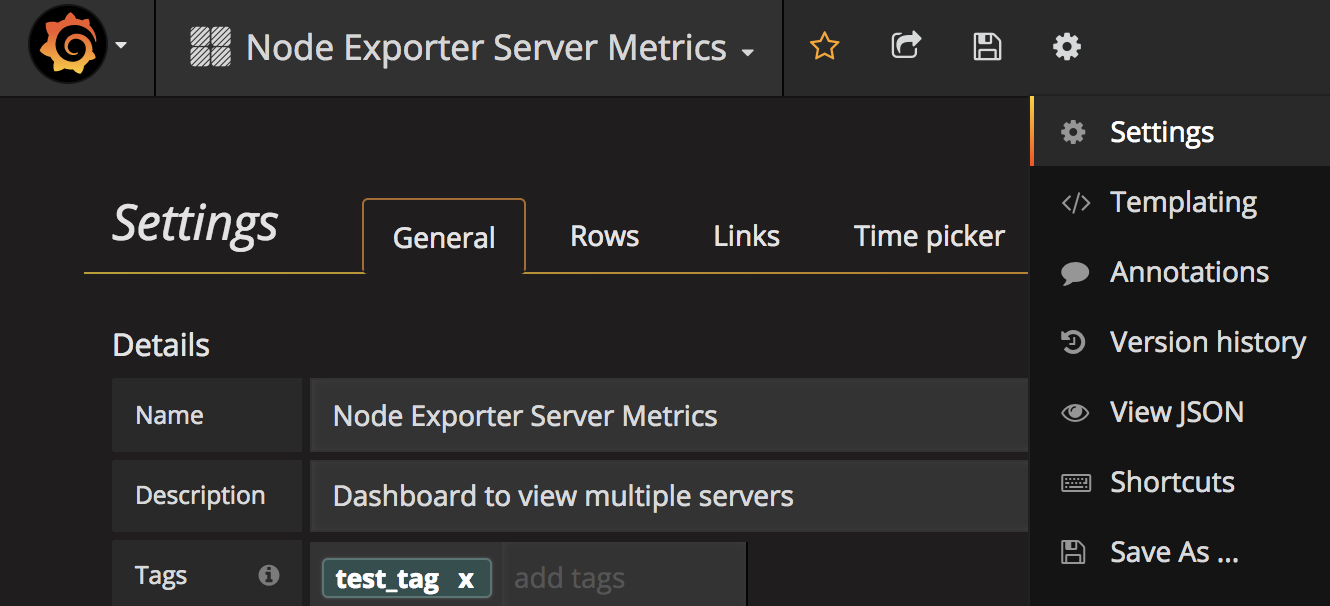
また、dashboard上に表示する annotation を tag名(上記の環境変数のSERIES_TAGと合わせる)で指定します。
もちろん上記設定はAPIから実施してもOKです。
試験対象サーバ側の設定
node_exporterの取得と起動
ここは本論ではないので、とりあえず nohup で上げておきましょう。
curl -L -O https://github.com/prometheus/node_exporter/releases/download/v0.15.2/node_exporter-0.15.2.linux-amd64.tar.gz
tar zxvf node_exporter-0.15.2.linux-amd64.tar.gz
cd node_exporter-0.15.2.linux-amd64
nohup ./node_exporter &
環境変数ファイルの持込 / テスト用スクリプトの配置
計測サーバ側で作った変数定義を試験対象のサーバに持ち込みます。この際、GRAFANA_BASE_URL の中のホスト名は計測サーバのIPに置き換えます。
GRAFANA_API_TOKEN=API_TOKEN
GRAFANA_BASE_URL=http://METRICS_SERVER_IP:3000
TEST_NAME=nttcomadvent2017
TEST_TAG=test_tag
SERIES_TAG=series_tag
テスト用スクリプトを配置します。実際にテストする内容はなんでもいいのですが。今回は fio を流してみることにしましょう。
試験開始-終了の期間にTEST_TAGでannotationをつけ、またfioの1回の実行ごとにSERIES_TAGでannotationをつけています。
# !/bin/bash
set -eu

. .env

## Grafana Web API で annotation を作製する関数
annotation_create() {
  local api_ep=${GRAFANA_BASE_URL}/api/annotations
  local method=POST

  local time_from=$1
  local time_to=$2
  local tag=$3
  local description=$4

  curl -v -X ${method} -H "Authorization: Bearer ${GRAFANA_API_TOKEN}" -H "Content-Type: application/json" ${api_ep} \
  -d '
  {
    "time": '"'${time_from}'"',
    "isRegion": true,
    "timeEnd": '"'${time_to}'"',
    "tags": ['"'${tag}'"'],
    "text": "'"'${description}'"'
  }
  '
}

## 試験期間全体を `TEST_TAG` で annotate する
## 試験実施中、区切りのいいタイミングで `SERIES_TAG` で annotationを作る
test() {
  test_time_from="$(date +%s%3N)"
  sleep 30

  for i in {1..6}; do
    jobs=$((2**$i))
    fio_time_from="$(date +%s%3N)"
    fio -filename=/tmp/test2g -direct=1 -bs=4k -size=2G -numjobs=${jobs} -runtime=300 -name=test$i
    fio_time_to="$(date +%s%3N)"
    annotation_create $fio_time_from $fio_time_to $SERIES_TAG "fio,-direct=1,-bs=4k,-size=2G,-numjobs=${jobs},-runtime=300,-test=$i"
  done
  sleep 30
  test_time_end="$(date +%s%3N)"
  annotation_create $test_time_from $test_time_to $TEST_TAG ""
}

test
では、テスト用のスクリプトを流します
> bash test_runner.sh
(snip)

*   Trying ::1...
* Connected to TARGET_SERVER_IP port 3000 (#0)
> POST /api/annotations HTTP/1.1
> Host: TARGET_SERVER_IP:3000
> User-Agent: curl/7.47.0
> Accept: */*
> Authorization: Bearer API_TOKEN
> Content-Type: application/json
> Content-Length: 143
>
* upload completely sent off: 143 out of 143 bytes
< HTTP/1.1 200 OK
< Content-Type: application/json
< Date: Thu, 14 Dec 2017 15:02:01 GMT
< Content-Length: 30
<
* Connection #0 to host localhost left intact
{"message":"Annotation added"}
無事、annotation が追加されているようです。
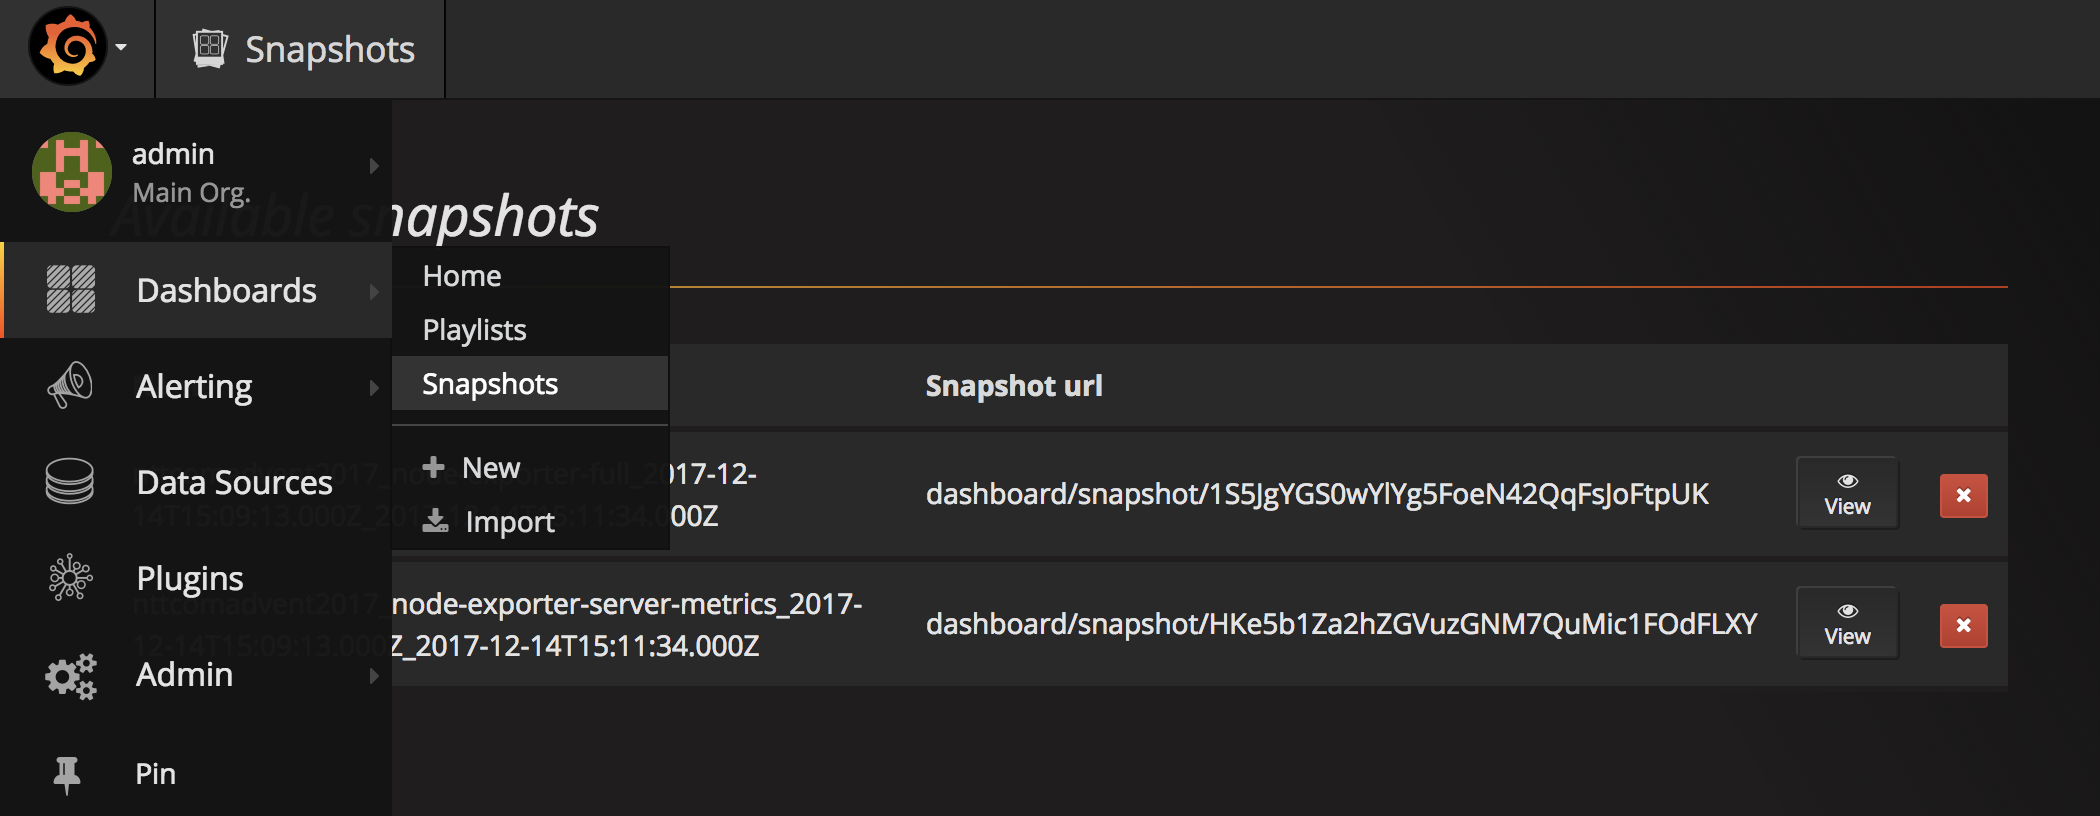
annotation の確認
追加された annotation は
capture する
PNG画像をcaptureしつつ、Grafana上にもsnaspshotを残します。
PNG画像はDashboard全体のcaptureと、panel単位でのcaptureの双方を取得してみましょう。
取得したPNG画像はパワポ曼陀羅に張り込んだりするといいと思います。
余談ですが、Grafanaは画像生成の裏で phantomjs を動かしているようです。
また、snapshotはDatasourceからdashboardの描画に必要なデータを取り出してGrafanaのDBに蓄積するので、Prometheus側でデータが消えても安心です。また、画像で保存するのとは異なりGrafanaのインタラクティブなUIをそのまま使えるメリットもあります。
とりあえず下記のようなscriptを用意してみました。
やってることはシンプルで、
-
TEST_TAGから dashboard を探す -
TEST_TAGから annotation(time_from, time_to)を探す - 見つかった dashboard と annotation (期間)の組み合わせで、dashboardを画像とsnapshotとして保存していく、ついでにdashboardはパネル一枚ずつの画像も生成する。
というだけになります。
なんか GrafanaのAPIを呼ぶ良さげなlibraryがあるかなーと思ったんですが、なかったので、ちまちま requests で書いている関係でやや長になってしました。(gistかなんかに上げる方がいいんですかね?)
import os
import re
import datetime
import requests
import shutil

GRAFANA_API_TOKEN = os.environ.get("GRAFANA_API_TOKEN")
GRAFANA_BASE_URL = os.environ.get("GRAFANA_BASE_URL") or "http://localhost:3000"

TEST_NAME = os.environ.get("TEST_NAME") or "TEST"
TEST_TAG = os.environ.get("TEST_TAG") or "tag"

CAPTURE_DIR = os.environ.get("CAPTURE_DIR") or ""

def get_annotations(time_from=None, time_to=None, alertId=None, dashboardId=None, panelId=None, tags=[], limit=None):
    api_ep = "{}/api/annotations".format(GRAFANA_BASE_URL)
    method = "GET"
    headers = {
        "Authorization": "Bearer {}".format(GRAFANA_API_TOKEN),
        "Content-Type": "application/json"
    }

    params = {}
    if time_from:
        params["time_from"] = time_from
    if time_to:
        params["time_to"] = time_to
    if alertId:
        params["alertId"] = alertId
    if dashboardId:
        params["dashboardID"] = dashboardId
    if panelId:
        params["panelId"] = panelId
    if tags:
        params["tags"] = tags
    if limit:
        params["limit"] = limit

    response = requests.request(
        method,
        api_ep,
        params=params,
        headers=headers)

    return response.json()

def get_dashboard(slug):
    api_ep = "{}/api/dashboards/db/{}".format(GRAFANA_BASE_URL, slug)
    method = "GET"
    headers = {
        "Authorization": "Bearer {}".format(GRAFANA_API_TOKEN),
        "Content-Type": "application/json"
    }

    response = requests.request(
        method,
        api_ep,
        headers=headers)

    return response.json()

def search_dashboards(query=None, tag=None, starred=None, tagcloud=None):
    api_ep = "{}/api/search".format(GRAFANA_BASE_URL)
    method = "GET"
    headers = {
        "Authorization": "Bearer {}".format(GRAFANA_API_TOKEN),
        "Content-Type": "application/json"
    }

    params = {}
    if query:
        params["query"] = query
    if tag:
        params["tag"] = tag
    if starred:
        params["starred"] = starred
    if tagcloud:
        params["tagcloud"] = tagcloud

    response = requests.request(
        method,
        api_ep,
        params=params,
        headers=headers)

    return response.json()

def create_snapshot(dashboard, name=None, expire=None, external=None, key=None, deleteKey=None, time_from=None, time_to=None):
    api_ep = "{}/api/snapshots".format(GRAFANA_BASE_URL)
    method = "POST"
    headers = {
        "Authorization": "Bearer {}".format(GRAFANA_API_TOKEN),
        "Content-Type": "application/json"
    }

    dashboard = dashboard["dashboard"] if "dashboard" in dashboard else dashboard

    if time_from:
        dashboard["time"]["from"] = timestr_from_unix_ms(time_from)
    if time_to:
        dashboard["time"]["to"] = timestr_from_unix_ms(time_to)

    post_json = {
        "dashboard": dashboard
    }
    if name:
        post_json["name"] = name
    if expire:
        post_json["expire"] = expire
    if external:
        post_json["external"] = external
    if key:
        post_json["key"] = key
    if deleteKey:
        post_json["deleteKey"] = deleteKey

    response = requests.request(
        method,
        api_ep,
        json=post_json,
        headers=headers)

    return response.json()

def save_rendered_dashbaord_to_file(slug, filename, vars=None, panelId=None, width=None, height=None, tz=None, timeout=None, time_from=None, time_to=None):
    api_ep = "{}/render/dashboard/db/{}".format(GRAFANA_BASE_URL, slug)
    method = "GET"
    headers = {
        "Authorization": "Bearer {}".format(GRAFANA_API_TOKEN),
        "Content-Type": "application/json"
    }

    params = {}
    if panelId:
        params["panelId"] = panelId
        api_ep = api_ep.replace("/render/dashboard", "/render/dashboard-solo")
    if width:
        params["width"] = width
    if height:
        params["height"] = height
    if tz:
        params["tz"] = tz
    if timeout:
        params["timeout"] = timeout
    if time_from:
        params["from"] = time_from
    if time_to:
        params["to"] = time_to
    if vars:
        for var, value in vars.items():
            var_name = "var-{}".format(var)
            params[var_name] = value

    path = os.path.join(CAPTURE_DIR, filename)

    response = requests.request(
        method,
        api_ep,
        params=params,
        headers=headers,
        stream=True)
    if response.status_code == 200:
        with open(path, 'wb') as f:
            response.raw.decode_content = True
            shutil.copyfileobj(response.raw, f)
    return

def timestr_from_unix_ms(unix_ms):
    return datetime.datetime.utcfromtimestamp(int(unix_ms/1000)).strftime("%Y-%m-%dT%H:%M:%S.000Z")

def extract_panels_from_dashboard(dashboard):
    dashboard = dashboard["dashboard"] if "dashboard" in dashboard else dashboard

    panels = []
    for row_id, row in enumerate(dashboard["rows"]):
        height = row["height"].replace("px","")
        for panel in row["panels"]:
            panel_id = panel["id"]
            title = panel["title"]
            panels.append({"row_id": row_id, "panel_id": panel_id, "title": title, "height": height})

    return panels

def extract_panels_from_dashboard(dashboard):
    dashboard = dashboard["dashboard"] if "dashboard" in dashboard else dashboard

    panels = []
    for row_id, row in enumerate(dashboard["rows"]):
        height = int(re.match("[\d]*", row["height"])[0]) if isinstance(row["height"], str) else row["height"]
        for panel in row["panels"]:
            panel_id = panel["id"]
            title = panel["title"]
            panels.append({"row_id": row_id, "panel_id": panel_id, "title": title, "height": height})

    return panels

def main():
    test_tag = TEST_TAG

    ## retrieve list of dashboard info matching test tag
    dashboards_info = search_dashboards(tag=test_tag)

    # create list of dashbaord json
    dashboards = {}
    for dashboard_info in dashboards_info:
        slug = os.path.basename(dashboard_info["uri"])
        dashboards[slug] = get_dashboard(slug)

    # search list of annotation matching test tag
    annotations = get_annotations(tags=[test_tag])

    # create range by pairing annotations
    time_regions = {}
    for regionId in set(map(lambda x: x["regionId"], annotations)):
        #annotation_pair = filter(lambda x: x["regionId"]==regionId, annotations)
        #time_pair = sorted(map(lambda x: x["time"], annotation_pair))
        time_pair = sorted([a["time"] for a in annotations if a["regionId"] == regionId])
        region_str = "{0[0]}_{0[1]}".format(tuple(map(timestr_from_unix_ms, time_pair)))
        time_regions[region_str] = time_pair

    # for all dashboards, for all time region, mathcing test tag
    for slug, dashboard in dashboards.items():
        for region_str, v in time_regions.items():
            snapshot_name = "{}_{}_{}".format(TEST_NAME, slug, region_str)
            capture_name = snapshot_name + ".png"
            time_from = v[0]
            time_to = v[1]

            # create snapshot w/ name
            create_snapshot(dashboard, name=snapshot_name, time_from=time_from, time_to=time_to)

            # capture whole dashboard
            save_rendered_dashbaord_to_file(slug, capture_name, timeout=3000, time_from=time_from, time_to=time_to)

            # capture panels for dashboards
            panels = extract_panels_from_dashboard(dashboard)
            for panel in panels:
                row_id = panel["row_id"]
                panel_id = panel["panel_id"]
                height = panel["height"]
                panel_capture_name = "{}_{}_{}_{}_{}.png".format(TEST_NAME, slug, row_id, panel_id, region_str)
                save_rendered_dashbaord_to_file(slug, panel_capture_name, panelId=panel_id, height=height, timeout=60, time_from=time_from, time_to=time_to)

if __name__ == "__main__":
    main()
実行します
> . .env
> pip install requests
> python capture.py

...
exportするdashboardのデータ量によっては、captureの生成に少し時間がかかります。
時々 phantomjs がささっていることもあるので、その際はGrafanaごと上げ直してしまうといいです。
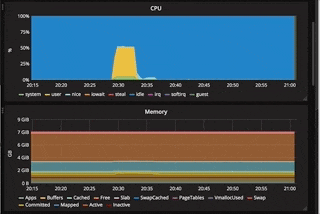
results
image
パネル毎に画像を精製しているので、パネル数の多いダッシュボードを対象に入れるとすごいことになりました。
パネルを一つだけ抜き出すとこんな感じのものになります。
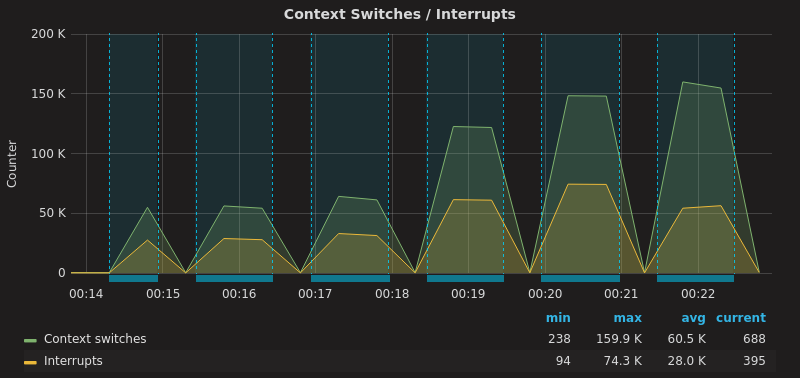
全体的には、とてもたくさん画像ができました。
> ls *.png
...
nttcomadvent2017_node-exporter-full_9_33_2017-12-14T15:13:48.000Z_2017-12-14T15:22:58.000Z.png
nttcomadvent2017_node-exporter-full_9_34_2017-12-14T15:09:13.000Z_2017-12-14T15:11:34.000Z.png
nttcomadvent2017_node-exporter-full_9_34_2017-12-14T15:13:48.000Z_2017-12-14T15:22:58.000Z.png
nttcomadvent2017_node-exporter-full_9_35_2017-12-14T15:09:13.000Z_2017-12-14T15:11:34.000Z.png
nttcomadvent2017_node-exporter-full_9_35_2017-12-14T15:13:48.000Z_2017-12-14T15:22:58.000Z.png
nttcomadvent2017_node-exporter-full_9_36_2017-12-14T15:09:13.000Z_2017-12-14T15:11:34.000Z.png
nttcomadvent2017_node-exporter-full_9_36_2017-12-14T15:13:48.000Z_2017-12-14T15:22:58.000Z.png
nttcomadvent2017_node-exporter-full_9_37_2017-12-14T15:09:13.000Z_2017-12-14T15:11:34.000Z.png
nttcomadvent2017_node-exporter-full_9_37_2017-12-14T15:13:48.000Z_2017-12-14T15:22:58.000Z.png
nttcomadvent2017_node-exporter-full_9_66_2017-12-14T15:09:13.000Z_2017-12-14T15:11:34.000Z.png
nttcomadvent2017_node-exporter-full_9_66_2017-12-14T15:13:48.000Z_2017-12-14T15:22:58.000Z.png
nttcomadvent2017_node-exporter-full_9_9_2017-12-14T15:09:13.000Z_2017-12-14T15:11:34.000Z.png
nttcomadvent2017_node-exporter-full_9_9_2017-12-14T15:13:48.000Z_2017-12-14T15:22:58.000Z.png
nttcomadvent2017_node-exporter-server-metrics_0_11_2017-12-14T15:09:13.000Z_2017-12-14T15:11:34.000Z.png
nttcomadvent2017_node-exporter-server-metrics_0_11_2017-12-14T15:13:48.000Z_2017-12-14T15:22:58.000Z.png
nttcomadvent2017_node-exporter-server-metrics_10_12_2017-12-14T15:09:13.000Z_2017-12-14T15:11:34.000Z.png
nttcomadvent2017_node-exporter-server-metrics_10_12_2017-12-14T15:13:48.000Z_2017-12-14T15:22:58.000Z.png
nttcomadvent2017_node-exporter-server-metrics_11_21_2017-12-14T15:09:13.000Z_2017-12-14T15:11:34.000Z.png
nttcomadvent2017_node-exporter-server-metrics_11_21_2017-12-14T15:13:48.000Z_2017-12-14T15:22:58.000Z.png
nttcomadvent2017_node-exporter-server-metrics_12_23_2017-12-14T15:09:13.000Z_2017-12-14T15:11:34.000Z.png
...
こんな感じで、dashboard全体のcaptureも取れます。
画像exportで惜しむらくは、annotationのtextが表示されないことですかね。
snapshot
今回のscriptではsnapshotも同時に作っているので、Prometheusが落ちていても、試験期間中のグラフを見ることができます。
また、SnapshotはGrafanaのDashboardそのままにmouse overで数値を確認したりすることができます。
最後に
Grafanaで簡単に画像が生成できるので調子に乗ったら、node_exporterのdashboardだけで370枚近い画像ができるとは思いませんでした。
さっくりしてませんでしたね。
まとまってもないかもしれません。
なんにせよ、少なくともデプロイは簡便だったので、ちょっとした試験結果をcaptureしたい時にはGrafana + Prometheusが便利なのではないかと。
-
Grafana自身のDBにEvent時刻(時点 or 期間)とdescriptionなどを記録できるようになりました。GrafanaのGUI上からのannotation追加も可能に。4.6以前は外部データソースからの取り込みと表示のみがサポートされていました ↩
-
Panel上を Ctrl or Cmd + Click することで GUIから annotation をつけられます ↩
-
Grafanaをそのまま見てわからない人のために、パワポにグラフを貼り込んであれこれ注釈をつけなきゃいけないとか。お察しください ↩
-
外部のTSDBにメトリクスを保存するか、
--storage.tsdb.retentionで延ばさない限りデフォルトでは15日で消える ↩